-
Paper Information
- Previous Paper
- Paper Submission
-
Journal Information
- About This Journal
- Editorial Board
- Current Issue
- Archive
- Author Guidelines
- Contact Us
International Journal of Traffic and Transportation Engineering
p-ISSN: 2325-0062 e-ISSN: 2325-0070
2014; 3(2): 132-140
doi:10.5923/j.ijtte.20140302.09
Impact Analysis of the Panama Canal Expansion on Alabama
 Abstract
 Reference
 Full-Text PDF
 Full-text HTML
Jaehoon Kim, Michael D. Anderson, Jeffrey P. Wilson
Civil and Environmental Engineering, University of Alabama in Huntsville, Huntsville, AL 35899, U.S.A
Correspondence to: Michael D. Anderson, Civil and Environmental Engineering, University of Alabama in Huntsville, Huntsville, AL 35899, U.S.A.
| Email: |  |
Copyright © 2014 Scientific & Academic Publishing. All Rights Reserved.
The Panama Canal expansion will have significant impact on freight flow between Asia and the United States. Expectations are that the cost structure for international shipping will be reduced and freight volume using the west coast will be diverted to the east/gulf coast. The research objective is to analyze the impact of the canal expansion on the highways of Alabama. It is hypothesized that the added volume will adversely impact the highways in Alabama. The paper concludes by noting that the Alabama statewide network will not experience significant change due to the expected increase in truck trips resulting from the expansion project.
Keywords: Transportation Engineering, Panama Canal expansion, Freight analysis
Cite this paper: Jaehoon Kim, Michael D. Anderson, Jeffrey P. Wilson, Impact Analysis of the Panama Canal Expansion on Alabama, International Journal of Traffic and Transportation Engineering, Vol. 3 No. 2, 2014, pp. 132-140. doi: 10.5923/j.ijtte.20140302.09.
Article Outline
1. Introduction
- The Panama Canal expansion is a major topic of discussion in international trade and logistics because the expansion of the canal will have a significant impact on international trade routes, port facilities, freight distribution systems and the U.S maritime and intermodal systems [1]. Since its opening in 1914, the Panama Canal has been the most important connecting link between the Pacific and Atlantic Oceans. Also, the freight volume passing through the Canal has continuously increased. According to the Panama Canal Authority (ACP), the Canal`s capacity would be becoming strained in the Panama Canal expansion proposal in 2006. ACP estimated that the canal would reach its maximum capacity around 2012 [2]. After the canal reaches its capacity, ACP expected the canal would not be able to efficiently handle freight demand, therefore, waiting time for freight passing through the Canal would be conspicuously increased and service quality of the Canal would be decreased. Those negative effects will create congestion on the Panama Canal and the congestion would also reduce the canal`s competitiveness. This may result in shippers moving away from the Panama Canal to alternate routes, such as, the Suez Canal. Therefore, the ACP decided to expand the Canal`s capacity by constructing a third set of locks [2]. The expansion project began in the year 2007 and is expected to be completed in 2015 [3].The expansion of the Panama Canal project will add one new lane and two lock facilities at each end of the canal lane. After construction the canal`s capacity will be doubled and the new lane will be able to handle mega size container vessels and/or dry bulk vessels. This additional capacity is expected to shift cargo volume between Asia and the U.S. from West Coast ports to East/Gulf Coast ports [2]. The Panama Canal route is less costly and highly reliable when compared to the U.S. intermodal system but it has a longer shipping time [4]. According to a survey by Vickerman (2006), 38 percent of respondents prefer shipping rates and 43 percent of the respondents prefer reliability. Only the remaining 12 percent of respondents favor shipping time [5]. Therefore, it is expected that many shippers would use the Panama Canal as an alternative route instead of using U.S. intermodal system via West Coast ports. Also, it is anticipated that the shift will result in reducing congestion around West Coast ports [5].The goal of this research is to analyze the impact of the expansion of the Panama Canal on the highway system in the state of Alabama. The port of Mobile in Alabama is the 12th largest port by tonnage in the U.S [6]. The port of Mobile also has signed a memorandum of understanding with ACP and has been developing its facilities to handle mega size vessels by deepening the channel and upgrading to larger cranes [7]. Thus, this study identifies current freight flow between Asia and East/Gulf coast, examines the flow ratio between the port of Mobile and the research area, and then performs traffic assignment methodology to analyze the impact of the Panama Canal expansion on the Alabama statewide highway network. Using Alabama Transportation Infrastructure Model (ATIM), we analyze the level of service of the Alabama statewide highway network affected by the expansion project. The ATIM will examine volume/capacity (V/C) ratios for the Alabama statewide highway network. It is hypothesized that the increase in volume will adversely impact the highways in Alabama.
2. Literature Review
- The Panama Canal expansion project is one of the most important current transportation projects in the world today. It will allow mega size vessels to use the canal and will likely change transportation flow patterns between Asia and the U.S. as well as port utilization and transportation flows inland in the U.S. [8]. The Panama Canal Authority (ACP) established the project plan to finish its construction would end in 2014 [2]. However, the expansion project has been delayed and it is expected that the construction will be ended in 2015 [3]. ACP predicted that the Panama Canal would reach its maximum capacity between the year 2009 and 2012 [2].When capacity is reached, it will be unable to handle the growing demand and maintain quality service. Since 2004, the cargo volume growth has coincided with vessel volume growth [2]. The cargo volume growth has led to new containership sizes that are beyond the capacity of the Panama Canal lock system [5]. Therefore, ACP has decided to expand the canal to increase its capacity and to accommodate these larger vessels, and the expansion project is expected to be completed in 2015 [2] [3]. The current canal has two channels. In addition to the current two channels, an additional lane with new lock facilities will be constructed as part of the new expansion project. The third canal lane will double the Panama Canal capacity because it will increase operational efficiency and allow larger ships to pass through [2]. Moreover, according to the ACP statistics, total traffic of the Panama Canal has been slightly decreased since FY2011 [9]. The decreased traffic of Panama Canal can be interpreted as that Canal reached its capacity in 2011 thus the freight volume gradually has been diverted to other alternative routes.Current mega-containerships are too large to use the Panama Canal. The new Panama Canal lock system will be able to handle a larger containership known as Post-Panamax [1]. The current Panamax vessel has a maximum capacity of 4,500 twenty-foot equivalent units (TEU) [2]. The Post-Panamax vessel is capable of handling up to 12,000 TEU [2]. The new lock and deepening the channel through the canal will allow Post-Panamax vessels to be able to pass through. The proposed lock will also facilitate the Post-Panamax liquid and dry bulk vessels [2]. One of the greatest impacts of the Panama Canal expansion will be changes in freight flow, specifically, trade between Asia and the East/Gulf Coast of the U.S. This freight volume has traditionally used West Coast ports and travels overland on the road and/or rail network. But the canal expansion project will switch freight arrival to the East/Gulf Coasts ports [1]. There are four routes for trade between Asia and the U.S. The routes are through the Panama Canal, the Suez Canal, maritime routes around the Cape of Good Hope, and Cape Horn [2]. However, the Panama Canal is the most competitive route in East/Gulf Coast regions compared with others [10]. According to Rodrigue [5], the two major trade routes between Asia and East/Gulf Coast are the U.S intermodal routes with gateways along the West Coast and the all-water route through the Panama Canal. According to the ACP, the Panama Canal has a 38 percent market share for routing between Pacific Asia and the U.S. West Coast ports and the U.S intermodal system have 61 percent of the share. The one percent remaining is shipped via the Suez Canal [2]. The U.S intermodal system consists of a large number of components such as the West coast ports, railroad, and transcontinental road system. In the last decade, West Coast ports cost have increased due to congestion and increased trade with Asia. Furthermore, cost for the intermodal system has been increasing due to fuel cost and regulation for protecting environment. Due to this, the use of the Panama Canal has been largely increasing for the past decade [2].As mentioned above, when the Panama Canal reaches its capacity, the congestion should be increased. Then the canal will not be able to handle its demand and to maintain its service quality. Therefore, ACP expected that some portion of freight volume using the Panama Canal could switch their route to Suez Canal [2]. For example, the sea distance between Hong-Kong, China and New York, U.S via the Panama Canal is 11,207 nautical miles. The distance via Suez Canal with same origin-destination is 11,593 nautical miles. The distance between Shanghai, China and New York, U.S via the Panama Canal is 10,582 nautical miles, and the distance via Suez Canal is 12,370 nautical miles [11]. When the distance considered, the Panama Canal is better route for Northeast Asia than Suez Canal. However, for Southeast Asia, Suez Canal is the possible alternative route when distance is compared with the Panama Canal. Freight volume from Asia to West Coast ports account for 75 percent of imports from Asia. The Panama Canal expansion will allow East/Gulf Coast ports to be competitive in the shipping market. Shippers generally consider three criteria in the routing of freight which are cost, time and reliability. A survey of the world’s largest shippers concluded that 38 percent of the respondents preferred cost, 12 percent preferred transit time, and 43 percent preferred schedule reliability [5].The cost structure of freight transport is important in determining routing options. The expansion will affect the cost of operating containerships. A current Panamax shipping 4,000 TEU has annual operating expense of about $2,314/TEU [5]. Meanwhile, Post-Panamax vessels shipping 10,000 TEU have an expense of about $1,450 / TEU. The Post-Panamax vessels have approximately $860 / TEU in savings [12].The expansion of the Panama Canal is expected to increase the cost differential between the all-water route and inland intermodal system [5]. Currently, the all-water route via the Panama Canal yields a savings of about $75 per TEU per day when compared with the cost of west coast gateways and the intermodal routes, with a market share of Asian imports at about 28 percent [5]. The expansion will allow the differential to increase in the range of $100 to $125 per TEU per day savings for the all-water route [5]. As a result, the market share of all-water route would probably increase in the range of 40 to 50 percent [5].The expansion of the canal will increase its operating capacity, however, it will not lead to an increase in shipping speed [2]. Examining shipping time from Southeast Asia to the East coast, it takes freight approximately 13 days for transpacific crossing and 6 days of intermodal transport. Whereas freight travel time via the Panama Canal takes roughly 22 days and the travel time via Suez Canal is 21 days [4] [5]. Freight routed through the Panama Canal has the longest overall travel time.The U.S intermodal system moved 82 percent of U.S-Asia trade in 2000, however, the freight flow using the intermodal system has since decreased and accounted for 55 percent in 2007 [5]. The reasons why freight shifted from intermodal along West Coast to East/Gulf Coast directly are caused by unreliability of the intermodal system and cost. The intermodal travel time has been affected by labor problem such as strikes, lack of expert labor, and congestion [4]. Additionally, many major container ports in the U.S are reaching their capacity which will increase travel time. The ports of Los Angeles, Long Beach, New York, New Jersey, Seattle, Savannah and Oakland have 69 percent of the foreign trade container in 2008 [4]. The Panama Canal expansion will have a role in reducing the West Coast congestion on routes and increase diverting shipments from the West Coast to the East/Gulf Coast [12].The expansion of the Panama Canal will significantly affect port development. Due to the expansion, the East/Gulf Coast ports started increasing port capacity and deepening channels to attract volume. Additionally, many port authorities along the East/Gulf Coasts have signed memorandums of understanding with ACP [5]. For example, the port of Miami has invested in intermodal rail service, rail and bridge project to improve competitiveness [8]. Also, the port of New York and New Jersey are dredging their channels to 50 feet [5]. The Alabama State Port Authority completed improvements the port of Mobile to grow shipping volume [7]. After expanding the Panama Canal, about 208,000 TEU of cargo traffic would be diverted from the West Coast ports to Gulf/East Coast ports via the Panama Canal [13]. Specifically, freight volume at the port of Houston has the potential to increase 22 percent [13]. Also, other research estimates 25 percent of the West Coast cargo would be diverted to East/Gulf Coast ports via the Panama Canal [14].Another study shows that the expansion of the Panama Canal is expected to reduce maritime costs for the world cotton trade by 28 percent [12]. According to the research, only 15 percent of total U.S exports of cotton are transported via the West Coast ports [12]. On the other hand, exports from East/Gulf Coast ports are estimated to increase to 9,990 cotton bales from 5,119 bales which is an increase of over 95 percent [12].The various rate of diversion have been estimated. Many estimates project between 20 percent to 35 percent of the West Coast cargo will be diverted to the East/Gulf Coast [8]. However, the rate of diversion will directly depend on the toll imposed by ACP [8] [15].On the other hand, there are some opposite opinions to the impacts of the expansion of the Panama Canal. The expected diversion rate of freight flow may be overestimated because the major West Coast ports including Los Angeles, Long Beach, Portland and Seattle have been improving their intermodal service in cooperation with Western railroads to guarantee competitiveness of cost and service [8]. Also the West Coast ports will ameliorate road service to reduce congestions on network around the port areas [8].The Alabama Transportation Infrastructure Model (ATIM) is a discrete event simulation model which analyzes the impact of changing freight patterns for accurate planning of transportation infrastructure [16]. The ATIM is able to generate performance measures that are average speed and average congestion level for road segments [17]. After running the simulation, the output will provide an origin/destination (O/D) matrix which identifies the locations where the cargo trips begin and end [17]. The table will include the freight volumes for each O/D pair.
3. Methodology
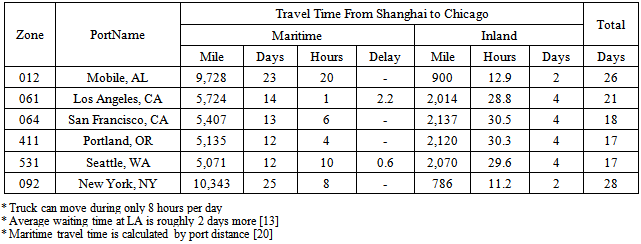
- For this research, the best available freight data is the Federal Highway Administration`s (FHWA) third generation Freight Analysis Framework (FAF3) database [18]. The FAF3 is developed by FHWA to provide data and analytical capability for various public needs. The FAF3 integrates data from the 2007 Commodity Flow Survey (CFS) and various sources to develop a comprehensive representation of freight flow throughout the states and major metropolitan areas by a variety of transportation modes [18]. The FAF3 provides a commodity flow O/D matrix based on type of commodity and mode of transportation for all highways within the FAF3 network. Also, it contains freight flow forecast estimates for the years 2010 through 2040 in five year increments and freight flow between eight international U.S trade partners. In addition, current FAF3 database also provides 2011 provisional database. The database is used to analyze the impact of the Panama Canal expansion. First of all, the total trade volume between U.S and Asia because it is necessary to identify important international trade port in U.S. Total 47 zones out of 123 FAF3 zones have freight volume by waterway with Asia. However, the zones in the top twenty handle more than 95% of freight volume traded with Asia. This research focuses on trade volume, specifically, imported freight with Asia due to the fact that the Panama Canal is most the important route for international trade between the eastern U.S and Asia [2]. Using the FAF3 O/D table, various queries were performed to select necessary O/D pairs. The FAF3 O/D table uses a coded structure to label zones throughout the United States and across the globe. For the first query, Asia (code 807) is selected to perform the analysis. The next step is to select major international ports in the U.S for performing necessary O/D pair operations. As a result of this step, we can reckon that 57.7 percent of the freight from Asia in 2007 and 57.9 percent of the freight in 2015 arrive at four major ports, which are Los Angeles (061), Seattle (531), San Francisco (064), and Portland (411) all of which are along the West Coast. Therefore, these four ports are selected to analyze freight flow as a domestic origin from the West Coast to the east of the Mississippi River region. The east of the Mississippi River region consists of 27 states included the District of Columbia, and comprise a total of 72 zones in the FAF3 database. According to ACP [2], the freight market share demarcation line would be shifted further west to connect Chicago and Dallas. For this reason, Wisconsin, Iowa, Arkansas, and Missouri are merged in the east of the Mississippi River region. So there are a total of 31 states and 80 zones in the region. This research focuses on 36 FAF3 zones to analyze the impact of the expansion project. The goal of this research is to understand the impact on the port of Mobile and the Alabama statewide highway network. Consequently, we eliminate 44 zones near the East/Gulf Coast which are more influenced by other major ports along the East Coast such as, New York, Norfolk, or New Orleans than the port of Mobile. The selected 36 zones include 3 zones in Alabama, 5 zones in Florida, 3 zones in Georgia, 3 zones in Illinois, 3 zones in Indiana, 2 zones in Kentucky, 3 zones in Michigan, 1 zone in Mississippi, 3 zones in Missouri, 5 zones in Ohio, 3 zones in Tennessee, and 2 zones in Wisconsin. In addition, only the truck mode is selected in this research. The FAF3 O/D database provides a total of seven modes such as, truck, rail, air multiple modes, pipeline and unknown modes. However, the goal of this study is to analyze the impact on the Alabama statewide highway network so, the truck mode is the sole focus of this research. Processing these steps, we calculate the freight flow from Asia to the four major ports on the West Coast and the port of Mobile and then we also identify the ratio of the freight flow from the ports to research area in east of the Mississippi River region. Approximately 53 percent of freight volume from Asia arrives at the selected east of the Mississippi river regions using major the four West Coast ports and the port of Mobile. Most of the imported freight uses the port of Los Angeles; its proportion is 35.72 percent. The subsequent port is Seattle in Washington State with a proportion of 8.66 percent. The port of Mobile has 6.92 percent of the imported freight from Asia but approximately 98 percent of the freight is consumed in Alabama. Only 2 percent of the freight moves toward other research areas. According to Rodrigue [5], the three most important concerns for route choice are cost, time and reliability. If cost is the dominant factor then the all water route will be preferred. If reliability is the predominant factor, the intermodal system will be selected [5]. According to a survey by Vickerman [19], 38 percent of respondents prefer shipping rates and 43 percent of the respondents prefer reliability [5]. Only 12 percent of the respondents had a preference for shipping time. The Panama Canal route is less costly and highly reliable but it has a longer shipping time [4]. Table 1 shows travel time of freight volume from Shanghai, China to Chicago, U.S. The freight cargo would take roughly 17 to 21 days to arrive by U.S. intermodal system. On the other hand, the travel time would be 26 days if the freight uses the port of Mobile. The distance from LA to Chicago is more than 2,000 miles where the distance from Mobile to Chicago is roughly 900 miles. Also, the freight volume has to wait for more than 2 days to be unloaded at L.A. ports. As the survey shows, we can expect shippers to select the Panama Canal for an alternative route after the expansion project because the expanded canal will be able to handle the increased freight volume cheaply and reliably. For these reasons, the port of Mobile can be competitive as a gateway for trade from Asia to the east of the Mississippi River regions. Therefore, it is expected that a large amounts of freight currently using the West Coast ports will be diverted to the all-water route via the Panama Canal.
|
|
4. Case Study
4.1. Analysis
- The scenarios developed in the methodology are simulated in this chapter using ATIM. Volume/Capacity ratio (V/C ratio) is developed to analyze the impact of the expansion of the Panama Canal with a focus on the V/C ratio for the interstate highways and major arterials in each scenario.
4.2. Result One
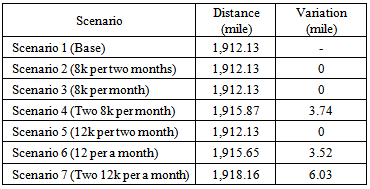
- This research identifies network segments where the V/C ratio exceeds 1.0. The V/C ratio is one of the most important measures to analyze level of service based upon capacity of network facilities. Therefore, we calculate the V/C ratio for each scenario and compare base scenario to the other scenarios. Table 3 shows the distance of overflow network segments for each scenario. The total centerline miles in Alabama are 3,514.1 miles of interstate highway and major arterials connecting with adjacent states. The total network centerline miles in Alabama with V/C ratio greater than 1.0 are 1,912.13 miles in the base scenario. However, in the scenarios the total mileage of road with V/C ratio greater than 1.0 is not significantly increased. The increasing congested network distance in scenario four is 3.74 miles and the distance is 3.52 miles in scenario six. The maximum increase is just 6.03 miles for the worst case scenario.
|
 | Figure 1. Overflow network in the scenario 1 |
 | Figure 2. Overflow network in the scenario 2 |
 | Figure 3. Overflow network in the scenario 3 |
 | Figure 4. Overflow network in the scenario 4 |
 | Figure 5. Overflow network in the scenario 5 |
 | Figure 6. Overflow network in the scenario 6 |
 | Figure 7. Overflow network in the scenario 7 |
4.3. Result Two
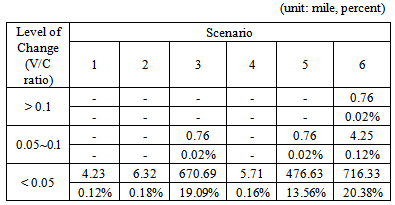
- This analysis identifies network segments where the difference of the V/C ratio between the base scenario and other scenarios exceed zero. Table 4 shows the centerline miles in Alabama when their V/C ratio is greater than the circumstances under the normal conditions. Generally, V/C ratio is increased on I-65 and I-10. In the worst case the distance of network segments with the difference exceeding zero is 721.34 miles. In 20.38 percent of the networks the V/C ratio increases when compared with the base scenario. However, the V/C ratio is only increased below 0.05 in roughly 99 percent of the segments. The network which contains the most increased V/C ratio is US 90 which connects the port of Mobile to I-165. Its V/C ratio in the worst case is 1.02. The V/C ratio is also heavily increased on the networks around Mobile, specifically, the junction connection between I-165 and I-65. Its V/C ratio is 0.82. However, it is difficult to conclude that the level of service is significantly decreased in the network.
|
5. Conclusions
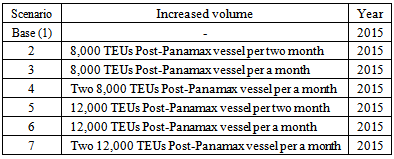
- This project analyzed the impact of the Panama Canal expansion on the Alabama statewide highway network. The project used the FAF3 O/D matrix to analyze freight flow from Asia to the east of the Mississippi River regions using a hypothesis that the freight volume will increase after the expansion. Seven scenarios were created to simulate the impact of the effect of the expansion. The scenarios were simulated by ATIM and this research examined the changed level of service as measurements. The expanded Canal will significantly affect freight flow between Asia and East/Gulf Coast. It is expected that freight volume will increase along East/Gulf Coast because the canal`s capacity will be doubled and shipping rate will be decreased. However, there is limited information about the divergence rate of freight after expansion. So, a sensitivity analysis was performed to obtain the results by using the seven following scenarios: base scenario, 8,000 TEU capacity vessel arrives at the port per two months and per month, and two vessels arrives at the port per month (Scenario 2, 3, 4), and other three scenarios have similar rates except the capacity is increased to 12,000 TEU (Scenario 5, 6, 7). It can be concluded that the Alabama statewide network will not experience significant changes due to an increase in truck trips resulting from the expansion project. The distance of the overflow network is only increased by six miles and the level of congestion is not significantly enlarged. It is possible to conclude that current highway facilities can handle the increased freight volume by the Panama Canal expansion. In conclusion, the port of Mobile has the potential to attract new clients to use the port as a means of shipping from Asia to regions at East of the Mississippi River. However, some of the highways within in the city of Mobile may experience severe congestion due to the expansion. This point is a necessary topic of study because improvements may need to be made to the Mobile highway network to maintain the attraction of the port of Mobile.