-
Paper Information
- Previous Paper
- Paper Submission
-
Journal Information
- About This Journal
- Editorial Board
- Current Issue
- Archive
- Author Guidelines
- Contact Us
International Journal of Traffic and Transportation Engineering
p-ISSN: 2325-0062 e-ISSN: 2325-0070
2013; 2(3): 51-54
doi:10.5923/j.ijtte.20130203.05
Validation of Disaggregate Methodologies for National Level Freight Data
 Abstract
 Reference
 Full-Text PDF
 Full-text HTML
Michael Anderson1, Lisa Blanchard2, Lauren Neppel2, Tahmina Khan1
1Civil and Environmental Engineering, University of Alabama in Huntsville, Huntsville, 35899, USA
2Center for Management and Economic Research, University of Alabama in Huntsville, Huntsville, 35899, USA
Correspondence to: Michael Anderson, Civil and Environmental Engineering, University of Alabama in Huntsville, Huntsville, 35899, USA.
| Email: |  |
Copyright © 2012 Scientific & Academic Publishing. All Rights Reserved.
As freight data is typically available in large, spatially aggregated databases, methodologies for the disaggregation of the data have been developed as a means to determine freight flow data for smaller geographic areas. This paper examines the validity of disaggregating freight data both using values of sales data and employment data by county as a disaggregation metric for specific commodities. The paper examines the use of disaggregation data for selected states within the Freight Analysis Framework Version 3 Database (FAF3). The paper concludes that specific commodities within the FAF3 database can be accurately disaggregated using value of sales data while other counties can be accurately disaggregated using employment data. Thus a combination of disaggregation techniques might yield the best results when disaggregating large national freight data to the county level.
Keywords: Freight, Forecasting, Statistical Validation
Cite this paper: Michael Anderson, Lisa Blanchard, Lauren Neppel, Tahmina Khan, Validation of Disaggregate Methodologies for National Level Freight Data, International Journal of Traffic and Transportation Engineering, Vol. 2 No. 3, 2013, pp. 51-54. doi: 10.5923/j.ijtte.20130203.05.
Article Outline
1. Introduction and Background
- Freight data is typically disseminated through highly aggregated national databases, such as the Freight Analysis Framework Version 3 Database (FAF3), that are not practical for local area transportation professionals due to the large spatial areas of zones, often covering multi-county urban areas, portions of states, or entire states. These highly aggregated national zones are too large to obtain specific freight flow data for individual counties. Therefore, these freight databases are not applicable to local planning efforts, thus freight is often ignored in the planning process.Several studies have been undertaken regarding the methodologies to disaggregate the FAF database including [1], [2], and [3]. Though validation efforts were attempted by a variety of means, including assignment through models and comparisons to other databases, a main limitation of these studies was the inability to verify that the disaggregation technique was successful. The goal of this paper is to develop a mechanism to evaluate the accuracy of the disaggregation techniques and test the methodology on two common disaggregation techniques.
1.1. FAF3 Database
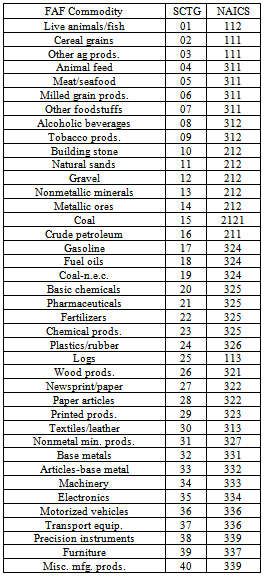
- The Federal Highway Administration’s Freight Analysis Framework, Version 3 (FAF3) is a publicly available database that provides estimates of freight movements for 131 geographical regions (FAZs), for 43 commodities (see Table 1) and 8 modes of transport[4]. These estimates are reported in both annual kilotons and millions of dollar value shipped.
 | Figure 1. FAF3 Domestic Geographic Zones |
|

1.2. Scope of Study
- The goal of this paper is to examine the efficacy of using either the value of sales data or employment data as the appropriate disaggregation variable. The paper uses a validation procedure to verify the accuracy of disaggregation different commodities. This paper presents a brief introduction and review of related work, the data used in the validation, analysis to validation the technique, and develops conclusions related to the disaggregation techniques.
2. Study Methodology
- This study was designed to validate the two disaggregation techniques developed. The first techniques uses value of sales data and handles disaggregation as:
 | (1) |
 | (2) |
2.1. Selection of States
- The approach to validation involved the use of the methodology presented and disaggregation techniques that used either employment of value of sale. Several states were considered for selection based on two key attributes. The states selected had to contain a manageable number of counties for efficient data processing and the states selected needed to contain at least two FAF3 freight analysis zones. Five states were selected for use in this study: Colorado, Indiana, Oklahoma, Tennessee, and Utah.
2.2. Employment Data
- The employment data were obtained from the Bureau of Labor Statistics and the U.S. Energy Information Administration. The employment data were available using the industry specific coding of the North American Industrial Classification System (NAICS). To use this data with the FAF3 data classified by the Standard Classification of Transported Goods (SCTG), a SCTG-NAICS cross-reference was developed to allow the use of data from both systems. The system used to cross-reference the data is show in Table 2. The two systems do not follow a natural 1-to-1 mapping. A special challenge was presented with the SCTG codes that mapped to more than one NAICS code (SCTG 30 mapped to NAICS 313, 314, and 315; SCTG 35 mapped to NAICS 334 and 335). In these two cases, the NAICS codes were grouped so that all the economic data referred to the smallest NAICS code for that group. That is, all economic data for NAICS 314 and 315 were adjusted to 313, and NAICS 335 adjusted to 334.
|
2.3. Value of Sales Data
- The value of sales data we obtained from a variety of sources. Manufacturing values are published in the Economic Census of the US Census Bureau for each state, metropolitan area, and county that contains manufacturing enterprises. If the actual data were suppressed due to privacy concerns, the values are estimated by taking the portion of the statewide value of sales not already accounted and allocating it to the remaining counties based on employment in that industry, if available. The Census of Agriculture published by the US Department of Agriculture contains a comprehensive summary of agricultural statistics for every county. Included in the series are value of sales data for various types of crops and animals sold from a particular county. The 2007 Census values were used for this projectFor mining and timber data, the US Geological Survey,US Energy Information Administration, US. State Departments of Forest Resources were used. The Bureau of Labor Statistics and population data from the US Census Bureau were used fill in gaps and provide proxies to estimate value of sales as mentioned with manufacturing.
|
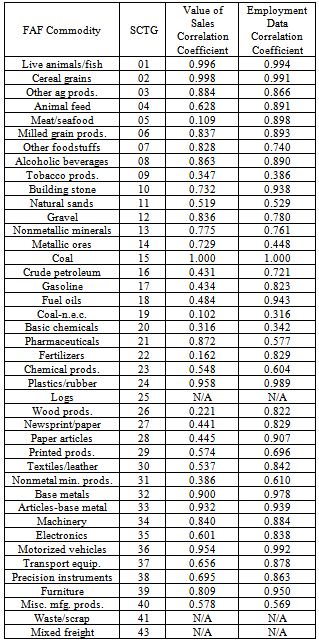
3. Results and Conclusions
- The commodity specific correlation coefficient using each of the disaggregation methodologies are presented in Table 3. Obviously from the results presented in Table 3, the disaggregation methodologies based on value of sales data or employment data have commodities that respond better depending on the nature of the industry. Certain commodities (pharmaceuticals, gravel, metallic ores and other foodstuff) show a distinct advantage when using value of sales data while other commodities (meat/seafood, gasoline, fertilizer, wood products) show a distinct advantage when employment is used. Several commodities show a direct linkage between both value of sales data and employment data when trying to disaggregate tonnage shipped, allowing either variable to provide reasonable results. Overall, the contribution of this paper is identification of which commodities perform better when disaggregating large datasets using either employment or value of sales. The paper identifies several variables that perform better using one of the two disaggregation techniques, leading to the identification of a collection of optimal variables for disaggregating national level databases to county level data for use in local and statewide transportation planning efforts.