Dadang Supriyatno, Lutfi Djakfar, Harnen Sulistio, Achmad Wijaksono
Faculty of engineering, Brawijaya University, Indonesia
Correspondence to: Dadang Supriyatno, Faculty of engineering, Brawijaya University, Indonesia.
| Email: |  |
Copyright © 2012 Scientific & Academic Publishing. All Rights Reserved.
Abstract
Transportation problem is a complex issue, because of the rate of growth of road infrastructure that is not proportional to the increase in the number of movements is increasing. This is indicated by the high level of private vehicle ownership, mobility assistance, an indication of public transport services are inadequate and limited highway. Resulting cause congestion, delay time, and decreased levels of comfort. This research is aimed to determine the pattern of mass transport based on Indonesian government legislation No. 22/2009 about traffic and road transport. Therefore, the factors that influence the pattern of mass transport must be modeled. the methods used in this research is the Confirmatory Factor Analysis (CFA) for confirmed indicators to latent variables (outer loading), and Structural Equation Modeling with PLS approach to determine the effect between the latent variables (inner weight). The results shows that variables defined has a significant positive effect on demand Guided Busway (CE) with a contribution of 77.0 per cent.
Keywords:
Transportation, Mass Transport, Confirmatory Factor Analysis (CFA), Structural Equation Modeling, PLS Approach
Cite this paper: Dadang Supriyatno, Lutfi Djakfar, Harnen Sulistio, Achmad Wijaksono, Mass Transportation Models of Needs Guided Bus-Way Using Structural Equation Modelling, International Journal of Traffic and Transportation Engineering, Vol. 2 No. 3, 2013, pp. 37-41. doi: 10.5923/j.ijtte.20130203.03.
1. Introduction
Mass transport based on UU No.9/2009 , has a definition that road transport is organized with a view to realizing the traffic and transport roads with safe, secure, fast, smooth, orderly and organized, comfortable and efficient, and able to integrate other modes of transport, to reach all parts of the mainland to support equity, growth and stability as a driver, driving and supporting national development with an affordable cost.The concept of urban movement has always dominated the movement of commuters, especially with the availability of land in the city of Surabaya increasingly difficult, so many choose expansion to the south (Sidoarjo) and the West (Gresik). Increasing population density indicates the traffic flow and the higher trip generation from the corridors of the transition to Surabaya and vice versa. This is also indicated by the severity of the jam that occurs on the highway and the length of travel time.Segment transport conditions Surabaya - Sidoarjo is still relying on road transport, the majority use for bike transport modes 55.19 percent. For that we need the development or management of a mass public transport system that has the characteristics of large transport capacity, travel time better, safe and affordable for the whole society. In particular, this study aims to get a model of mass transportation needs of the corridor Sidoarjo - Surabaya, the research needs of Guided Busway. The Guided Busway is a bus service that is reliable, fast in the city where the bus was moving as usual bus and at a certain place where the bus is equipped with two wheels in front wheels guide normal bus, which serves to guide the bus along the track that had been prepared according to plan and the position can be carried out in accordance with the bus a safe speed.Surabaya - Sidoarjo Corridors is the highest corridors of development, thus urging for the handling and mass transit systems development actions that have the characteristics of large transport capacity, travel time better, safe and affordable for the whole society. Sidoarjo path to Surabaya is Kertosusila Gate Development Area (KGDA). Therefore, the selection of study sites was very appropriate to support Surabaya Metropolitan Area.
2. Methods
The data used in this study is primary data obtained through questionnaires. The sampling method used was proporsif probability sampling approach. The stages of this study are as follows[1] :1. Prepare questionnaire as a research tool or instrument;2. The number of samples taken, which are relatively smaller than the total population, but were able to present the entire population for the three study locations as much as 168 samples;3. How to get the sample, in a way that is spread in the form of questionnaires at that time and the number of observations, which is given directly to the technical implementation of public transport users;4. Descriptive analysis;5. Testing the validity and reliability of the questionnaire using CFA (Confirmatory Factor Analysis), in order to measure the research variables are valid and reliable;6. SEM analysis using PLS.Data analysis using the program Partial Least Square (PLS) with the following steps[2] :1. Outer Test Model, including:a) Test the validity done by:1. Convergent validityValue convergent validity can be seen from the results of loading factors. The indicator is called valid if it has a value of> 0.5.2. Discriminant validityValue discriminant validity can be seen from the results of cross loadings. The indicator is called valid if the value of each indicator in measuring variables konstruknya predominantly higher compared to assess construct another variable.b) Reliability tests carried out by:1. Composite reliabilityConstruct a variable called reliable if it has a value of> 0.6.2. AVEConstruct a variable called reliable if it has a value of AVE> 0.5.2. Inner Test ModelThis test can be seen the results of that test the value of inner weight formulation of research hypotheses and goodness of fit model[3]. The model can be declared to have the goodness of fit if it has a value of R-Square> 0.
3. Results and Discussions
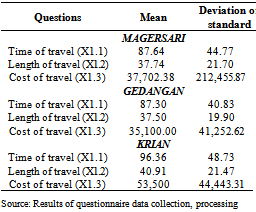
Originally DestinationsVariable origin destination (ATP) consists of three indicators, namely travel time (X1.1), length of trip (X1.2) and travel expenses (X1.3). Respondents' assessment of the indicator variable origin destination (ATP) completely presented in Table 1 below.Table 1. Description of Indicator Variables Origin Destinations (ATP)
 |
| |
|
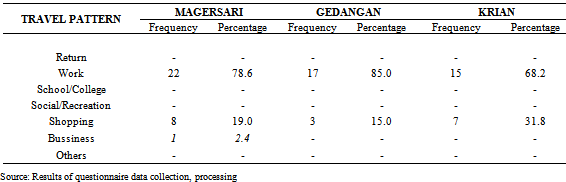
Average travel time, length of trip and travel expenses of the biggest Krian district, amounting to 96.36 minutes, 40.91 km and Rp 53,500, -. This shows that there is a trend among travel time, length of trip and travel expenses. That is, the longer the trip, the more long-distance and the greater the travel expenses incurred, and vice versa. So the description of the indicator variable origin destination (ATP) is a travel, length of travel and travel expenses.Pattern of Travel (PP)Variable travel pattern consists of 7 categories, namely home, work, school / college, social / recreation, shopping, business, and more. Distribution of respondents to complete travel patterns presented in Table 2 below.Table 2. Description of Variable Travel Pattern (PP)
 |
| |
|
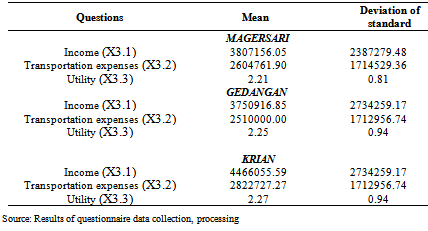
Based on the table above, it turns out most of the respondents have travel patterns to work that is equal to 78.6 percent for the district Magersari, 85 percent for sub Gedangan, and further to 68.2 percent Krian district. Next to shopping, respectively by 19.0 percent to Magersari, 15.0 percent and 31.8 percent for Gedangan to Krian.The willingness and ability to pay (KKM)Variable Willingness and ability to pay (KKM) consists of three indicators, namely income (X3.1), transportation expenses (X3.2) and utilities (X3.3). Indicators of the respondents assessment of the willingness and ability of variable pay (KKM) fully presented in Table 3 below.Table 3. Description of Indicator Variables willingness and ability to pay (KKM)
 |
| |
|
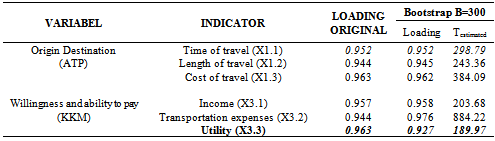
Table 4. Convergent Validity In the ATP, KKM and Sample Bootstrap (B = 300)
 |
| |
|
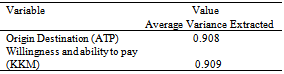
Average revenue (X3.1), transportation expenses (X3.2) and utilities (X3.3), the largest of the Krian district, amounting to Rp 4,466,055, Rp 2,822,727 and 2.27. This shows that there is a trend between income (X3.1), transportation expenses (X3.2) and utilities (X3.3). So the description of the indicator variable willingness and ability to pay (KKM) is income (X3.1), transportation expenses (X3.2) and utilities (X3.3).Validity and ReliabilityValidity test is intended to determine whether the questions in the questionnaire sufficiently representative[4]. Test validity is done by using confirmatory factor analysis on each of the latent variables namely the origin destination (ATP) and the willingness and ability to pay (KKM) through SmartPLS program.Convergent ValidityTesting the measurement model through loading factors conducted to determine the validity of the indicator by seeing the value of convergent validity indicators in the model. Each indicator in the model must meet the convergent validity namely have a value> 0.5.Discriminant ValidityDiscriminant validity test aimed at testing the validity of the block indicator[4]. Test of discriminant validity of the indicators can be seen in the cross loadings between indicators konstruknya. ST aims to establish that the variable has a value of discriminant construct validity was good. AVE value declared satisfactory if> 0.5. AVE test results appear in the table below.Table 5. Discriminant Validity In the ATP, KKM
 |
| |
|
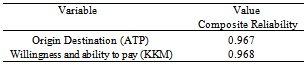
Reliability test aims to test the reliability of the variable constructs using composite reliability[5]. Composite reliability demonstrated satisfactory value if> 0.6. Results composite reliability values in Table 6. It shows that all the blocks of indicators that measure the construct of origin destination (ATP) and the willingness and ability to pay (KKM) has a value of composite reliability> 0.6. Composite reliability in this study is seen in the following table 6.Table 6. Composite Reliability in the ATP, KKM
 |
| |
|
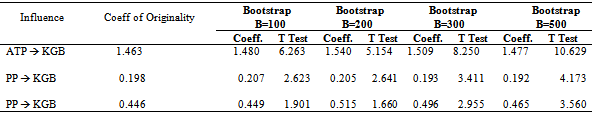
Structural Equation ModelStructural Test Model (inner weight) indicated by the results of the structural path coefficients[6]. Where the results of path coefficient formulas answer the hypothesis in this study include:H1: ATP significantly influence the KGBH2: PP significantly influence the KGBH3: KKB significant effect on KGBThe results of the structural path coefficients (inner weight) and their significance more value shown in the table below.Table 7. Test weight on the need for inner Guided Busway (KGB) with a bootstrap sample
 |
| |
|
After tested the validity and reliability of all latent variables that yield valid and reliable, and the testing of B = 500 bootstrap samples yielded significant results, then proceed with the analysis presented the following diagram: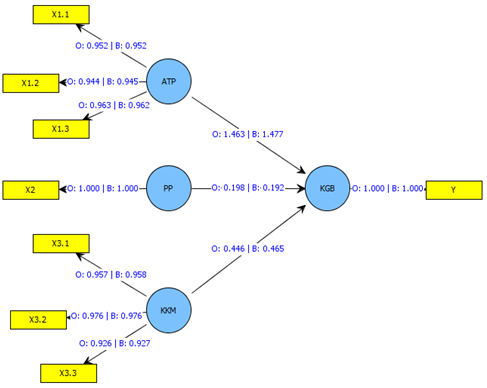 | Figure 1. Effect of ATP, PP and KKM to KGB |
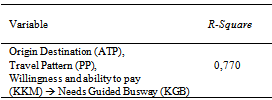
Test results on the complete model with SmarPLS program can be seen from the R-square value that describes the goodness-of-fit of a model. R-square value recommended is greater than zero. The results of this study with the data processing using Smart PLS give R-square values as shown in Table 8 below:Table 8. Goodness of Fit of R-Square
 |
| |
|
Table 8 explains that the contribution or the proportion of variable origin Destinations (ATP), Pattern Travel (PP), willingness and ability to pay (KKM) in explaining the variation around the variable needs Guided Busway (KGB) of 0.770 or 77.0 percentThe results of all the R-square values indicate that all the R-square value is greater than zero. This means that this research model meets the required Goodness of Fit.the model of fit, it can be interpreted in each path coefficient. The coefficients of these pathways is hypothesized in this study, which can be presented in the following structural equation: which,
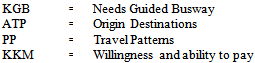 Testing path coefficients in Figure 1 and the above equation in detail presented in the following table:
Table 9. Results of testing path coefficient model needs guieded busway
 |
| |
|
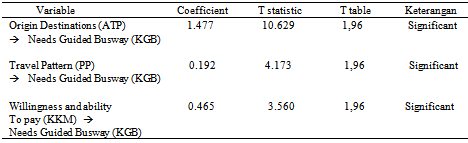
Table 9 shows that the inner weight between:1. Originally Destinations (ATP) have positive and significant impact on Needs Guided Busway (KGB). This can be seen from the path coefficient is positive amounted to 1.477 with a value of 10.629 T statistics greater than T-table = 1.96. Thus Originally Destinations (ATP) directly affect the need for Guided Busway (KGB) of 1.458, which means that whenever there is an increase of Origin Destinations (ATP) it will raise the need for Guided Busway (KGB) of 1.477.2. Pattern of Travel (PP) have positive and significant impact on Needs Guided Busway (KGB). This can be seen from the path coefficient is positive amounted to 0.192 with a value of 4.173 T statistics greater than T-table = 1.96. Thus Travel Pattern (PP) affects directly the needs Guided Busway (KGB) of 0.192, which means that whenever there is an increase Pattern Travel (PP) it will raise the need for Guided Busway (KGB) of 0.192.3. The willingness and ability to pay (KKM) have positive and significant impact on Needs Guided Busway (KGB). This can be seen from the path coefficient is positive amounted to 0.465 with a value of 3.560 T statistics greater than T-table = 1.96. Thus the willingness and ability to pay (KKM) directly affect the need for Guided Busway (KGB) of 0.465, which means that every increase in willingness and ability to pay (KKM) it will increase the need for Guided Busway (KGB) of 0.465.
4. Conclusions
Based on the analysis and discussion of some of the conclusions obtained are as follows:1. Originally Destinations (ATP), Pattern Travel (PP), willingness and ability to pay (KKM) have positive and significant impact on Needs Guided Busway (KGB) of 0.770 or 77.0 percent, and 27 percent described other variables that are not included in the model.2. Originally Destinations (ATP) is the dominant variable in affecting Needs Guided Busway (KGB), and the next is the willingness and ability to pay (KKM).3. Model Needs Guided Busway (KGB) is 
References
| [1] | Engel, K S.,Werner, C.,Moosbruger, H., Nonlinier Structural Modelling: is Partial Least Square an Alternative?’Goethe University, Frankfurt, 2009. |
| [2] | Chin, W.W, Marcolin, B.L dan Newsted, P.R, A Partial Least Squares Latent Variable Modeling Approach for Measuring Interraction Effects : Result from a Monte Carlo Simulation Study and Voice Mail Emotion/Adoption Study : Proceeding of the Seventeenth International Conference on Information System. 16-18 December, Cleveland, Ohio, 1996. |
| [3] | Hair, J.F. JR., Anderson, R.E, Tatham, R.L. & Black, W.C, Multivariate Data Analysis. Six Edition, New Jersey: Pearson Educational, Inc, 2006. |
| [4] | Johnson RA & Wichern DW, Applied Multivariate Statistical Analysis, Prentice Hall, Englewood Chiffs, New Jersey,1992. |
| [5] | Kline, R.B, Principle and Practice of Structural Equation Modeling.The Guilford Press, New York : London, 2005. |
| [6] | Lee, S,Y, Structural Equation Modeling A Bayesian Approach Department of Statistics, USA : John Wiley & Sons Inc, 2007. |
 Abstract
 Reference
 Full-Text PDF
 Full-text HTML