International Journal of Traffic and Transportation Engineering

p-ISSN: 2325-0062    e-ISSN: 2325-0070

2013;  2(2): 9-13

doi:10.5923/j.ijtte.20130202.01

Tire Inflation Pressure Influence on a Vehicle Stopping Distances

Vladimír Rievaj, Ján Vrábel, Anton Hudák

University of Zilina, Faculty of Operation and Economics of Transport and Communications, Univerzitna 1, 010 26 Zilina, Slovakia

Correspondence to: Ján Vrábel, University of Zilina, Faculty of Operation and Economics of Transport and Communications, Univerzitna 1, 010 26 Zilina, Slovakia.

Email:

Copyright © 2012 Scientific & Academic Publishing. All Rights Reserved.

Abstract

Health and ensure the safety of the road is now a priority in Europe. The authors deal with the adhesion problems of tires – ground contact under process of vehicle braking. The proper tire pressure is just part of many factors inflicting stopping distances of vehicle. The article describes the stopping distance dependence on tire pressure. It has been tested three probable options (e.g. overcrowding, under-inflation and adherence to the values specified by the manufacturer).

Keywords: Road Safety, Pressure, Stopping Distance

Cite this paper: Vladimír Rievaj, Ján Vrábel, Anton Hudák, Tire Inflation Pressure Influence on a Vehicle Stopping Distances, International Journal of Traffic and Transportation Engineering, Vol. 2 No. 2, 2013, pp. 9-13. doi: 10.5923/j.ijtte.20130202.01.

1. Introduction

Road traffic safety regulation require vehicle to be able to stop within visibility distance. The reaction pathway depends on the driver´s speed of reaction, concentration, experience and immediate mental and physical condition. The driver does not change direction or speed of a vehicle during the phase from noticing obstacle to the stopping of the vehicle. The stopping distance of a vehicle is determined by several factors which affect tire grip such as weather conditions (e.g. rain, fog, lighting conditions), geography (e.g. slope traverse plane), speed, quality and type of tire.[1],[2] The driver scope is influenced by density of transport flux, the driver's view of traffic flow (e.g. saddle, peak), topography and environment.
The driver is required to drive only at a speed to be able stop before an obstacle is suddenly revealed ahead. The distance travelled by the vehicle from the moment of the obstacle appearing to the vehicle standstill is called trajectory required to stop a vehicle. It is influenced by the driver's ability to respond to the technical and structural status of the braking system, driver´s speed and tire design. This distance can be calculated using the following formula:
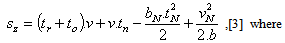
(1)
tr - driver response time[s] – the period between the driver noticing and touching on the service brake pedal,
to - delay time of brakes[s] – for vehicles with hydraulic brakes application takes the value of 0.05 s,
tN - increased time of braking deceleration[s] – for vehicles with hydraulic brakes application takes the value of 0.15s,
v - initial speed of the vehicle[m.s-1],
vN - vehicle speed is reduced due to the onset of braking deceleration[m.s-1],
bN - braking deceleration of the vehicle during braking increasing. Because of increases from 0 to full value can be determined as a half of the full average braking deceleration[m.s-2],
b - full average braking deceleration[m.s-2].
This equation describes the stopping distance, consisting of sections since the point of driver reaction time (appears obstacle) to the time to stop the vehicle. Stopping distance consists of the following phases.
1. phase - reactions driver tR,
2. phase - delay braking performance tO,
3. phase - attack braking, half braking deceleration,
4. phase - full braking effect, fully developed deceleration.
Distance required to stop vehicles is influenced by:
driver - physical and mental condition, age, level of training and experience affect the length of the reaction time of the driver and as well distance covered by vehicle without direction and speed of movement correction. This practice in turn affects response suitability. A quick but incorrect response is worse than the slow but correct response,
vehicle - technical condition (condition of brake fluid, brake lining and pads etc.), design of the suspension and brake system (drum bakes or disc brakes, ABS, Brake Assistant, technical condition of suspension, shock absorbers, etc..) Specifications, Technical Condition and used Tires design.[4],
road – the kind of surface (asphalt, concrete panels, natural terrain) road surface condition (dry, wet, icy or snowy surface, flat bumpy or wavy surface) etc.[5]
Tires are basic conditions affecting the braking of the vehicle. These are in fact the only part that connect the vehicle with the ground. The ability to transmit force to the tire base determines how big the vehicle deceleration is achieved. Size of load depends not only on the type and construction of the tire and the wear speed, but also varies according to the inflation pressure. Each of the previously listed properties significantly affect the distance of track to stop the vehicle and thus drive safety. Tire pressure is a parameter that 2/3 of drivers do not reach. Therefore, the aim of this paper is to show the influence of tire pressure on the stopping distance of the vehicle. This will directly affect whether the driver stopped in front of an obstacle or it encounters a residual rate.[6],[7]
Exclude the influence of the human factor, the measurement of the stopping distance consisting of Phase 2, 3 and 4 is performed on the same surface in order to ensure measurements comparability.
Many drivers used improperly inflated tires because they do not know the values required inflation pressure in the tires and at the same time do not realize the effects on consumption and drive-ability of the vehicle

2. Tire Pressure

Optimal value for a specific inflation pressure prescribed by the vehicle manufacturer to achieve the best performance of the vehicle, limiting the transmission of road surface irregularities on the vehicle, and of course to achieve the shortest stopping distance.[8]
It has been perform comparative measurements at an initial speed of 50 km.h-1 to demonstrate the influence of pressure inflation on a braking distance of the vehicle. This speed has been determined based on the fact that most countries have set the speed limit in urban areas at 50 km.h-1. The reason is high traffic volume and always increasing number of mobility vulnerable road users (e.g. pedestrians, cyclists, drivers) in the village. Increased probability of collision is also caused by building-up areas as driver´s view is restricted.
To eliminate random effects, the measurements are being repeating five times with the same initial speed for each tire pressure. Stopping distance measurements were performed at the airport in the village of Rosina. The passenger car used was a Citroen C6.[9]

2.1. Measurement Conditions

Ø Used vehicle: Citroën C6
Ø Road surface: dry asphalt
Ø Ambient temperature: 21°C
Ø Weather: cloudy, no wind, no rain
Ø Initial velocity: V0 = 50 km.h-1
Ø Final velocity: V1 = 0 km.h-1
Ø Deceleration:full average braking deceleration
Ø Used tires:MICHELIN Primacy 245/45 R 18
Ø Tires were heated by driving to operating temperature
of 60°C. This was measured with a special thermometer.
Ø Inflation pressure:
a) Saturation pressure 0.29 MPa (+20.83 %).
b) The tire inflation pressure reached Alpha
according the manufacturer specification 0.24 MPa.
c) The tire inflation pressure underinflated 0.19 MPa (-20.83 %).
Ø Measurement device: XL meter
a) Sampling frequency XL meter was set to 200 Hz, the accuracy of the device is ± 0.1 m.s-2[10].
b) Number of measurements: 15 measurements (5 for each inflation pressure)
During the measurement, the vehicle and its part (e.g. tires) were not exposed to direct sunlight.

2.2. Measuring Device

To measure the impact of tire inflation pressure for the transfer of longitudinal tangential forces between the tire and the substrate and recording the measured values, XL meter facility was used. This is capable of recording the following parameters:[11],[12]
Ø Interval measurement[s]
Ø Longitudinal acceleration[m.s-2]
Ø Lateral acceleration[m.s-2]
To eliminate random effects, the measurements are being repeating five times with the same initial speed for each tire pressure. Stopping distance measurements were performed at the airport in the village of Rosina. The passenger car used was a Citroen C6.
There were measurements focused on further parameters:
Ø Total stopping distance[m].
Ø The initial speed of the vehicle before deceleration [km.h-1].
Ø Braking time[s].
Ø Full average braking deceleration[m.s-2].

3. Experiment

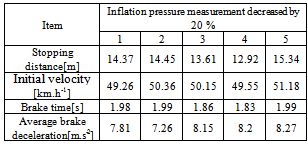
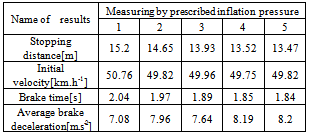
The main intention was to run up the vehicle at a velocity of 50km.h-1 for any measurement. After reaching the interrupted transmission of torque from the engine to the wheels, the driver began work on the service brake control. Actuating force was set so as to activate the anti-lock braking system ABS.
At the beginning of the measurements were tires inflated with pressure of 0.29 MPa, while the prescribed ideal inflation pressure is 0.24 MPa. Therefore the inflation pressure is 20% higher than recommended by a car producer. The inflation pressure was decreased in all tires to a level of 0.24 MPa after all the tests had been run. Then another series of measurements were done with the given inflation pressure. Another 5 measurements were executed. These 5 measurements were performed when the inflation pressure had been decreased to the level of 0.19 MPa. The changes in inflation pressure were done in the same conditions. There were no changes in ambient pressure or its temperature during the time of measurements. The tire inflation pressure was measured and tested before every single brake test.

3.1. Test Performance

Table 1. Recorded values achieved at measurements in inflation pressure decreased by 20 % in contrast to value prescribed by car producer
     
The graph of vehicle acceleration in known inflation conditions is displayed in Figure n. 1. The use of ABS can be derived and seen from this progress. There is obvious use of exploitation of ABS on the figure 1.
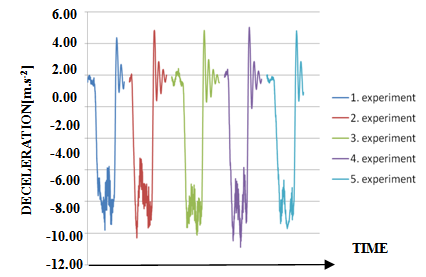
Figure 1. The progress of acceleration of particular measurements with inflation pressure decreased by 20 %
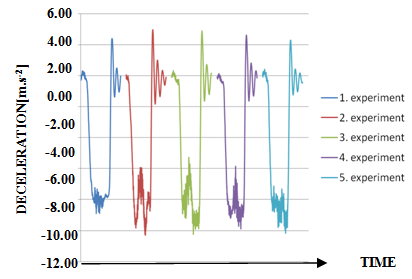
Figure 2. The course of particular acceleration measurements when using tire pressure prescribed by car producer
The braking deceleration of vehicle is an essential indicator of ability to stop. The braking distance measured in metres is much more important indicator. Figure n. 4 shows the changes in braking distance in accordance to tire pressure.
Comparison of results shows that the vehicle had the longest stopping distance when the tires were inflated to 20% higher pressure than indicated by the vehicle manufacturer.
Table 2. Recorded values by prescribed tire pressure
     
Table 3. Recorded values achieved at measurements in tire pressure increased by 20 % in contrast to value prescribed by car producer
     
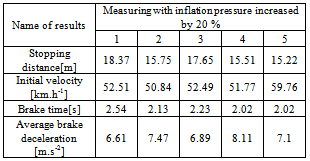
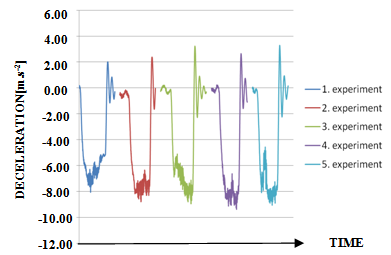
Figure 3. The acceleration vehicle curve – tire pressure increased by 20 %
The vehicle had the shortest braking distance when the tires have been inflated 20% less than the prescribed pressure. The vehicle was losing its stability when braking at slow velocity and even on flat surface.
The differences arising between the braking distance can be explained through 3 factors of interaction between tire and surface that participate in the transfer of forces. The size of contact surface changes according to the inflation pressure. The decrease in the pressure inflated leads to an increase of contact surface.
The first factor represents friction. It reaches 80-85% of all transferred forces. Its magnitude depends on the force pushing tire to the base, then on mutual distance of surfaces and their cleanness. The size of surface has no impact on the magnitude of friction.
The second factor is hysteresis. It builds up 10-15% of the total transferred force between the surface and tire. This is a result of a rough road surface. It is rugged and full of nodes pressed into the rubber tread. It occurs when the friction force has been overcome and tires begin to glide along the surface. On the leading side of the surface nodes is generating pressure which causes special receding effect between the tread and ground. Rubber of tread contracts because of mentioned pressure. However, rubber has a tendency to return to its original position. It is happens in the leading part of nodes where creates certain pressure.
The hysteresion intensity creates a differential pressure on the leading and trailing side of inequality. Its magnitude is dependent on the attributes of rubber. Moreover the magnitude of hysteresis´ forces also hinges on roughness of surfaces and size of contact surface between tire and ground.
The third factor represents abrasion. This particular factor builds up 5 – 10 % of all the transferred forces between tire and base. It is formed as a result of work needed to pull out the particles from tread´s rubber. It is considered unnecessary from the point of used tires. Its magnitude is directly proportional to the rubber cohesiveness and size of contact surface.[13]

4. Conclusions

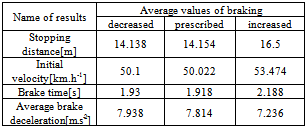
From the results shown in Table 4, it would seem that driving on underinflated tires is beneficial in terms of stopping distance.
The changes in the size of contact surface of tire with base influences the factor of hysteresis and abrasion of tread´s rubber.
This is claimed to be a reason why under-inflated tire transfers greater brake forces and allows shorter stopping distance.
Table 4. Average values of braking tables 1,2,3
     
The tire pressure has an impact on transverse rigidity of tire, which is showed in deflection of tire´s direction. Tire carcass with lower inflation to the producer’s recommendation is more flexible in case of side force acting. This fact transfers into a greater carcass deformation (parameter e). It also causes a larger deviation of wheel centre (angle α) to the original direction of movement, see figure 5. The vehicle´s handling and stability worsens when the tires are under-inflated. The tire pressure has impact on the vehicle driving characteristic. It can be changed from neutral to the understeer or oversteer.[14]
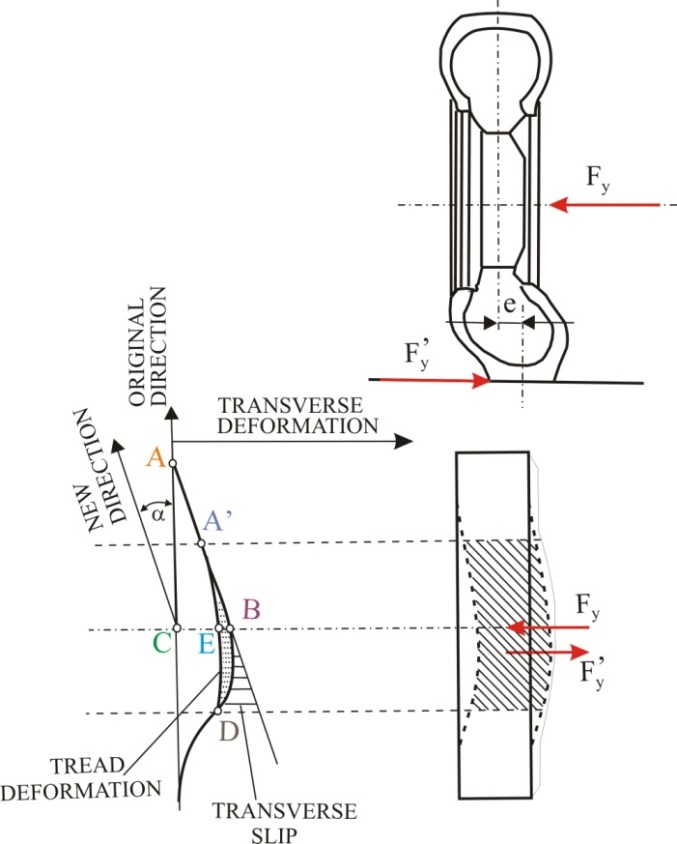
Figure 5. Effect of lateral force on the transverse deformation of the tire Modified from[14]
AA’ is carcass circuit line deformation,
AA’ED is curve of the maximal carcass deformation,
AA’BD is curve of the maximal deformation of the carcass and tread rubber,
EB is deformation of the tread rubber,
AA’B is wheel movement direction,
α is wheel deviation,
e is distance between centreplane of the rim and centreplane of the wheel contact with the ground,
C is wheel geometric center,
Fy is side force.
It is worth mentioning that tread of under-inflated tire has a reduced cross-section of tread pattern, which impairs water drainage. This reduction is due to the greater deformation of the tread and sides of the tire than it was expected by the tire manufacturer, see figure 6. Higher deformation causes that the tread grooves area important for water outlet from the contact are narrower. When thickness of water layer is 1 mm, tire with width of the contact area 200 mm and the vehicle at a speed of 90 km / h, the tire must push out 5 litters of water. Tread grooves are important for this purpose.[15]
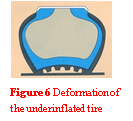
Figure 6. Deformation of the underinflated tire
Such a tire then transfers tangentially peripheral and direction forces on wet surface significantly worse than tire ideally inflated.
Poorly inflated tires worse reacts to the action of lateral forces, resulting in a significantly worse driving and also has the wet braking distance than in the case of a dry surface. The results of measuring the stopping distance and braking adverse effects the drive-ability of the vehicle clearly show that in terms of safety is the manufacturer specified tire inflation optimum.
This contribution/publication is the result of the project implementation:
Centre of excellence for systems and services of intelligent transport II.,
ITMS 26220120050 supported by the Research & Development Operational Programme funded by the ERDF.

References

[1]  GARRETT, T. K., NEWTON, K., STEEDS, W., The Motor Vehicle, Oxford 2001, Reed Educational and Professional Publishing Ltd., ISBN – 07506 4449 4
[2]  Rievaj, V., Hudák, A., „The Road transport and safety”. In: CONAT 2010: 11-th International congress on automotive and transport engineering: Brasov, Romania, October 27-29, 2010, ISBN 2069-0428. S.187-192.
[3]  BAKKER, E., PACEJKA, H.B., and LINDER, L., „A New Tire Model with an Application in Vehicle Dynamics Studies. SAE Paper No. 890087.
[4]  Liščák, Š., Hudák, A., Holeša, L., „Technical Support in a Field of Passive Safety“. In: The Problems of Road Transport Safety . 8-th Interational Technical Conference, Kielce, 2012, Politechnika Świetokrzyska, ISBN 978-83-88906-19-0. S. 197-204.
[5]  VRÁBEL, J., RIEVAJ, V., “The tire unit costs in the transport company” In: TRANSCOM 2011: 9-th European conference of young research and scientific workers: Zilina, June 27-29, 2011, Slovak Republic. ISBN 978-80-554-0369-4. - S. 225-228.
[6]  HOCKICKO, P.,ONDRUŠ, J., ”Analysis of vehicle stopping distances”. In: New trends in physics: NTF 2012: proceedings of the conference, October 11 – 12, 2012, Brno, Czech republic.- ISBN 978-80-214-4594-9. - S. 214-217
[7]  Tire Pressure Maintenance: a Statistical Investigation, In: Tire Technology International, by the National Highway Traffic Safety Administration, USA, 3/2009, ISSN 1462 – 4729, s. 14-20
[8]  Rievaj, V., Vrábel J., „Vplyv hustenia pneumatík na brzdnú dráhu vozidla[Influence of tires on the vehicle stopping distance]”. In: CMDTUR 2012: 6-th International scientific research conference: Zilina, April 19-20, 2012, Slovak Republic. ISBN 978-80-554-0512-4.- S. 67-71.
[9]  Kovalčík, A., Krakovský, J., Barta, D., Kendra, M., „Road Surface Impact on the Braking“. In: 7-th International Conference TRANS-MECH-ART-CHEM, MIIT – Moscow, July 2010, ISBN 978-5-7876-0129-9. S. 159-161.
[10]  Labuda, R., Barta, D., Kovalčík, A., „Effective use of the braking effect of vehicle drivetrain at deceleration“. In: 16-th International conference of czech and slovak university departments and institutions dealingwith the research of internal combustion engines 2010, ISBN 978-80-7372-632-4.
[11]  ŠARKAN, B., “Options of data using from the self-diagnostics system” In: TRANSCOM 2011: 9-th European conference of young research and scientific workers: Zilina, June 27-29, 2011, Slovak Republic. ISBN 978-80-554-0369-4. - S. 211-214.
[12]  Šarkan, B., Riadiaca jednotka ako zdroj informácií o technickom stave motorového vozidla[Control unit as a source of information about technical condition of motor vehicle]. In: Technická diagnostika stroju a výrobních zařízení DIAGO 2010. 29. Medzinárodná vědecká konference: 2.-3.2.2010 Hotel Relax, Rožnov pod Radhoštěm. VŠB-TU. S 254-257.
[13]  Rievaj, V., Faith, P., Dávid, A., „Measurement by a cylinder test stand and tyre rolling resistance. In: TRANSPORT: Vilnius Gediminas Technical University. ISSN 1648-4142. Fol. 21, No. 1 (2006), S. 25-28
[14]  Marcín, J., Zítek, P., Pneumatiky, Praha, STNL, 1985
[15]  Jaśkiewicz, M., Liščák, Š., Ludwinek, K., Systems for measuring physical quantities during an inertial collision of a trolley with an obstancle”. In: Problems of maintenance of sustainable technological systems: monographs of the maintenance systems unit. – Kielce: University of Technology, ISBN 987-83-88906-69-5. S. 60-73.