Maria Nadia Postorino1, Mario Versaci2
1Department of Computer Science, Mathematics, Electronics and Transports, Mediterranea University of Reggio Calabria, Reggio Calabria 89122, Italy
2Department of Mechanical Engineering and Materials, Mediterranea University of Reggio Calabria, Reggio Calabria 89122, Italy
Correspondence to: Maria Nadia Postorino, Department of Computer Science, Mathematics, Electronics and Transports, Mediterranea University of Reggio Calabria, Reggio Calabria 89122, Italy.
| Email: |  |
Copyright © 2012 Scientific & Academic Publishing. All Rights Reserved.
Abstract
In this paper a fuzzy approach is proposed to reduce delay at isolated intersections by using as indicator the intersection saturation degree. The proposed system combines fixed-duration cycle and fuzzy calculus to reduce the overall delay without giving too much penalty to some traffic streams. To obtain the intended goal, the green times are modified according to the measured traffic flow values and by using a fuzzy procedure. Measured traffic flows are considered as fuzzy quantities because of their uncertainty and/or imprecision. A test example is analysed to show the benefits of the fuzzy controlled intersection with respect to a crispy controlled one. The results show that the use of the fuzzy procedure reduces the total and average delay at the intersection by modifying the phase duration according to sampled traffic flows.
Keywords:
Fuzzy Calculus, Intersections, Traffic Light Control, Traffic Delay, Crisp Vs. Fuzzy, ITS
Cite this paper:
Maria Nadia Postorino, Mario Versaci, "A Fuzzy Approach to Reduce Delays at Signalized Road Intersections", International Journal of Traffic and Transportation Engineering, Vol. 1 No. 4, 2012, pp. 52-59. doi: 10.5923/j.ijtte.20120104.01.
1. Introduction
Nowadays, many modern cities suffer from congestion problems due to the high percentage of vehicle use mainly for commuting trips. According to some studies (Dargay, 2001; Banister, 2008; Stanley et al., 2011) the tendency to vehicle use will not decrease in the next future. In road networks - often represented by using a graph approach (Dubois et al, 1979) - drivers select paths - made by a sequence of roads and intersections – so as to arrive from a departure location to an arrival location. Both roads and intersections can handle a maximum (generally different) number of vehicles in the reference time period. Very briefly, when the number of vehicles (traffic flow) in the reference time period is greater than the maximum allowed, then the travel time increases and congestion arises (Yang and Yagar, 1995; Carey and Ge, 2003). Traffic congestion is a critical problem as it means lost time, lost worker productivity, missed opportunities, delivery delays and increased costs among the more relevant. From a wider perspective, congestion also means poor life quality, environmental problems (as atmospheric pollution) and unsustainable mobility.There is evidence that the expansion of road infrastructures not only does not solve the congestion problems, but paradoxically makes them worse.An alternative solution is the management of the exiting transportation systems so as to improve mobility while keeping safe and flowing traffic conditions that ultimately can lead to reduce the use of vehicles or at least avoid critical congestion conditions. Some useful actions to achieve that goal are the enhancement of the public transport, the implementation of route guidance systems and the improvement of traffic signals.Here the focus is on traffic signals, particularly the management of traffic lights so as to reduce congestion and then delay, but also environmental impacts, at the intersections. Traffic lights regulate an intersection so as to avoid potential conflicts among vehicles and assure safer traffic conditions. However, traffic signals generate delay as drivers idle, accelerate and decelerate near the intersection depending on the light. Delays at the intersection generates queues, particularly when it tends to increase greatly due to the high number of incoming vehicles. The queue length is an indicator of the traffic lights efficiency and a rough measure of the environmental impacts, as the greater the queue length the greater the decelerate-idle-accelerate manoeuvres and during these stages the vehicle emission rates are higher compared to a condition of flowing vehicle motion (Pandian et al., 2009). There are several studies in the literature discussing the relationship among vehicular emissions and traffic lights characteristics, mainly in terms of delay management (Hunt et al. 1982; Hallmark et al. 2000; Unal et al., 2003; Li et al. 2004a). Some authors studied how to optimise traffic signals to reduce delay and queue length by using fuzzy control (Niittymaki 2001), gray theory-based methods (Li et al., 2004b), control expert systems (Wen, 2008), neuro-cognitive approaches (Chong et al. 2009).Here a fuzzy approach is adopted to reduce delay by using as indicator the saturation degree at an isolated intersection. The starting point of the proposed approach is the use of measured traffic flows at a prefixed distance from the intersection to modify the phase length so as to reduce delay. Measured traffic flows are considered fuzzy quantities because of their uncertainty and/or imprecision. In other words, the real flow passing through the intersection could be different from the measured one at the detection point (e.g., because of a stop or a slowdown). Furthermore, the fuzzy sets representing traffic flows partially overlap and become as narrower as the flow values increase. It is worthwhile to note that by modifying the phase length some vehicles can take advantages and some others disadvantages. The proposed system combines fixed-duration cycle and fuzzy calculus to reduce the overall delay without giving too much penalty to some traffic streams. The proposed solution can be identified as an Intelligent Transport System (ITS), as it employs information and communication technologies and integrate them to obtain a more efficient transport service and reduce transport negative impacts. The remainder of this paper is organized as follows. Section 2 defines the problem and identifies the relevant variables that can simulate an intersection. Section 3 shows a brief overview of fuzzy logic essential mathematics. In Sections 4 and 5 the proposed approach and an evaluation example are described respectively. Finally, some conclusions are drawn in section 6.
2. Definitions and Intersection Modeling
Traffic lights control the road traffic by means of different coloured lights telling drivers to go slower, stop or go ahead. An intersection with traffic lights is defined signalized intersection. An intersection is also characterized by some main factors such as: a) converging/diverging road lanes, their width and slope; b) parking slots or bus stops near to it; c) pedestrian crossings.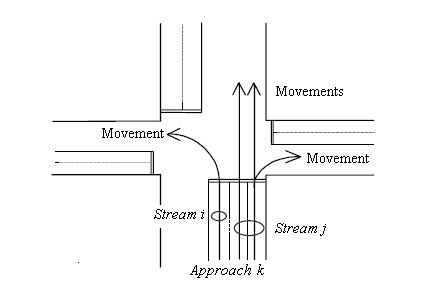 | Figure 1. A typical urban intersection |
For a given intersection, the approach k is defined as the set of lanes belonging to the same road and converging at the intersection that receive the same signal during the reference time period T (Figure 1). Drivers coming from the same approach that cross the intersection and have a common exit represent a movement. Two movements are compatible if they do not cross at any point and do not converge, otherwise they are incompatible. One of the most important roles of a signalized intersection is to control the approaches in order to avoid incompatible movements, or conflicts, that exist because an intersection is an area shared among multiple traffic streams. A traffic stream - or simply stream - is a set of movements crossing an approach that are always given right-of-way simultaneously. Within a stream, the several movements cannot be distinguished.For an approach k, during the reference time period T the red, green and amber light signals alternate and control the movements such as:- during the red light time (rk) the vehicles cannot cross the intersection;- during the green light time (gk) the vehicles can cross the intersection;- during the amber light time (ak) the vehicles are alerted that the red signal is coming.The sum of red, green and amber light times represents the cycle time C: C = rk + gk + ak.For a given intersection, specified combinations of movements receive right-of-way simultaneously. A phase is the portion of the cycle time that is allocated to one of these sets of movements. Then, each phase j represents a distinct time period within the cycle during which the signals remain unchanged for some approaches. If Vj is the time slice of phase j, then: For a given stream of the approach k, the incoming flow (qk) is the number of vehicles (cars, buses, motorcycles) arriving at the approach k during the reference time period T. The maximum flow of the approach k , sk, is defined as the maximum number of vehicles that can cross the intersection during the reference time period under the hypotheses of: i) unoccupied intersection; ii) green signal; iii) continuous queue. Let Nv be the number of vehicles that, under the previous hypotheses, cross the intersection during the green and amber time intervals.It can be useful to refer to the “effective green”, gek, and the “effective red”, rek, rather than the actual green gk and red rk, ([15]). They are defined such as: during gek the incoming flow qk is constant and equal to sk.; during rek any vehicle leaves the intersection. They are computed as:gek = Nv / skrek = C- gekFor the approach k of a signalized intersection, the delay tdelay,k can be computed as ([15]):
 | (1) |
Eq. (1) is not defined when qk C = sk gek, but generally for qk C ≥ sk gek the expression is modified by using the Doherty formula: | (1) |
The total and average delay for the intersection i are respectively: 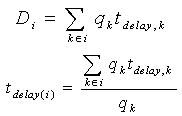 Finally, at a first attempt the performances of a given intersection can be measured by the saturation degree of its own approaches, xk, such as:
 | (2) |
The condition to be verified so as to guarantee an acceptable delay is xk <1 (under-saturation condition). In fact, in this case qk C < sk gek , in other words the number of vehicles that cross the intersection during the cycle time in a reference time period T is less than the maximum allowed during the green effective time length in the same reference time unit. Generally, the travel time depends on the traffic flows moving along the roads. Particularly, travel time increases as traffic flow increases according to a non linear function and as fast as the traffic flow approaches the road capacity. Similarly, for a given cycle time and phase duration the delay at the intersection increases as traffic flow increases (see eq. (1) and its representation in Figure 2). Then, condition (2) rapidly approaches 1 if traffic flows come near to road/intersection capacities.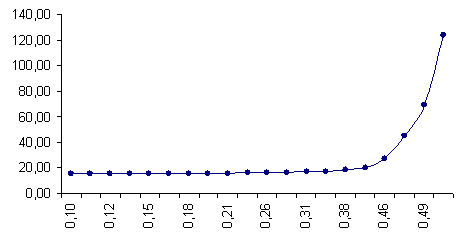 | Figure 2. Link travel time/link traffic flow relationship for congested transport networks A typical urban intersection (sk=1, C=120 sec, gek = 60 sec) |
Note that some other indicators could be used to measure the intersection performances, mainly delay indicators (e.g., total delay or delay per peak traveller), but most of them in any case require the under-saturation condition. Furthermore, there is a relationship between the (finite) capacity of the intersection and the delay (measured for example as user’s delay, average delay), particularly the delay increases quickly as the factor qkC approaches sk gek. Then, xk values less than 1, particularly largely less than 1, also mean a reduced delay. Fixed-phase traffic lights are the most common systems used in many towns. Here the duration of each phase and the overall cycle length are constant in the reference time period. During the rush hours the incoming flow can be very high for some approaches, the relationship qk C < sk gek is no more verified and the overall delay at the intersection increases dramatically. To avoid such situations, an opportunity is to make adjustments in real time to the signal timing in order to minimize delay. To this aim, devices are required to detect vehicles approaching the intersection as well as advanced controllers to suitably modify the phase length.Such actuated control can also be defined “demand-responsive” as phase durations are set on the basis of traffic flows (demand) registered by detectors. Generally this kind of control is obtained by extending the length of the green interval for a particular phase when the number of approaching vehicles can lead to a xk value close to 1.In the next sections, a fuzzy approach is described to reduce the delay for a single intersection, i.e. an intersection that can be considered far enough from other ones and then will have the most appropriate signal timings just for it.
3. Fuzzy Number Approach: An Overview
The main reasons for treating a problem by means of fuzzy logic can be resumed as follows([16,17]):1) the available information about the problem is imprecise and insufficient;2) the tolerance for imprecision can be exploited to enhance tractability, robustness and low cost solution of the problem.Far from setting severe limitations to the application field of fuzzy logic approaches, these statements explain why such techniques are useful for solving real world problems in which: 1) data are affected by various sources of inaccuracies and uncertainties, non-linearity, structural lack of data; 2) solutions are based on subjective expert knowledge; 3) interpretation and accurate solutions are often too expensive for coping either with real time application, computational requirements or budgetary constraints. The following describes the main steps of the fuzzy procedure. A fuzzy set A on a set universal X is defined by membership functions such that  . The support of A, supp(A), is the closure of the set
  and for each
  the
the  of A is defined by
  ([19]). A Fuzzy Number (FN) represented by
  - where m, n, r, t are left point, right point, left spread, right spread respectively - is a normalized convex fuzzy subset on the real line
  if:- Supp(A) is a closed and bounded interval;-
  is an upper semi-continuous function;-
 ;- the membership function has the following form:-
  where f(x) and g(x) are the monotonic increasing and decreasing functions respectively. Specifically, an LR-type fuzzy number (LR – Left and Right) is obtained from FN if the shape functions f(x) and g(x) are approximated respectively by:
 Particularly, A is trapezoidal in shape if m of A is an interval number denoted by
  which is explicitly shown for an LR-type fuzzy number
 for all α∈[0, 1]. Arithmetic operations in the FN domain are defined as follows([18]):(i)Addition:
  ;(ii)Subtraction:
  ;(iii)Multiplication:
 ;(iv)Division:
 .
.
4. The Proposed Fuzzy Procedure
To obtain the intended goal (i.e. reduce the delay for a single intersection), the green times are modified according to the traffic flow values and by using a fuzzy procedure. Briefly, the traffic flows q1, q2, …, qk …, qn sampled for each approach k are transformed in fuzzy sets partially overlapping. Then, starting from the current green times gE the saturation degree (2) is computed. If the under-saturation condition is verified the current green times remain unchanged, otherwise the new values gEk are obtained by imposing xk <1 and verifying the corresponding delay. This kind of procedure is intended to increase the difference between the travel time that would have occurred in the absence of the intersection control and the travel time that results because of the intersection control.The system works in real time but the new values gEk are applied by checking the phase compatibility. In other words, given two approaches k and l with opposite signal timings and a new green value gEk, if the current signal for the approach k is green or yellow the new green is applied immediately. If the current signal for the approach l is yellow the new green gEk is applied to the approach k at the end of the approach l yellow phase. As tested, this does not significantly affect the performances of the proposed procedure. Moreover, the traffic flows q1, q2, …, qk …, qn are recorded at prefixed time intervals. If the values recorded at the time t differ from those recorded at the time t-1 less than a pre-fixed ε, the current gEk values remain unchanged. The value ε can be as small as desired.More in details, the proposed procedure can be described by six main steps:1)traffic flow sampling;2)data pre-processing;3)data fuzzification;4)initialization of gEk for each approach;5)under-saturation condition testing;6)update of gEk for each approach.STEP 1: Traffic flow samplingThe sampled traffic flows q1, q2, …, qk …, qn are obtained by using traffic flow detectors located at a suitable distance from the intersection. The values q1, q2, …, qk …, qn are considered as fuzzy numbers and the reading will be associated to a “confidence” interval that measures our trust about the number. In this framework, the emergence of multiple solutions, related to non-uniqueness, can be treated in a natural way.STEP 2: Data pre-processing1. LabellingFor a given phase, the approaches having the same signal have been combined and labelled with a common code. The same code has been associated to the corresponding traffic flows. For single (not associated) phases, the code is unique – for both the approach and its traffic flow.2. Traffic flow combinationA single traffic flow value is associated to the combined approaches. That value is equal to the maximum one among the detected traffic flows belonging to combined approaches. In fact, if one approach is well optimized in the worst condition (maximum values), the approaches in less critical conditions will operate still better. The traffic flows associated to the combined approaches are identified as q’1, q’2, …, q’k …, q’n..STEP 3: Data fuzzificationThe traffic flow q’k is not perfectly known – it is measured at a fixed distance from the intersection, not when passing through – and is treated as a fuzzy quantity. Then, such values have to be transformed in fuzzy numbers. It is worthwhile to note that each approach k is characterized by its maximum flow sk. It is possible to identify the values q’k as a function of sk and, similarly, the range R = q’k,max - q’k,min can be considered as a function of sk. Note that here the values q’k, max and q’k, min refer to the maximum and minimum values recorded for the combined approaches. Finally, as the traffic flows q1, q2, …, qk …, qn are recorded at prefixed time intervals, the following condition is verified for two subsequent records:  If this inequality is verified, there is no need to update the green values gEk.
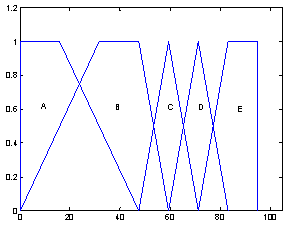 | Figure 3. Fuzzification of the associated traffic flows q’k |
By assuming:  , then the fuzzy sets for each approach k can be defined as:
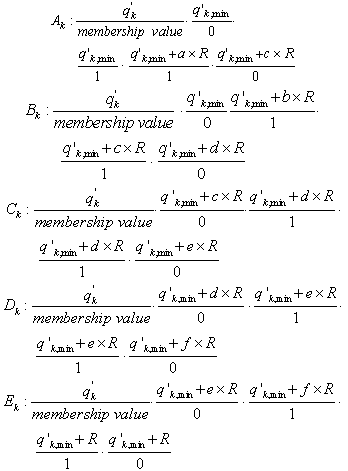 where a, b, c, d, e, f are suitable parameters that characterize the overlapping of the range of the possible values (Figure 3). Each fuzzy quantity is associated to a fuzzy membership function μZ, Z being a generic fuzzy number. When a traffic flow is sampled, all the values of μZ (q’k) are computed. The fuzzy number Z whose membership value is
  represents q’k in the following steps. Furthermore, it is centred on the crisp value q’k and its support is equal to that of Z - then both the right and left spreads generally are asymmetric (fuzzy sets “modified”).STEP 4: Initialization of gEk f for each approachThe initial values for the green times gE1, gE2, …, gEk …, gEn are set. Note that the green times are equal for associated flows.STEP 5: Under-saturation condition testingFor each approach, the saturation degree is computed as:
 with:
with: Here the membership functions are triangular-trapezoidal shaped, so only cuts of levels 0 and 1 need([18]). Then, the maximum value of the saturation degree among all the computed values is considered:
 In fact, if the condition
 | (3) |
is verified, it is still verified for all the other approaches. In the previous inequality, both numbers are fuzzy. If the condition (3) is verified, then the green times set at Step 4 remain unchanged. On the contrary, starting from condition (3) they are updated so that: STEP 6: Update of gEk for each approach and defuzzificationThe value gEk for each approach is updated by using the criteria of the saturation degree. Particularly, a xk value less than 1 is set to guarantee under saturation conditions and the new value gEk is computed by:
 | (4) |
Finally, the delay is computed for each approach k by using eq. (1), here reported for clarity: Two delay values are computed by using eq. (1): the fixed and activated delay. The fixed delay, tf-delay,k, is obtained by eq. (1) with pre-fixed gEk, i.e. without any traffic lights control. On the contrary, the activated delay, ta-delay,k, is that obtained still by eq. (1) but with gEk obtained by eq. (4):
 If the following condition occurs: ta-delay,k < tf-delay,k, then the values gEk remain unchanged.At this point, the new values gEk have been obtained and the procedure repeats from Step 1 with these new values. The iteration ends with defuzzification calculus, in other words each fuzzy output is defuzzified by computing its centre of gravity (Guldino-Pappo formula).
5. Evaluation Example
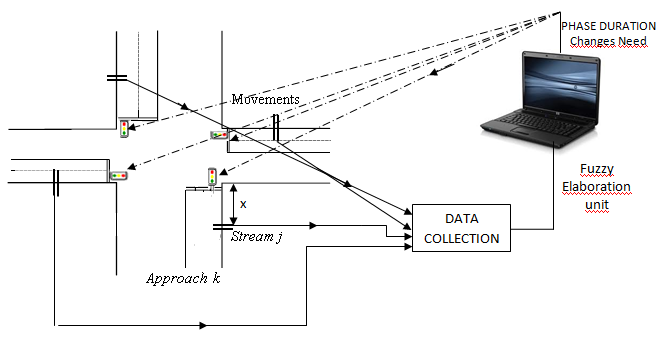 | Figure 4. Test example: intersection type, flow detection, computation, control |
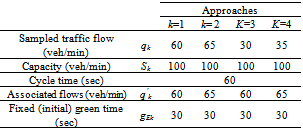
An evaluation example is here considered to test the proposed procedure. The intersection is a typical, simple one (Figure 4) with four one-way approaches (associated approaches 1-3 and 2-4) and without turnings. The approaches have the same capacity, the cycle time is 60 sec and the effective green is 30 sec for each approach. Table 1 describes the input parameters. Table 1. Input parameters
 |
| |
|
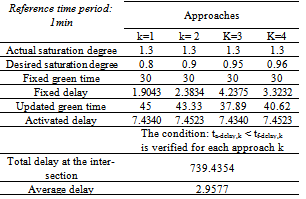
First of all, the crisp procedure has been used. To clarify, each crisp number is a single point while each fuzzy number is a fuzzy set with different degree of closeness to a given crisp number. In other words, the green times have been modified according to the main steps described in section 4, but without data fuzzification (step 3). The results are summarized in table 2. Starting from the data in table 1, the actual saturation degree with pre-fixed gEk is 1.3. According to steps 5 and 6 (without fuzzification) the updated gEk values should be computed by assuming under-saturation conditions. Four different values have been considered for each approach k as reported in table 2 (desired saturation degree). With the new gEk values the condition: ta-delay,k < tf-delay,k is verified for each approach k and then the delay obtained with updated gEk is in any case less than the delay with fixed gEk.Table 2. Crisp evaluation
 |
| |
|
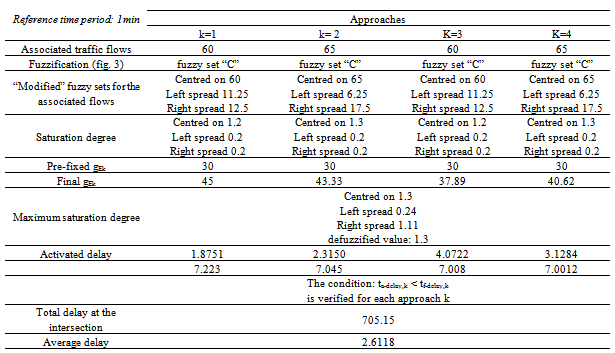
After that, the fuzzy procedure has been tested as described particularly at steps 3 and 4. The sampled, associated traffic flows (table 3) have been fuzzified and the fuzzification mainly involves the fuzzy set labelled as “C” in fig. 3. The overlapping parameters have been set as follows: a=0.1666; b=0.5; c=0.333; d=0.625; e=0.75; f=0.875 to guarantee a better resolution for traffic flow values close to the capacity values - range of the fuzzy sets: R = q’k,max - q’k,min. Then the fuzzy sets representing the associated traffic flows q’k are triangle-shaped as well as the saturation degree because it is computed from fuzzy quantities. Both flows and saturation degree require only centre and spread to be identified in the fuzzy universe of discourse. The maximum saturation degree in fuzzy terms is centred on a value greater than 1 (over-saturation current condition) thus requiring the update of the green times in order to come to an under-saturation state. As it can be seen in tables 2 and 3, the total and average delays obtained with the fuzzy approach are less than those obtained by using the crisp one, thus proving the better adaptability of the fuzzy with respect to the traditional crisp approach.
6. Discussion and Further Developments
Table 3. Fuzzy evaluation
 |
| |
|
Passing through intersections when travelling from an origin point to a destination point is one of the main causes of traffic delay. In fact, the intersection in itself represents an interruption of a flowing traffic because there drivers generally slow down to prevent collisions with other vehicles passing through it at the same time. For a given intersection belonging to an origin/destination (o/d) path, the delay can be defined as the difference between the time the vehicle spends to move between the o/d pair and the time it would have spent without the intersection.Furthermore, the greater the traffic flow the greater the delay at the intersection. The delay can be as more relevant as many traffic streams interact among them. The example described in section 4 has showed that the use of the fuzzy procedure reduces the total and average delay at the intersection by modifying the phase duration according to sampled traffic flows.The described test case refers to the critical situations (rush hours) with high saturation degree levels, when the delay effects can be more relevant.It is worthwhile to note that the experiment refers to a short reference time period (1 minute), but the time saved is more significant during the whole peak period. As discussed in the introduction, the time saved at the intersection is not only important for drivers in terms of easier mobility, but also to reduce the environmental effects due to a greater fuel consumption when waiting for passing through.While demand-responsive control is not new, the fuzzy approach proposed here has showed very good performances particularly with respect to the “crisp” one. The crisp approach here is intended to represent one of the possible, existing traffic lights control systems. In fact, most of them use sampled traffic flow to reduce delays without data transformation. In other words, the sampled data are used in a “crisp” way although in some cases a probability distribution is employed to consider the uncertainty in detected data. In addition, the proposed fuzzy calculus approach as a sequence of arithmetical operations obviates the obstacle to set fuzzy systems in which the “explosion of rules” could be a real problem. Moreover, that sequence of arithmetical calculi decreases the computational complexity of the presented procedure making it competitive with respect to more sophisticated techniques. This is true especially when the designed procedure is exploited in a production line to deploy the system on a hardware device . Obviously, in this case, the hardware device has to be checked and eventually revised when small batch data are available in due form.As tables 2 and 3 show, the fuzzification procedure gave better results in terms of delay reduction with respect to the crisp one. The improvement is about 4% in the reference time period, but it is expected to be more relevant during one hour or during rush hours for highly congested systems.Furthermore, while the average delay between crisp and fuzzy is rather similar, the total delay is different – and better for the fuzzy case. In the considered test case the road network was considered highly congested – in fact the saturation degree is higher than 1 and the desired one is set less than 1 but rather close to 1 because it is unrealistic to choose low saturation degree in highly congested conditions. In these cases the best indicators is the time saved by the set of drivers (total delay) rather than that saved by the single driver. Moreover, the delay reduction for a set of drivers also means greater reduction of environmental effects.One important aspect of the fuzzification procedure is the choice of the fuzzy sets. Here a greater resolution has been used for traffic flow values close to the capacity value. According to eq. (1), when the traffic flow values are close to the capacity value, the increase in delay could be relevant also for small variations of the flow values. The increase in accuracy of the fuzzy representation of those values helped to obtain a better control of the intersection delay. In fact, the fuzzified flows are not represented by an isosceles triangle – e.g., they are centred on 60, left spread 11.25, right spread 12.5 or centred on 65, left spread 6.25, right spread 17.5 – and their fuzzy values are then decentralized. As depicted in Figure 3, this resulting eccentricity allows a better representation of these values and then a better adjustments of the phase duration according to them.In conclusion, the proposed fuzzy approach is very promising to reduce delay at controlled intersections and further improvements can be obtained by choosing some other membership functions according to statistical considerations and/or experts knowledge. In addition, tuning neuro-fuzzy techniques or ellipsoidal fuzzy systems with supervised learning can be used to obtain a refined partition of the range of the possible values.Further developments are still expected starting from these encouraging results. The first one concerns the simulation of a more complex intersection with many movements, particularly turn right and/or left. The second expected advancement concerns the simulation of the intersection also during off-peak periods. To clarify, significant delay arises only during the rush hours, while during off-peak hours it reduces to the minimum allowable to pass through the intersection. Signalized intersections are mainly used to control traffic in order to increase safety rather than to reduce delay, but during off-peak hours paradoxically they can increase the delay. In fact, when the traffic flow is low the probability to have concurrent crossings is low too. In this condition, fixed phase duration at a given intersection represents an inefficient system to control traffic flows because vehicles arriving at the intersection have to wait until the green phase occurs even if any other vehicle is coming from other approaches. Then, the time saved during off-peak periods could be relevant for the single driver, while during rush-hours is relevant for the traffic stream and mainly for the community in terms of environmental effects and quality of life.
References
| [1] | Dargay J. M., 2001. The effect of income on car ownership: evidence of asymmetry. Transportation Research Part A: Policy and Practice 35(9), 807–821. |
| [2] | Banister D., 2008. The sustainable mobility paradigm. Transport Policy 15, 73–80. |
| [3] | Stanley J., Hensher D. A., S.anley J., Currie G., Greene W. H., Vella-Brodrick D., 2011. Social Exclusion and the Value of Mobility. Journal of Transport Economics and Policy 45(2), 197-222. |
| [4] | Dubois D., Bel G., Llibre M., 1979. A set of methods in transportation network synthesis and analysis. Journal of the Operational Research Society, 30(9), 797-808. |
| [5] | Yang H., Yagar S., 1995. Traffic assignment and signal control in saturated road networks. Transportation Research Part A 29, 125–139. |
| [6] | Hunt, P.B., Robertson, D.L., Bretherton, R.D., 1982. The SCOOT on-line traffic signal optimisation technique. Traffic Engineering and Control 23, 190–192. |
| [7] | Hallmark, S.L., Fomunung, I., Guensler, R., Bachman, W., 2000. Assessing impacts of improved signal timing and transportation control measure using an activity-specific modeling approach. Transportation Research Record 1738, 49–55. |
| [8] | Unal, A., Rouphail, N.M., Frey, H.C., 2003. Effect of arterial signalization and level of service on measured vehicle emissions. Transportation Research Record 1842, 47–56. |
| [9] | Li, X., Li, G., Pang, S., Yang, X., Tian, J., 2004a. Signal timing of intersections using integrated optimization of traffic quality, emissions and fuel consumption: a note. Transportation Research Part D 9, 401–407. |
| [10] | Pandian S., Gokhale S., Ghoshal A. K., 2009. Evaluating effects of traffic and vehicle characteristics on vehicular emissions near traffic intersections. Transportation Research Part D 14, 180–196. |
| [11] | Niittymaki, J., 2001. General fuzzy rule base for isolated traffic signal control rule formulation. Transportation Planning and Technology, 24(3), 227-247. |
| [12] | Li, J., Yue, Z.Q., Wong, S.C., 2004b. Performance evaluation of signalized urban intersections under mixed traffic conditions by gray system theory. Journal of Transportation Engineering 130, 113–121. |
| [13] | Wen W., 2008. A dynamic and automatic traffic light control expert system for solving the road congestion problem. Expert Systems with Applications 34, 2370–2381. |
| [14] | Chong Y., Quek C., Loh P., 2009. A novel neuro-cognitive approach to modeling traffic control and flow based on fuzzy neural techniques. Expert Systems with Applications 36, 4788–4803. |
| [15] | Webster F. V., 1958. Traffic Signal Settings. Road Research Technical Paper 39, Road Research Laboratory, London, UK. |
| [16] | Zimmermann, H.J., 1996. Fuzzy Set Theory and its Application. Kluwer Academic, Amsterdam, The Nederlands. |
| [17] | Kosko B., 1997. Fuzzy Engineering. Prentice Hall Editions. |
| [18] | Rouhparvar H, Panahi A., Zanjani A. N., 2011. Fuzzy Distance Measure for Fuzzy Numbers. Australian Journal of Basic and Applied Sciences, 5(6), 258-265. |
| [19] | Jang R., Sun C., 1993. Neuro-Fuzzy Modelling and Control, IEEE Transaction on Systems. Man and Cybernetics, 23(3), 665-685. |


 For a given stream of the approach k, the incoming flow (qk) is the number of vehicles (cars, buses, motorcycles) arriving at the approach k during the reference time period T. The maximum flow of the approach k , sk, is defined as the maximum number of vehicles that can cross the intersection during the reference time period under the hypotheses of: i) unoccupied intersection; ii) green signal; iii) continuous queue. Let Nv be the number of vehicles that, under the previous hypotheses, cross the intersection during the green and amber time intervals.It can be useful to refer to the “effective green”, gek, and the “effective red”, rek, rather than the actual green gk and red rk, ([15]). They are defined such as: during gek the incoming flow qk is constant and equal to sk.; during rek any vehicle leaves the intersection. They are computed as:gek = Nv / skrek = C- gekFor the approach k of a signalized intersection, the delay tdelay,k can be computed as ([15]):

 Finally, at a first attempt the performances of a given intersection can be measured by the saturation degree of its own approaches, xk, such as:

 . The support of A, supp(A), is the closure of the set
  and for each
  the
the  of A is defined by
  ([19]). A Fuzzy Number (FN) represented by
  - where m, n, r, t are left point, right point, left spread, right spread respectively - is a normalized convex fuzzy subset on the real line
  if:- Supp(A) is a closed and bounded interval;-
  is an upper semi-continuous function;-
 ;- the membership function has the following form:-
  where f(x) and g(x) are the monotonic increasing and decreasing functions respectively. Specifically, an LR-type fuzzy number (LR – Left and Right) is obtained from FN if the shape functions f(x) and g(x) are approximated respectively by:
 Particularly, A is trapezoidal in shape if m
 which is explicitly shown for an LR-type fuzzy number
 for all α∈[0, 1]. Arithmetic operations in the FN domain are defined as follows([18]):(i)Addition:
  ;(ii)Subtraction:
  ;(iii)Multiplication:
 ;(iv)Division:
 .
. If this inequality is verified, there is no need to update the green values gEk.
 , then the fuzzy sets for each approach k can be defined as:
 where a, b, c, d, e, f are suitable parameters that characterize the overlapping of the range of the possible values (Figure 3). Each fuzzy quantity is associated to a fuzzy membership function μZ, Z being a generic fuzzy number. When a traffic flow is sampled, all the values of μZ (q’k) are computed. The fuzzy number Z whose membership value is
  represents q’k in the following steps. Furthermore, it is centred on the crisp value q’k and its support is equal to that of Z - then both the right and left spreads generally are asymmetric (fuzzy sets “modified”).STEP 4: Initialization of gEk f for each approachThe initial values for the green times gE1, gE2, …, gEk …, gEn are set. Note that the green times are equal for associated flows.STEP 5: Under-saturation condition testingFor each approach, the saturation degree is computed as:
 with:
with: Here the membership functions are triangular-trapezoidal shaped, so only cuts of levels 0 and 1 need([18]). Then, the maximum value of the saturation degree among all the computed values is considered:
 In fact, if the condition
 STEP 6: Update of gEk for each approach and defuzzificationThe value gEk for each approach is updated by using the criteria of the saturation degree. Particularly, a xk value less than 1 is set to guarantee under saturation conditions and the new value gEk is computed by:
 Two delay values are computed by using eq. (1): the fixed and activated delay. The fixed delay, tf-delay,k, is obtained by eq. (1) with pre-fixed gEk, i.e. without any traffic lights control. On the contrary, the activated delay, ta-delay,k, is that obtained still by eq. (1) but with gEk obtained by eq. (4):
 If the following condition occurs: ta-delay,k < tf-delay,k, then the values gEk remain unchanged.At this point, the new values gEk have been obtained and the procedure repeats from Step 1 with these new values. The iteration ends with defuzzification calculus, in other words each fuzzy output is defuzzified by computing its centre of gravity (Guldino-Pappo formula).
 Abstract
 Reference
 Full-Text PDF
 Full-Text HTML

