Salvatore Caprì , Matteo Ignaccolo , Giuseppe Inturri
Dipartimento di IngegneriaCivile e Ambientale, University of Catania, Viale Andrea Doria, 6, 95125, Catania, Italy
Correspondence to: Salvatore Caprì , Dipartimento di IngegneriaCivile e Ambientale, University of Catania, Viale Andrea Doria, 6, 95125, Catania, Italy.
| Email: |  |
Copyright © 2012 Scientific & Academic Publishing. All Rights Reserved.
Abstract
Schools are among the most significant traffic generators in urban areas. Recent statistics show that at least 60% of parents take their children to school by car, although up to 90% of children would like to go to school on foot or by bicycle. Parents feel the need to personally take their children to school in a ‘safe’ way, ignoring the fact that the increase in the number of cars leads to a further lowering of safety, which forces other parents to use cars as well. Thus, there are more cars than children in Europe.It is now widely recognized that it is desirable to install a series of traffic calming devices aimed discouraging the vehicular crossing of residential streets and encouraging motorists to behave in an safe way that is compatible with non-motorized mobility. However, the scientific literature lacks methods for the numeric assessment of the effects produced by the installation of these devices.The objective of this work is to develop a pedestrian safety indicator for evaluating the effectiveness of traffic calming measures. The indicator is calculated using a mathematical model to estimate the probability of conflict between a vehicle and a pedestrian crossing the road. This indicator is considered a measure of the pedestrian safety of the road.The values of the model variables are assessed by a micro simulation model of vehicle/pedestrian interactions in both the absence and presence of several traffic calming measures, to provide a quantitative assessment of the effectiveness of the speed control device.
Keywords:
Pedestrian Safety, Traffic Calming, Micro Simulation, Pedestrian Crossing, Road Geometry, Traffic Speed
Cite this paper:
Salvatore Caprì , Matteo Ignaccolo , Giuseppe Inturri , "Evaluating the Effectiveness of Traffic Calming Devices: Using Simulation to Overcome Analytical Models Assumptions", International Journal of Traffic and Transportation Engineering, Vol. 1 No. 3, 2012, pp. 46-51. doi: 10.5923/j.ijtte.20120103.03.
1. Introduction
Many studies on road safety are based on identifying points of the road network where a significant number of accidents have occurred in the past (black spots), trying to find a correlation of these events with a set of causes. Classic regression analysiscan be used to do that (as in[4]), even if authors tend to use more complex techniques,involving more variables than vehicle speed (and thus based on more extensive data bases), as cluster analysis (e.g. in[7]) or existing predictive models calibration (e.g. in[12])The causes are generally related to three categories: ‘vehicle’, ‘man’ and ‘environment’. The relationship is often of a statistical nature, although a clear connection between cause and effect is sometimes lacking. Generally, the level of risk is assigned to each spot depending on the number of accidents occurring on a historical basis in relation to the location’s exposure (e.g., conflicting traffic volumes). Therefore, a priority level is assigned for action aimed at improving safety based on the reduction of the factors associated with the event.The practice described above is sufficiently suitable for the analysis of accidents between vehicles on rural roads.In an urban environment, and dealing with conflicts between pedestrians and vehicles, a number of specific problems arise:•pedestrian accidents occur as very disperse events along the urban road network, i.e., that they tend to not to be concentrated in a limited number of spots;•a limited number of accidents is not connected with low risk levels (pedestrians do not cross unsafe roads);•it is generally difficult to assess exposure due to the lack of pedestrian flow data;•risk estimates are not highly significant for the data dispersion over time and space.For rural roads, the ratio between the number of accidents and the number of potential conflicts may represent a numeric indicator of the accident risk, thus allowing a comparison of sites with the same exposure level (traffic). In urban areas, however, there are generally poor data on potential conflicts due to the unavailability of pedestrian flow counts and the lack of reliable data about accidents involving pedestrians.Even it is generally assumed and reported that fatality risk increases monotonically with car impact speed, the absolute risk estimates varies considerably([9],[10]).
2. The analytical model
There is a method for the evaluation of pedestrian safety in urban environments that is an alternative to the statistical correlation based on accident rates. This method is based on thedeterministic analytical modelin[2]. In summary, the model calculates whether a vehicle travelling along a road is able to avoid or not avoid a collision with an object that appears on its trajectory, depending on the object’s position and the vehicle’s speed. The model is suitable for the estimation of pedestrian safety in urban areas because the historical data on pedestrian accidentsshow that one of the most typical kinds of accidents involves a careless person who suddenly crosses the road, as noticed in[11].A significant number of these accidents involve unaccompanied children. Accidents caused by an error in the estimation of the time required to perform a safe crossing rarely occur because pedestrians tend not to cross in the presence of vehicles running in queue. Thus, a vehicle travelling a light traffic road nearby at a ‘desired’ speed is the most dangerous condition from the point of view of the pedestrian(as in[6])because the strong non-linearity of the damage severity increases along with speed.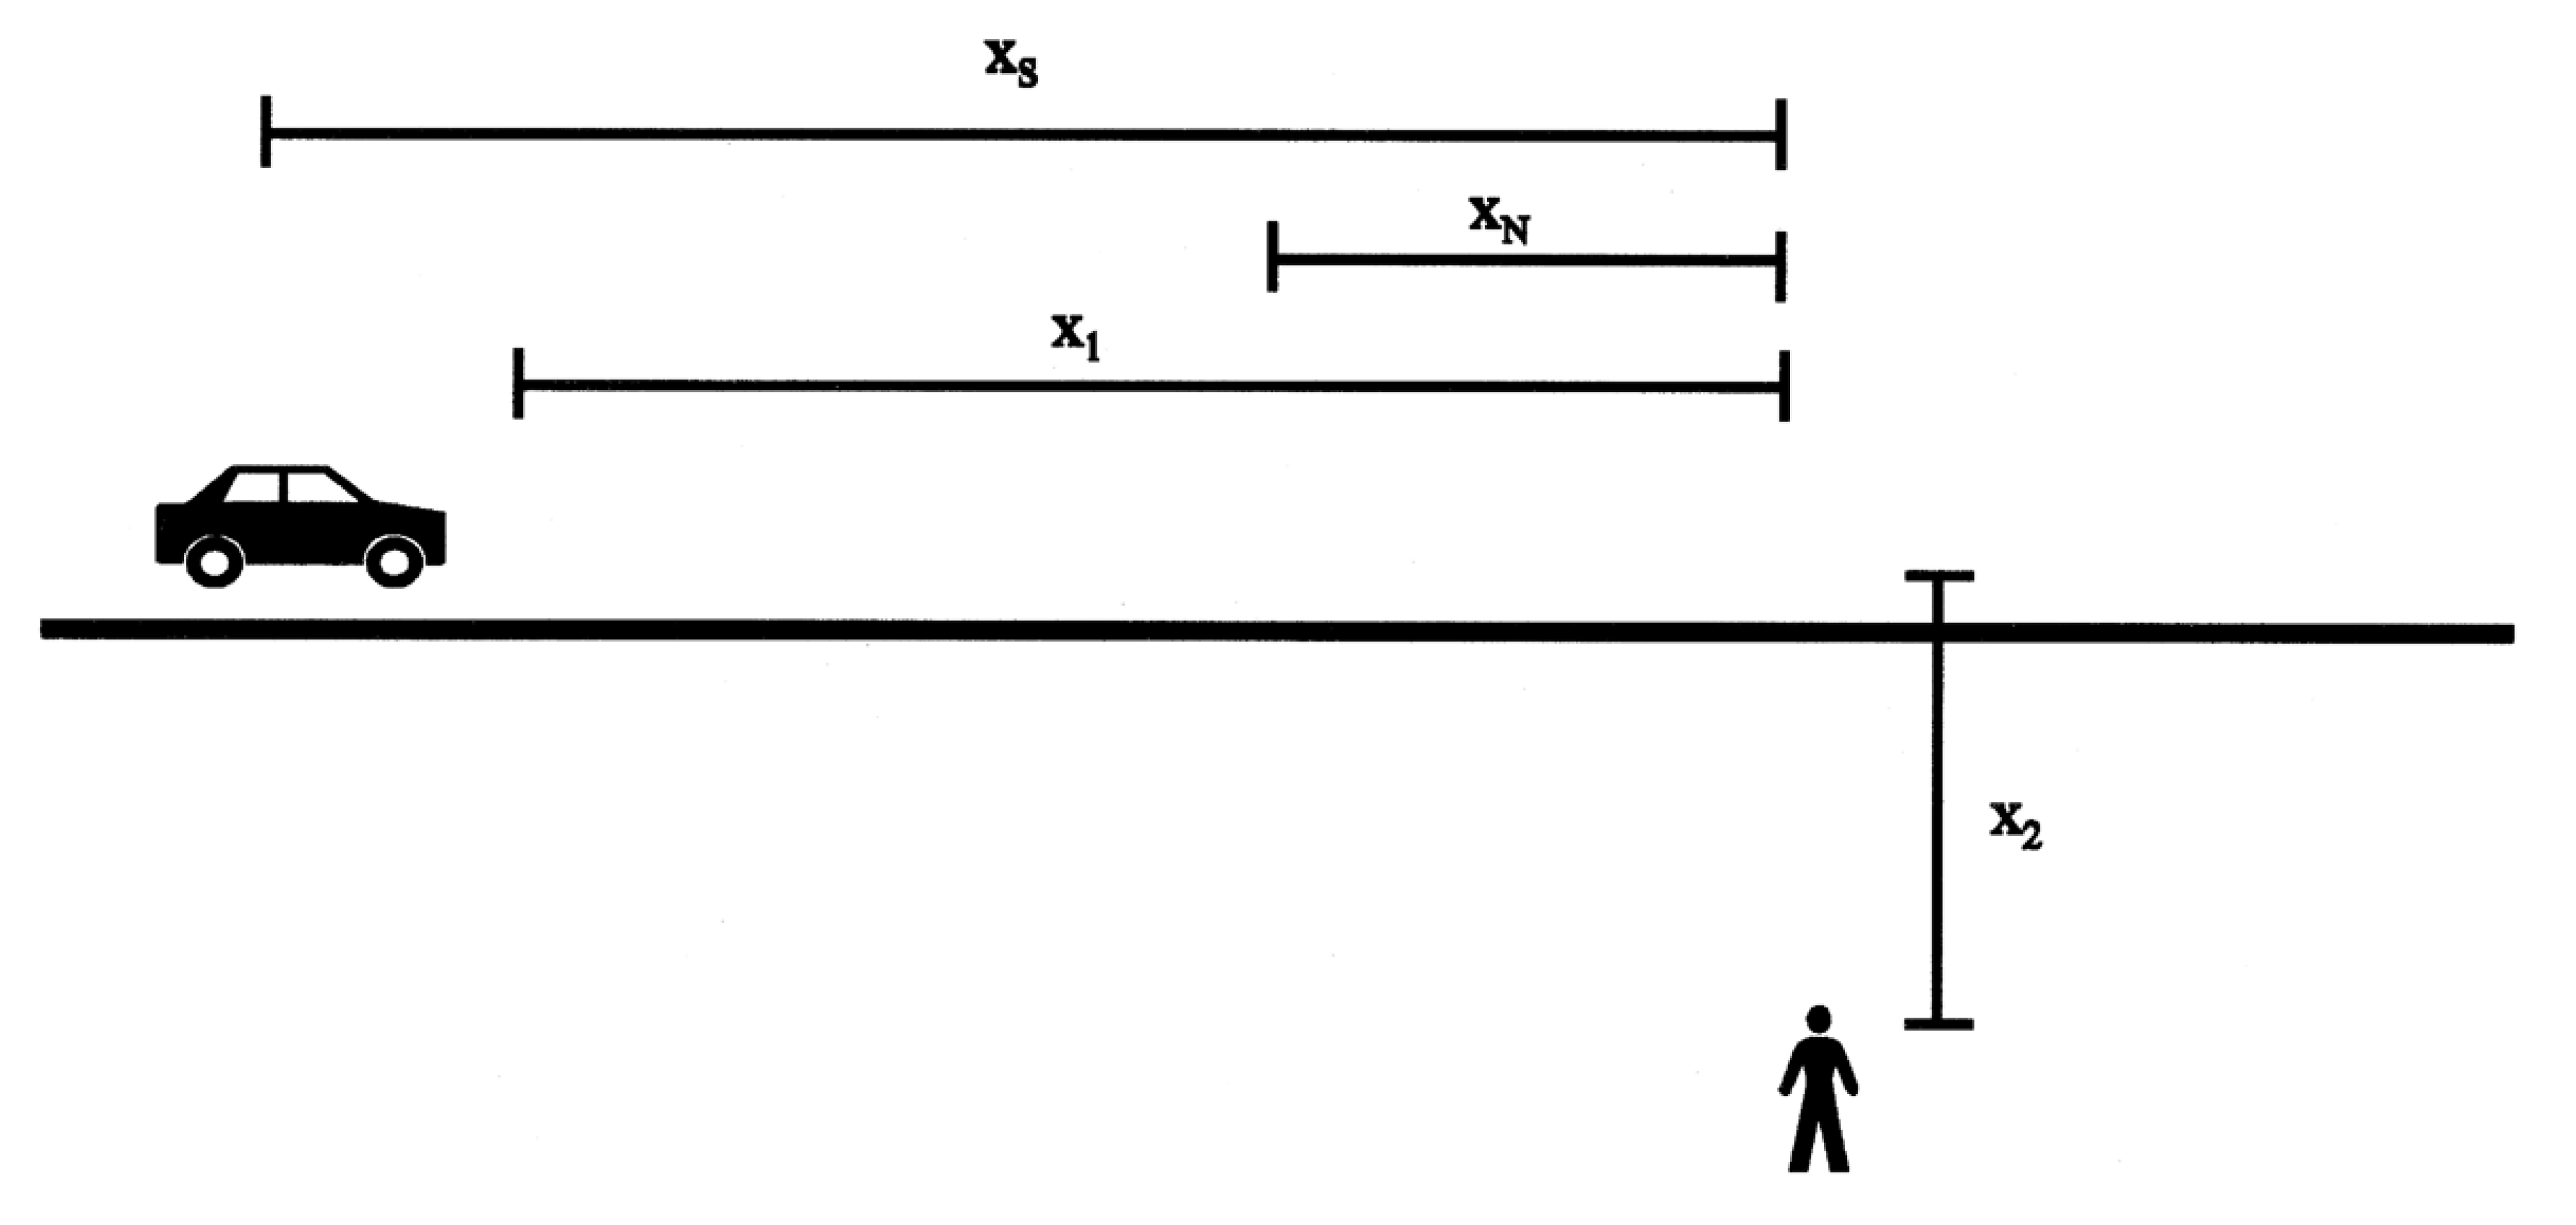 | Figure 1. Scheme of the model([2]) |
The collision probability depends on the following (see Figure 1):•pedestrian speed v2•distance between the pedestrian and the conflict point x2•vehicle speed v1•distance between the vehicle and the conflict point at the moment when the driver perceives the presence of the pedestrian x1.The assumptions are as follows:•the pedestrian crosses in a thoughtless way and does so suddenly, as an unaccompanied child would do;•only the driver carries out evaluations about how to behave.The model dynamics imply that the collision will not occur if one of the following two conditions applies at the moment the driver sees the pedestrian:•the vehicle is located at a distance x1 longer than the stopping distance xS and long enough to stop the vehicle before the conflict point;•the vehicle is located at a distance x1 shorter than the distance xN, so it crosses the point of conflict before the pedestrian.The following equations apply (being xN the minimum distance for the vehicle to the point of conflict in order to cross it before the pedestrian): | (1) |
 | (2) |
Where a is the braking deceleration and tpis the reaction time of the driver.In all the other conditions, i.e., when xN< x1 < xS, a collision between the vehicle and the pedestrian occurs.With these assumptions, the model is deterministic, even if many of the variables have a random nature. In[2]a normal probability distribution for the vehicle speed v1is assumed. A Poisson-type arrival process (derived from a negative exponential distribution of time among arrivals) links the distance x1 to the traffic flow q, assigns a deterministic value to all other variables and calculates the probability of conflict with (3), assuming flow and speed as independent.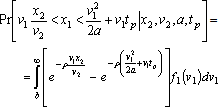 | (3) |
where 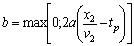 and
and the spatial density of vehicles on the road, with q being the average traffic volume and μbeing the average traffic speed.
3. Proposed Methodology
By way of example, an application of the analytical model is given with the input values in Table 1 with a flow of q = 50 vph and a distribution of vehicle speed as in Figure 2. The estimated probability of a collision, then, is equal to 0.0075. | | Input | Unit | Value | | Average traffic speed | km/h | 40.0 | | Standard deviation of traffic speed | km/h | 6.0 | | Coefficient of variation | | 15.0% | | Sidewalk width | m | 6.5 | | Pedestrian speed | km/h | 4.6 | | Reaction time | s | 1.0 | | Braking deceleration | m/s2 | 5.9 |
|
|
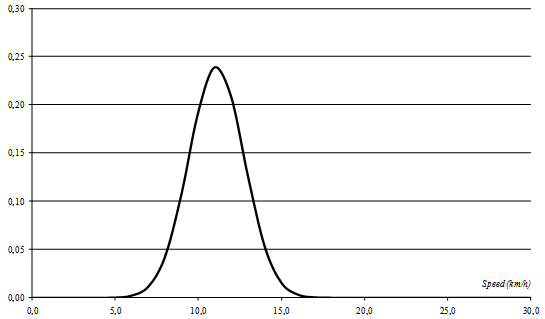 | Figure 2. Probability density function of vehicle speed |
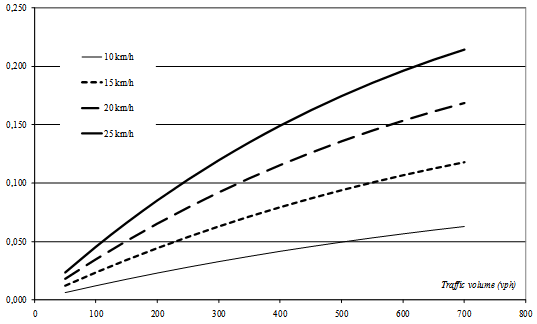 | Figure 3. Collision probability, traffic volume and speed |
Figure 3 shows the results of applying the model to estimate the conflict probability as a function of traffic volume. Each curve refers to a different value of the average traffic speed.Note that the model by Davis is essentially deterministic because a constant value is assigned to all variables apart from the probabilistic nature of v1.The validity of the analytical model is largely dependent on the assumption that flow and speed are independent; the time interval between two arrivals is exponentially distributed, so the distance between vehicles is also exponentially distributed. The more the traffic flow increases, the less realistic these assumptions are because of the rising interactions among vehicles. These assumptions decay even for lighter traffic flows if traffic calming devices are installed, which materially affect the probability distributions of speed and distance. The objective of this work is to bypass the assumptions underlying the analytical model and to provide a procedure that can be used more generally.The probability of a collision can be computed as an indicator for estimating the pedestrian safety of a road and its variation as a result of a traffic calming device. The use of the expression (1) of the Davis model for this purpose raises two issues:•the calculation in closed form is possible only for special forms of mathematical distributions of vehicular speeds;•the introduction of a traffic calming device varies the distribution of speed and distance in time, and the new distribution should be investigated by intensive measurement campaigns.To overcome these barriers, the proposed methodology provides the following: •the use of an analytical model to calculate the probability of collision in the absence of traffic calming devices;•the use of a micro simulation model of the vehicular flow to obtain a series of ‘measures’ for speed and vehicle spacing, as modified by the traffic calming devices;•calculation of the new value of collision probability based on a comparison of the spacing of each pair of vehicles with the values of xS and xN for the vehicle that follows;•assessment of the effectiveness of different solutions in terms of the reduction of collision probability.
3.1. The Micro Simulation Model
The micro simulation model is based on the use of the VISSIM software developed in Germany by PTV, which is widely used by municipalities and local road traffic managers. It is a microscopic model that explicitly simulates the behaviour of individual vehicles and their interactions to reproduce and analyse different configurations of a part of the urban road network in terms of road geometry and traffic regulation. Figure 4 shows the work environment for one of the case studies simulated.Different types of vehicles in static (size and road occupancy) and dynamic terms (distribution of speed, distance, acceleration and deceleration) can be simulated. In addition, pedestrian crossings and their interactions with other vehicles can be considered. The output of the model includes measures of traffic volumes, vehicular speeds, travel times, delays, queue lengths and more.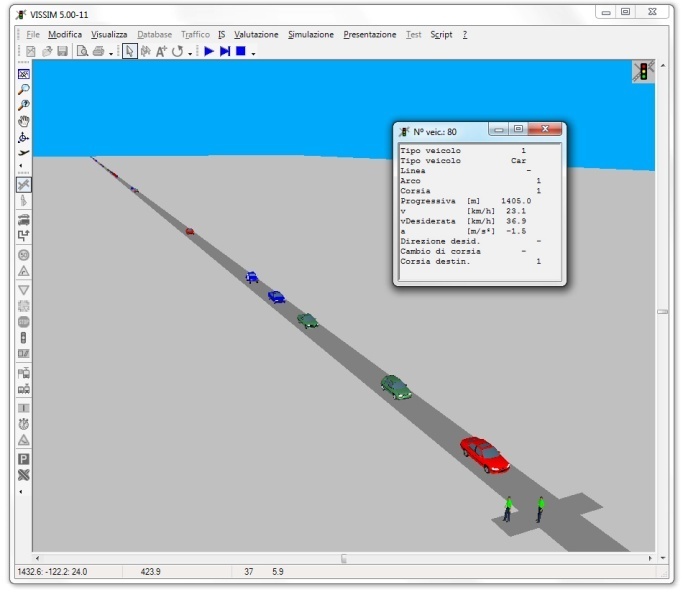 | Figure 4. The micro simulation environment |
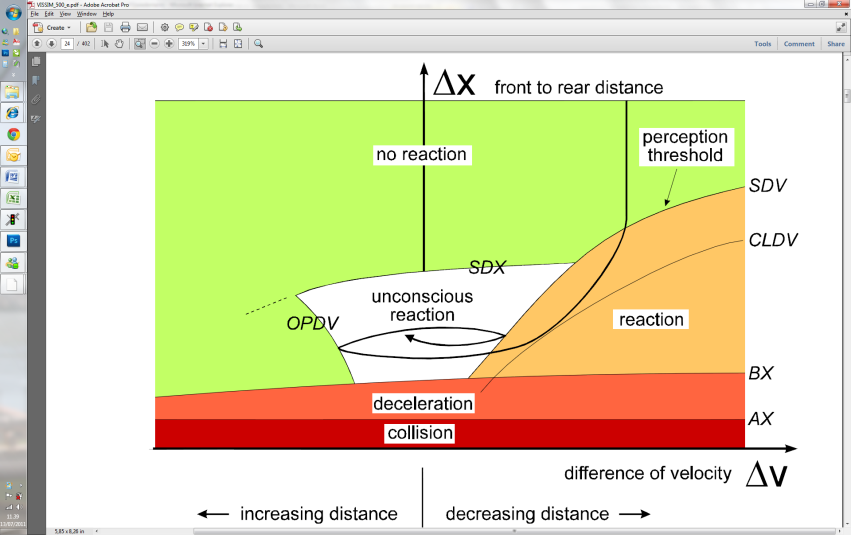 | Figure 5. Car following model by Wiedemann ([8]) |
The quality of the traffic flow model, which describes the movement of vehicles in the network, is essential for the quality of the simulation itself. Instead of simpler models that assume a constant speed and a deterministic process of vehicle arrival, the model of psychophysical perception by Wiedemann, described in[5],is used, whose scheme is shown in Figure 5.The distribution functions for speed and spacing between vehicles allows consideration of the different behaviours of different drivers.
3.2. Case Studies
The micro simulation has been used to obtain the distribution of speed and distance between vehicles for various traffic volumes with and without the installation of different traffic calming devices. Using the described method, the probability of collision has been calculated based on the distributions of speed and spacing.In the simulation environment, a road link of 1500 meters has been built, and three series of simulations have been carried out for three different configurations:•no traffic-calming devices installed (NOTC);•Type 1 traffic calming device installed (TC1);•Type 2 traffic calming device installed (TC2).For each of these configurations, simulations were conducted with different traffic volumes accessing the road: 50, 100, 500 and 1000 vph.A Poisson-type arrival has been assumed for vehicles.For each value of volume, the individual vehicle speed and distance were measured for vehicles crossing a road section near the end of the link (at a distance of approximately 1490 m).The vehicle speed distribution when accessing the link is considered a common feature for all the simulations. In detail, a normal distribution is assumed, with a mean speed μof 40 km/h and a standard deviation σ of 6 km/h. These parameters mean that 99.7% of vehicle speed values are within the range  , that is, between 22 and 58 km/h.The same traffic calming devices have been introduced in all simulations, thus causing the same reduction in speed in the surroundings. The devices have been placed in road sections at different distances from the measurement section. When facing a traffic calming device, drivers assume the following behaviours:the traffic calming device ‘requires’ a speed of 20 km/h to be crossed;after crossing the device, each vehicle tends to regain its average speed with a uniformly accelerated motion (acceleration equal to 2.5 m/s2) using space s, which is obtained by (4) and (5):
 | (4) |
 | (5) |
For values of v0 and v equal to 20 and 60 km/h, respectively, a value of s= 49.40 m is obtained. TC1, therefore, is placed at a distance of 50 m from the measuring point to allow the desired speed to be achieved. TC2 is placed at a distance of 20 m from the measuring point so that vehicles are still accelerating when crossing the measurement section. Shorter distances have been not considered since they can have opposite effects, as in[3].Table 1 shows the values for the basic parameters for all simulations, regardless of the traffic volume.
4. Results
The application of the model to the case studies identified provides some interesting results, as shown in Table 2. For each assumed value of traffic volume, the three configurations of traffic calming measures are compared in terms of the probability of collision of the pedestrian, the spatial distance and the speed at the pedestrian crossing section.Each combination of case study and traffic flows (rows in Table 2) requested 30 simulations with different seeds, each run for 3’600 seconds.The results for the NOTC configuration show significant differences from the results of the analytical model due to the interaction between vehicles along 1500 meters, which produces very different distance and speed distributions from those theoretically assumed in the model by Davis.In the TC1 case, in light traffic conditions (50 and 100 vph), a decrease in distance and a substantially unchanged speed are noticed. For heavier traffic conditions (500 and 1000 vph), an increase in both speed and spacing occurs. In fact, when the traffic volumes are low (and, therefore, when the vehicle speed is mostly unaffected by other vehicles), the traffic calming system only has the effect of shortening distances. In contrast, as the volumes increase, while influencing the vehicles’ speed, the traffic calming device tends to extend distances, thus spreading out vehicles and allowing a moderate increase in speed.Moving from the TC1 to the TC2 configuration, a reduction of distances and a significant decrease in speed are noticed, especially for heavier traffic volumes. In fact, when the traffic calming device is placed 20 m from the pedestrian crossing, the vehicles are still in the acceleration phase and have not yet reached the desired speed. The consequence is a reduction of the probability of collision as the traffic volume increases.In fact, the traffic calming device produces a local increase in vehicle density, with a compression of the spacing and a consequent reduction in speed. The reduction in speed leads, however, to a more significant reduction in stopping distance xS than the reduction of spacing between vehicles, with the consequence of globally reducing the collision probability. This effect is more evident when the traffic volume is high and the traffic calming device is closer to the crossing section (TC2).In considering the values of the collision probability and their reduction from one case-study to another, it has to be noticed that they are based on the hypotheses of the Davis model (careless pedestrians or children, above all). Reference[1] indicates that real traffic calming measures can reduceroad total traffic injuries by about 10-15%.| Table 2. Simulation Results |
| | Traffic volume (vph) | Case study | Collision probability | Average spacing (m) | Spacing std. deviation | Average speed (km/h) | Speed std. deviation | | 50 | NOTC | 6.35% | 527 | 437 | 37.6 | 6.7 | | 50 | TC1 | 3.64% | 473 | 400 | 37.1 | 6.8 | | 50 | TC2 | 0.00% | 472 | 401 | 34.7 | 9.0 | | 100 | NOTC | 8.79% | 323 | 348 | 34.8 | 7.1 | | 100 | TC1 | 3.30% | 314 | 340 | 34.2 | 6.5 | | 100 | TC2 | 1.09% | 324 | 360 | 30.9 | 8.8 | | 500 | NOTC | 19.37% | 62 | 112 | 32.3 | 5.6 | | 500 | TC1 | 7.89% | 69 | 110 | 33.5 | 5.2 | | 500 | TC2 | 0.23% | 64 | 110 | 22.7 | 5.6 | | 1000 | NOTC | 20.87% | 31 | 54 | 32.5 | 5.4 | | 1000 | TC1 | 5.95% | 33 | 47 | 33.5 | 5.0 | | 1000 | TC2 | 0.00% | 27 | 47 | 20.6 | 2.2 |
|
|
5. Conclusions
The results of the simulations carried out by the use of these models can be an easy tool for transportation engineers, initially through the identification of areas with a high probability of accidents and then through the protection of paths with the introduction of the traffic calming device more suited to the features of the study area. This tool will also be useful to officers and technicians of public authorities in the definition of regulations and design criteria for urban roads to contribute to the sustainable development of towns.More specifically, the proposed approach can be useful in identifying the best strategies for traffic calming on the basis of two main considerations:• First, it is possible to analyse in detail any geometric and functional configuration for a possible intervention to reduce traffic speed and to evaluate key indicators (e.g., the probability of pedestrian collision) by means of the procedure described above.• In addition, a series of typical situations, properly parameterised and subsequently analysed by the proposed procedure, along with some general guidelines for identifying and positioning traffic calming devices, can be derived and used when neither the opportunity nor the resources are available to carry out the simulation to analyse the specific case.
References
| [1] | Bunn, F., Collier, T., Frost, C., Ker, K., Roberts, I., Wentz, R., 2003. Traffic calming for the prevention of road traffic injuries: systematic review and meta-analysis. Injury Prevention 2003;9:200–204. |
| [2] | Davis, G., 1998. Method for estimating effect of traffic volume and speed on pedestrian safety for residential streets. Trans. Res. Rec. 1636, 110-115. |
| [3] | Johansson, C., Rosander, P., Leden, L., 2011, Distance between speed humps and pedestrian crossings: Does it matter? Accident Analysis and Prevention 43. |
| [4] | Kong, C., Yang, J., 2010. Logistic regression analysis of pedestrian casualty risk in passenger vehicle collisions in China. Accid. Anal. Prev. 42, 987–993. |
| [5] | Leutzbach, W., Wiedemann, R., 1986. Development and Application of Traffic Simulation. Models at Karlsruhe Institut fur Verkehrwesen, Traffic Engineering and Control, May, pp. 270-278. |
| [6] | Pasanen, E., Salmivaara, H., 1993. Driving speeds and pedestrian safety in the city of Helsinki. Traff. Eng, Control 308-310. |
| [7] | Postorino M. N., Sarnè G. M. L, 2002. Cluster analysis for road accidents investigation, in: Editors L. J. Sucharov, C. A. Brebbia, F. Benitez, Urban Transport 2002, WIT Press (GBR), p. 785-794. |
| [8] | PTV, 2008. VISSIM User Manual 5. Planung Transport Verkeher AG, Germany. |
| [9] | Rosén, E., Sander, U., 2009. Pedestrian fatality risk as a function of car impact speed. Accident Analysis and Prevention 41. |
| [10] | Rosén, E., Stigson, H., Sander, U., 2011. Literature review of pedestrian fatality risk as a function of car impact speed. Accident Analysis and Prevention 43, 25-33. |
| [11] | Stutts, J., Hunter, W., Pein, W., 1996. Pedestrian crash types: 1990’s update. Trans. Res. Rec. 1538, 68-74. |
| [12] | Gårder, P.E., 2004. The impact of speed and other variables on pedestrian safety in Maine. Accident Analysis and Prevention 36, 533–542. |
 Abstract
 Reference
 Full-Text PDF
 Full-Text HTML