-
Paper Information
- Paper Submission
-
Journal Information
- About This Journal
- Editorial Board
- Current Issue
- Archive
- Author Guidelines
- Contact Us
International Journal of Traffic and Transportation Engineering
2012; 1(1): 1-6
doi: 10.5923/j.ijtte.20120101.01
Utilizing Vissim to Evaluate Ramp Metering Performance
 Abstract
 Reference
 Full-Text PDF
 Full-Text HTML
Akmal Abdelfatah 1, Ahmed Ramadan 2, Gamal Darwish 3
1Civil Engineering Department, American University of Sharjah, P.O. Box 26666, Sharjah, United Arab Emirates
2EMAAR,The Economic City, Jeddah, KSA
3Civil Engineering Department, Cairo University, Giza, Egypt
Correspondence to: Akmal Abdelfatah , Civil Engineering Department, American University of Sharjah, P.O. Box 26666, Sharjah, United Arab Emirates.
| Email: |  |
Copyright © 2012 Scientific & Academic Publishing. All Rights Reserved.
This paper provides an example of using microsimulation tools to examine the impact of using ramp metering on freeway performance. The well-known software package VISSIM has been utilized in this work to determine the effect of various parameters, such as volumes to capacity (v/c) ratio, detector location on the freeway, and the green times on ramp metering performance. The test network for this research is a microsimulation model for apart of Emirates Road, which is one of the major freeways in Dubai, United Arab Emirates (UAE). The basic model information was exported from the Dubai Strategic Planning Model R1000 (using VISUM software) to VISSIM (microsimulation software). The traffic conditions considered two different downstream conditions (with and without downstream bottleneck). The results showed that the application of ramp metering has a significant positive effect on freeway performance, when the traffic volume levels are moderate to high. On the other hand, the ramp metering application showed a slight improvement under low or very heavy traffic volumes.
Keywords: Ramp Metering, Microsimulation, Freeway Management
Article Outline
1. Introduction
- Ramp metering has been proven to be one of the effective freeway management strategies as it can improve freeway performance. Therefore, many cities in North America and European countries have applied ramp metering to some of the major freeways. In some cases, ramp metering may result in deterioration in the freeway and/or the ramp performance; therefore, it should be applied carefully. None of the cities in UAE has any freeways that are equipped with ramp metering. This research provides an initial study on the level of effectiveness of ramp metering on freeways inside Dubai, UAE.
2. Literature Review
- Ramp metering has several control strategies that were considered by different researchers. This section provides a brief description of the control strategy used in this research (the ALINEA control strategy) and discusses the different simulation models that have been used to test ramp metering strategies.
2.1. Alinea Control Strategy
- Papageorgiou et. al.[1-3] developed the ALINEA (Asser- vissementLINe´aired'Entre´eAutoroutie) control strategy, which is one of the most common strategies for ramp metering operations. The ALINEA strategy is activated at each time interval T, which is usually between 20 to 60 seconds. At the end of each interval, the ramp flow for the next time interval is calculated through the measured volume and occupancy on the downstream of the ramp. The ramp metering flow equation shows that, the value of the ramp flow is independent of the upstream flow qin, which is not explicitly used in the strategy. Figure 1 shows a schematic representation of the ALINEA strategy.As the main goal of ALINEA is to maximize the downstream flow qout, the set value (desired occupancy) Ô should be set equal to the critical occupancy (Ocr), which should be known before ALINEA can be applied to this end. The Ocr value can be determined either visually from the a (qout; Oout)-diagram, but, in that case Ocr will be a constant value, or by designing a method for maximizing the freeway flow qout without having to rely on constant pre-specified set values Ocr[1- 3].
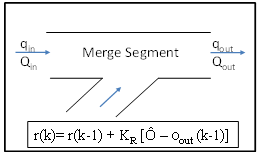 | Figure 1. Illustration of ALINEA strategy[1] |
2.2. Evaluation of Ramp Metering
- Ramp metering performance depends on different factors such traffic volumes on the ramp, downstream traffic conditions on the mainstream flow of the freeway and the queue management handling the queue spillback. In order to identify the impact of these parameters, field test experiments or computer model simulation must be established. The main target of ramp metering is to increase the freeway efficiency, minimizing the travel time, increase on-ramp throughput and reduce accidents. The highest efficiency of the ramp metering system can be achieved when the on-ramp, which is very close to freeway bottleneck, is metered and the on-ramp queues are not considered in the ramp metering objective. On the other hand, the more ramps are metered, the more improvement in the equity of delay distribution for on-ramps system at the price of freeway efficiency[5].Fuzzy Logic Control (FLC) has been utilized as a tool for implementing ramp metering in some cases. However, FLC is complicated and should be applied properly in the field; otherwise FLC will not give the expected results[6]. Several studies[7-13] investigated the effectiveness of ramp metering application with variation in traffic parameters surrounding the study area. The ramp metering effectiveness is usually evaluated through some Measures of Effectiveness (MOE). The most common MOEs used in these studies are saving in travel time, improvement in freeway speed and density. On the other hand, they considered some parameters in their studies such as: downstream traffic condition, traffic volume, target occupancy, detector location and minimum green time.Different control strategies considering the existence of random bottlenecks upstream and downstream of a metered ramp were considered for application by several researchers [14,15].Other research work considered the integration of ramp metering with different applications; such as variable speed limits and corridor network control, while some other researchers developed a system-wide approach for ramp metering[16-18].
3. Experimental Design
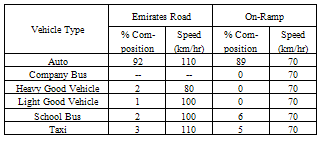
- The Emirates Road in Dubai R1000 model is considered one of the main corridors of the Emirate of Dubai in UAE and it consists of 6 lanes per direction for year 2020. Only one direction of Emirates Road is considered in this study which is from Sharjah to Dubai direction. The studied section along Emirates Road stretches approximately 9.5km and located south of Dubai International Airport. The on-ramp volumes entering the Emirates Road are varied from one on-ramp to another. The traffic composition for Emirates Road isillustrated in Table 1.All traffic data used from R1000 model are based on AM peak period for year 2020. It should be mentioned that all the geometric on-ramps entries for Emirates Road in R1000 model are undefined as R1000 was designed for strategic level.
|
3.1. Stage 1: Study an Isolated Case of Local Ramp Metering
- In order to evaluate the effect of ramp metering implementation and the effect of various traffic parameters on the effectiveness of ramp metering application for any freeway, an isolated case of local ramp metering was considered. One of the parameters used in the design of these experiments is the volume to capacity (v/c) ratio on the main freeway and the on-ramp. The traffic volumes on the freeway and on-ramp were considered to have five levels; 65%, 80%, 95%, 110 % and 120% of the freeway and on-ramp capacities, which were used for the evaluation. Based on these levels, the freeway volumes considered for the experiment are 8,970, 11,040, 13,110, 15,180 and 16,560 veh/hr/ 6-lanes, respectively (assuming capacity per lane to be 2,300 veh/hr), and on-ramp volumes are 585, 720, 855, 990 and 1,080 veh/hr/lane, respectively (assuming capacity per lane to be 900 veh/hr).It should be noted that the assumed capacities and number of lanes on the freeway are adapted from the Dubai R1000 Model.In addition to the v/c ratios on the freeway and the on-ramp, two conditions of downstream (DS) bottleneck were considered for the experimental design (with and without presence of DS bottleneck); it is not enough to test only the case of without DS bottleneck, as it does not reflect reality. In all experiments, no consideration was made for the queue override, so in this case, the ramp queue was allowed to build up infinitely. As ALINEA strategy aims to maintain uninterrupted traffic flow on the freeway, the optimal occupancy, which corresponds to maximum flow for the throughput, should be determined. In this research, fixed values for target occupancy and regulator parameter were assumed as 23% and 70 veh/hr respectively. These values were recommended by previous studies[7,9]. Six detectors (one detector per lane) aligned to each other were located on the freeway at different distances from the on-ramp; in addition, one detector was located on the on-ramp. Also, different minimum green times were tested to verify the most effective detector location and proper green time, which will be reflected in improvement of MOEs. An actuated traffic signal control has been added using VISSIM VAP (Vehicle Actuated Programming) in order to simulate the ramp metering operation. VAP interprets the control logic commands and creates the signal control commands for VISSIM network based on the control logic script file and the data reflected from detectors during simulation.
3.2. Stage 2: Study the Impact of Applying Ramp Metering to a Local Freeway
- In this stage, the ramp metering application is applied to the selected part from Emirates Road under the following scenarios:1-Only one ramp metering applied for the selected part of Emirates road and all other on-ramps are not metered.2- Two successive ramp metering applied for the selected part of Emirates road and all other on-ramps are not metered 3-Three successive ramp metering applied for the selected part of Emirates road and all other on-ramps are not metered 4-One ramp metered followed by a non-metered on-ramp followed by a metered on-ramp and all other on-ramps are not metered These scenarios were derived to reflect the effect of applying ramp metering to Emirates Road. In all above scenarios the same levels of O-D demand mentioned in the isolated case stage are used For both stages, the total simulation time is one hour to collect data for analyses. Each experiment performed with three random seeds to ensure the validity of the results. The median of the three values is used to represent the simulation result to avoid the extreme values in the simulation results. These simulation results are used to evaluate the sensitivity of ramp metering impacts or effectiveness to the studied parameters.
4. Results
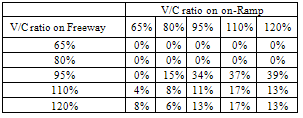
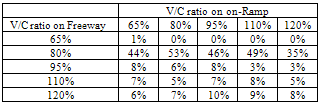
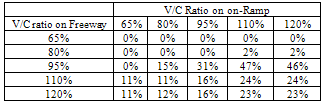
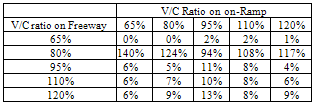
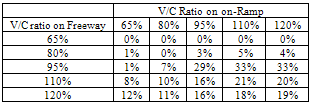
- Three MOEs are used in the evaluation of the results. Namely, travel time, speed and density on the freeway section. These MOEs will be determined for four cases:First, the impact of ramp metering on freeway MOEs with and without Ramp metering implementation; second, impacts of various detectors’ location on ramp metering effectiveness; third impact of various minimum green times on ramp metering effectiveness (all previous evaluations will be applied for all previous O-D demand levels and both DS conditions with and without bottleneck) and finally the application of ramp metering to the selected part of Emirates Road will be evaluated. This paper presents a sample of the results for stage 1, which shows the effect of implementing ramp metering to the freeway by comparing MOEs of travel time, speed and density on the freeway before and after ramp metering implementation for both DS conditions (with and without DS bottleneck) and with assumed demand levels. In all the following results, the percentages shown are relative to the case without ramp metering.Table 2 shows the travel time improvements for the implementation of the ramp metering, without a downstream bottleneck. It is clear that the ramp metering, with no bottleneck conditions, does not show significant improvements in travel time at low v/c ratios on the freeway. For v/c ratios close or over the capacity, there are some significant improvements in travel time, which are generally increasing when the v/c ratio on the ramp becomes higher.
|
|
|
|
|
|
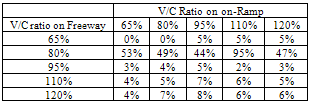
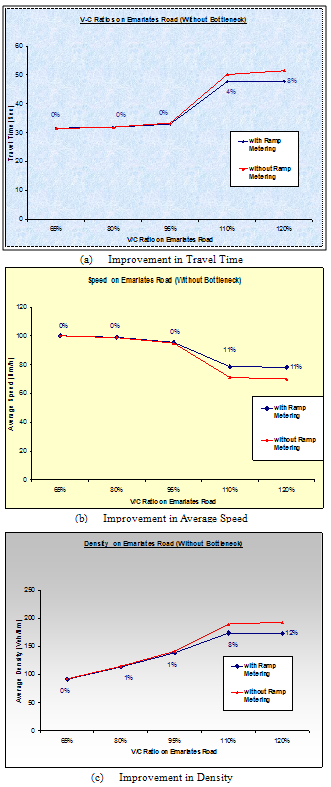 | Figure 2. Effect of Applying Ramp Metering to One Isolated Ramp without DS bottleneck |
5. Conclusions
- The main conclusions of this paper are:i. In case of free DS condition (without bottleneck), the result showed that Ramp metering is not sensitive to low demand 65%, 80% and 95% of freeway capacity (i.e. the volume is lower than the freeway capacity). Thus, the demand was too low to warrant metering. On the other hand, there were noticeable improvements in all MOEs for higher level of demands over capacity (110% and 120% of freeway capacity).ii.For the case of DS bottleneck, which reflecting the real world conditions, application of ramp metering shows early significant improvements in MOEs beyond capacity and noticeable improvements in all MOEs at and over capacity.
6. Future Work
- As mentioned before, the impacts of ramp metering implementation to freeway is addressed in this paper and all other remaining impacts are under testing and will be presented later, the other cases that are currently considered include: the impact of various detectors’ locations on ramp metering effectiveness, the impact of various minimum green times on ramp metering effectiveness and finally the impact of the application of ramp metering to the selected part of Emirates Road.
ACKNOWLEDGEMENTS
- The authors of this paper would like to acknowledge the partial support of the Faculty Research Grants(FRG) program at the American University of Sharjah (AUS).