-
Paper Information
- Paper Submission
-
Journal Information
- About This Journal
- Editorial Board
- Current Issue
- Archive
- Author Guidelines
- Contact Us
International Journal of Tumor Therapy
p-ISSN: 2163-2189 e-ISSN: 2163-2197
2018; 7(1): 1-26
doi:10.5923/j.ijtt.20180701.01

A Computational Assessment of the Robustness of Cancer Treatments with Respect to Immune Response Strength, Tumor Size and Resistance
 Abstract
 Reference
 Full-Text PDF
 Full-text HTML
Michael Fernandez 1, Mingyan Zhou 2, Luis Soto-Ortiz 3
1Department of Molecular and Cell Biology, University of California, Berkeley, USA
2Department of Mathematics, University of California, Los Angeles, USA
3Department of Mathematics, East Los Angeles College, Monterey Park, USA
Correspondence to: Luis Soto-Ortiz , Department of Mathematics, East Los Angeles College, Monterey Park, USA.
| Email: |  |
This work is licensed under the Creative Commons Attribution International License (CC BY).
http://creativecommons.org/licenses/by/4.0/

The emergence of bioengineering has paved the way for the in vitro design of immune cells that can detect and destroy tumor cells of low antigenicity. However, the results of clinical trials involving cancer treatments have not matched the success in the lab. A reason for treatment failure is the presence of patient-specific genetic biomarkers that affect long-term effectiveness. The cross-talk between multiple signaling pathways involved in tumor cell survival, the existence of redundant pathways with similar functions, and the intrinsic genetic instability of tumor cells also contribute to treatment failure. With the advent of novel cancer treatments, a need has arisen to undertake a computational approach to identify treatment combinations that maximize long-term effectiveness while minimizing the risk of serious side effects. In the present work, mathematical modeling was used to track the time-varying concentrations of pro- and anti-tumor cells and cytokines after a cancer treatment is administered. The simulations demonstrated the importance of treatment timing and frequency to achieve synergy. A combination therapy based on sunitinib and fresolimumab was found to be robust in reducing tumor size with respect to the strength of a patient’s anti-tumor immune response, the size of the tumor at the start of treatment, and with respect to mutations that can make cancer cells become refractory to the first-line treatment. The robustness of the identified sunitinib + fresolimumab combination therapy confers it with the capability to eliminate heterogeneous tumors made up of sensitive and resistant cells, in a patient whose anti-tumor immune response has become suppressed due to advanced age, chronic inflammation or a prior medical treatment. The model simulations highlight the superiority of combination therapy over monotherapy, and provide guidance to identify protocols that have the greatest potential to eliminate a tumor.
Keywords: Monoclonal antibody, Immunotherapy, Mathematical modeling, Angiogenesis, Robustness
Cite this paper: Michael Fernandez , Mingyan Zhou , Luis Soto-Ortiz , A Computational Assessment of the Robustness of Cancer Treatments with Respect to Immune Response Strength, Tumor Size and Resistance, International Journal of Tumor Therapy, Vol. 7 No. 1, 2018, pp. 1-26. doi: 10.5923/j.ijtt.20180701.01.
Article Outline
1. Introduction
- In spite of our increasingly deeper understanding of cancer biology, designing an effective treatment has proven difficult. Reasons for the shortcomings of cancer treatments include the complexity of the genetic entropy of the networks involved [1-3], the genetic differences between same-site cancer patients that determine their distinct sensitivities to the same type of therapy [4], the inability of cancer cells to repair DNA damage that increases their genetic instability and their resistance to treatment [5-7], and the risk of harmful side effects [8-11]. The therapeutic potential of various treatment modalities, as well as their shortcomings, will now be reviewed.
1.1. Chemotherapy
- Chemotherapy was one of the first cancer treatments to be widely adopted [12]. Chemotherapy seemed to be an ideal treatment for cancer, since cancer cells exhibit a high replication rate and chemotherapy drugs mainly disrupt the genetic networks of cells that replicate at a fast rate. Depending on the chemotherapy agent that is used, the mechanism of action may include the inhibition of topoisomerase I, leading to its inability to remove DNA supercoils that block cell replication, or the inhibition of topoisomerase II, leading to DNA breakage that remains unrepaired [13-15]. This results in the arrest of tumor cells at some stage of the cell cycle, leading to their eventual death. Chemotherapy has proven useful in reducing the growth rate of certain types of cancer. As an adjuvant therapy following surgery or radiotherapy, chemotherapy can eliminate most, if not all, remaining cancer cells as long as resistance does not develop. Since healthy cells also replicate, albeit at a lower rate, they are also susceptible to the same cytotoxic effects experienced by cancer cells due to the non-targeted mechanism of action of chemotherapy. This cytotoxicity on healthy somatic and immune cells is a key factor that limits the therapeutic effect of chemotherapy in a clinical setting. Another obstacle to a successful elimination of a tumor is the emergence of mutant tumor cells that are resistant to chemotherapy [16, 17]. Once mutant cells develop, they are able to escape the cytotoxic effect of chemotherapy, leading to treatment failure.
1.2. Monoclonal Antibody Therapy
- A more recent mode to treat cancer involves the application of humanized monoclonal antibodies (mAbs). Monoclonal antibodies originate from a single cell line and thus have the same molecular shape and function. They act like naturally produced antibodies and are engineered to attach with high affinity to specific molecular targets found in the membrane of cancer cells. Monoclonal antibodies can also bind to cytokines, blocking their pro-tumor activity. Examples of mAbs that have been used to treat cancer include bevacizumab, which targets the Vascular Endothelial Growth Factor (VEGF) [18, 19], fresolimumab, which targets the Tumor Growth Factor-beta (TGF-β) [20, 21], trastuzumab, cetuximab and panitumumab, all of which target the Epidermal Growth Factor (EGFR) and the Human Epidermal Growth Factor Receptor 2 (HER2) [22, 23] and vitaxin, which targets the alpha-v beta-3 (ανβ3) integrin found in endothelial cells [24, 25]. The tumor microenvironment is typically immunosuppressive and, consequently, attenuates the anti-tumor response of the innate, adaptive and humoral arms of the immune system, allowing the tumor cells to escape destruction. Monoclonal antibodies have been engineered to block the immunosuppressive activity of pro-tumor cells such as regulatory T cells, M2 macrophages, Th2 helper cells, and myeloid-derived suppressor cells (MDSC). Other mAbs are designed to disrupt signaling networks involving immunosuppressive cytokines such as VEGF, TGF-β, and IL-10. Monoclonal antibodies that reduce immunosuppression include sunitinib, which is a tyrosine kinase inhibitor that eliminates the immunosuppression caused by regulatory T cells (Treg cells) and by MDSC [26-28]. Due to the multi-faceted role of certain cytokines involved in tumor growth, treatments involving sunitinib, bevacizumab, trastuzumab, and cetuximab are able to disrupt signaling networks that simultaneously enhance tumor angiogenesis and immunosuppression.Therapies based on monoclonal antibodies have limitations that diminish their therapeutic impact. A disadvantage of this mode of treatment is the high manufacturing cost of antibodies [29, 30]. A second limitation is the fact that monoclonal antibodies are large molecules that tend to interact with receptors of healthy cells, keeping the antibodies from reaching the tumor site quickly and in large numbers. Their high affinity for the target molecule means that mAbs strongly bind to their target on the first encounter and fail to penetrate deep into the tumor [31]. Heterogeneous tumor vascularization also affects antibody penetration [32]. This limited penetration spares many malignant cells and reduces the effectiveness of mAb-based treatments. The problem of pharmacokinetics versus tissue penetration is typical of monoclonal antibodies and is a major drawback of this mode of treatment. Moreover, once mAbs are infused into a patient, resistance to mAb monotherapy usually emerges over time and/or intolerable side effects occur [33, 34]. The outcome of a mAb treatment also depends on the type of mutations that are already present in the tumor cells, or that develop during the course of treatment. For example, anti-EGFR treatments such as cetuximab and panitumumab are known to be ineffective if KRAS mutations are present in tumor cells [35, 36]. A combination of cetuximab and small molecule tyrosine kinase inhibitors (TKIs) can lead to an enhanced inhibition of EGFR autophosphorylation [37], increasing the effectiveness of this combination therapy. For some cancers, combining cetixumab or panitumumab with chemotherapy also appears to be a promising approach [38]. For example, the cytotoxicity of irinotecan chemotherapy is enhanced when it is combined with cetuximab or panitumumab through a chemosensitization of tumor cells [39]. However, due to the emergence of resistance to irinotecan, cetuximab and panitumumab [40-43], the therapeutic effect of a combination therapy that involves these drugs is limited.
1.3. Therapy that Boosts the Immune Response
- A third category of anti-cancer treatments includes approaches that boost the anti-tumor immune response and increase the antigenicity of the tumor. Molecule-based treatments involve the injection of tumor cell antigens or of toll-like receptor (TLR) agonists. TLR agonists strengthen immune-cell functions by enhancing antigen-presentation of dendritic cells (DC) [44], by steering the polarization of macrophages into M1 macrophages [45], and the polarization of naïve CD4+ T cells into Th1 helper cells [46]. Cytokine-based treatments that have been shown to be successful in boosting the anti-tumor immune response involve the injection of anti-tumor interleukins (IL-2 and IL-12) or interferons (IFN-α, IFN-β) [47-50], which activate CD8+ cytotoxic T lymphocytes (CTL), natural killer (NK) cells, and macrophages, and promote their expansion and anti-tumor activity. Cell-based therapies aimed at boosting the cytotoxic immune response involve the extraction of live CTL or NK cells from the patient, expanding them and priming them in vitro to make them more reactive to tumor antigens. An enhanced sensitivity by immune cells can be achieved by exposing them in vitro to IL-2 and to antigenic molecules found in the membrane of cancer cells. The CTL or NK cells are then infused back into the patient via an intravenous injection or directly into the tumor site. This type of treatment is known as adoptive cell transfer (ACT) [51-54]. The infused immune cells are capable of sensing and penetrating the tumor, enhancing their tumor-targeted cytotoxic activity. When tumor cells are of a very low antigenicity such that no tumor antigens are present in their membrane, adoptive immune cells can be genetically engineered in vitro to express chimeric antigen receptors (CARs) [55] that allow them to detect specific proteins found in the membrane of cancer cells. Once activated and expanded, the engineered immune cells are reintroduced into the patient and a strong tumor-targeted immune reaction occurs [56, 57]. In a clinical setting, adoptive cell transfer has been moderately successful for a limited number of cancer types. Regardless of whether adoptive cell transfer involves CTL cells, NK cells or dendritic cells, once these cells are infused into the patient and reach the solid tumor site, they experience a strongly immunosuppressive tumor microenvironment and become anergic or develop a pro-tumor phenotype over time. The result is a short-lived anti-tumor immune reaction that eventually becomes ineffective at arresting tumor growth. To counteract the effect of immunosuppression, a mAb treatment that targets TGF-β, VEGF, or IL-10, or that targets Treg cells directly can be administered before adoptive cell therapy is given. Experimental work shows that administering chemotherapy to reduce immunosuppression before giving ACT is beneficial [58-60]. In adoptive cell transfer, chemotherapy can also be given with the purpose of depleting CD8+ T lymphocytes before infusing NK cells. This lymphodepletion reduces the competition between the infused cells and the anergic lymphocytes for survival and growth signals from anti-tumor interleukins. Infused T cells known as TRUCKs have been engineered to express a 4th generation CAR which allows them to deliver a payload that can modify the tumor microenvironment [61]. TRUCKs are currently being engineered to help reduce the typically immunosuppressive microenvironment of solid tumors [62, 63].
1.4. A Tumor is a Complex Robust System
- The limited success of cancer treatments can be attributed to the fact that a tumor is a robust biological system that is able to perform its proliferative function in spite of attempts to eliminate it. In this article, robustness is defined in the same way that Hiroaki Kitano defined it: “Robustness is a property that allows a system to maintain its functions against internal and external perturbations.” [64] The study of cancer biology makes it clear that cancer is a disease governed by complex biological networks [65]. The inherent complexity and redundancy of the network connectivity makes cancer growth robust against internal and external perturbations (hypoxia, limited metabolic processes, cancer treatments, etc.). Through the stimulation of angiogenesis, a tumor adapts to a shortage of nutrients and continues to grow successfully after it reaches the diffusion-limited size of 1 million cells, or approximately 1 mm in radius [66]. Through up-regulation of glycolytic processes, a growing tumor successfully bypasses the slow production, through normal metabolic processes, of the required building-block molecules. To effectively disrupt the growth dynamics of such a robust biological system, a therapy that is robust in its own right with respect to changes in tumor cell characteristics and to the level of a patient’s immune system response, is required. A mounting set of evidence obtained from experimental work and clinical trials seems to suggest that a combination therapy has the potential to be more robust than monotherapy alone against the changing characteristics of a tumor and its microenvironment. In this regard, mathematical modeling can help to assess and quantify the robustness, or lack thereof, of current therapies. Computational work can also help to identify ways to maximize the robustness of a combination therapy by achieving synergism between its components through proper dose selection and timing.
1.5. Previous Mathematical Models
- Previous models of tumor growth have simulated tumor angiogenesis [67-71], the interaction between tumor cells and the immune system [72-74], immunosuppression [75, 76], combination therapy [77-79], and the emergence of resistance to treatment [80-82]. However, models of tumor growth have not simulated a diverse set of treatments, and those that did left out important processes such as angiogenesis, immunosuppression and/or treatment resistance. The present model aims to provide a more comprehensive analysis of a diverse set of therapies while considering key biological processes that influence tumor growth. The parameter sensitivity analyses of previous models have shown that initial tumor size, the maximal tumor growth rate, tumor antigenicity and immune cell cytotoxicity on tumor cells are the main factors that influence treatment success [83-85]. These results motivated the authors to investigate whether combining certain types of treatment leads to a synergistic effect that makes the combination therapy robust in reducing tumor size, with respect to the strength of a patient’s anti-tumor immune response, tumor size at the start of treatment, and the emergence of resistance to treatment.
2. Materials and Methods
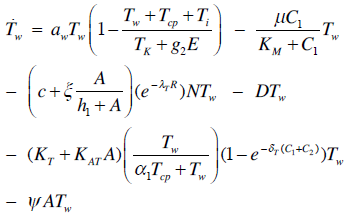
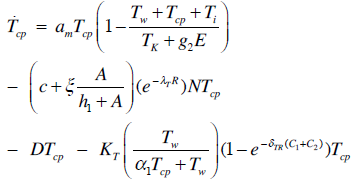
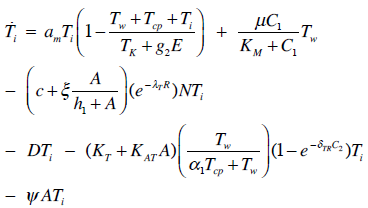
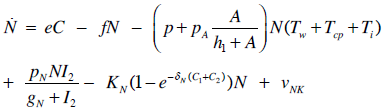
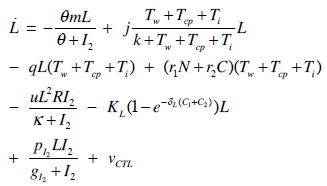
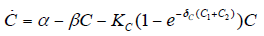
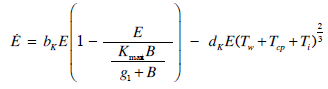
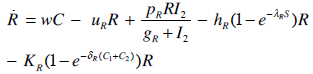
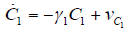
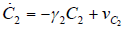
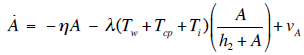
- Our model builds upon the work of [86] and [87]. De Pillis et al. developed a validated model of colorectal cancer consisting of ordinary differential equations (ODE) that considers multiple immune cell types (CD8+ T cells, NK cells and circulating CD4+ T lymphocytes). In their work, they considered chemotherapy (irinotecan) and monoclonal antibodies (cetuximab and panitumumab) as anti-tumor treatments. They investigated the effect of the level of strength of the anti-tumor immune response on the effectiveness of monotherapy and combination therapy in reducing tumor growth. They also simulated experimental dosing schedules that reduced tumor size more effectively than standard protocols. However, key processes that were not included in their model of colorectal cancer are tumor angiogenesis, immunosuppression due to Treg cells and tumor-secreted cytokines, and the emergence of treatment resistance. To simulate the effect of resistance to treatment, the model in [87] assumed the presence of KRAS-mutant tumor cells prior to treatment. A KRAS mutation eliminates the chemosensitization of tumor cells to irinotecan chemotherapy caused by the injection of cetuximab and panitumumab, and eliminates tumor death caused by direct interaction with the injected mAbs. Their model, however, did not consider tumor vasculature or the immunosuppressive effect of pro-tumor cells and cytokines.The model expands the work of [86] and [87] by including an angiogenic switch characterized by a dynamic tumor carrying capacity that depends on TGF-β secreted by tumor cells. The TGF-β concentration profile follows a Hill function, as was done in [88]. The model includes ordinary differential equations (ODE) describing the change in the concentration of activated (angiogenic) endothelial cells, immunosuppression by Treg cells [89] and TGF-β [90], and the dynamics of additional anti-tumor treatment drugs.The model simulates the dynamics of wild-type tumor cells Tw that are sensitive to all the simulated treatments, KRAS-mutant cells Tcp that are resistant to cetuximab and panitumumab, and irinotecan-resistant cells Ti. The model also includes ODE equations representing the dynamics of NK cells (N), CD8+ T cells (L), Treg cells (R), circulating CD4+ lymphocytes (C), activated endothelial cells (E), IL-2 (I2), TGF-β (B) and the anti-cancer drugs irinotecan (C1), cetuximab and panitumumab (A), sunitinib (S), fresolimumab (F) and a hypothetical chemotherapy drug (C2). The model equations were coded in the open-source numerical computation software Scilab (http://www.scilab.org/) and were solved in Scilab using a built-in 4th-order explicit Runge-Kutta method with fixed step size. This numerical method is efficient, guarantees a stable computation time and has total error O(h4). Currently, there is not sufficient experimental data to fully parameterize the model with values corresponding to a particular type of cancer. Many parameter values were obtained directly from published models of colorectal cancer, renal cell carcinoma, melanoma and lymphoma. Other parameter values were assumed to be equal to published values for various human cancers.The following cancer treatments were introduced as inputs to the system to identify the key biological mechanisms and processes that a successful combination therapy should target: 1. chemotherapy (irinotecan) that kills wild-type tumor cells Tw, KRAS-mutant cells Tcp and immune cells, but cannot kill irinotecan-resistant cells Ti, 2. a hypothetical chemotherapy drug that does not lead to resistance and can kill wild-type tumor cells Tw and mutant cells (Tcp and Ti), but that has the same cytotoxic effects on immune cells as irinotecan chemotherapy. This drug was assumed to have the same dosage, infusion time and injection frequency as irinotecan,3. two mAbs (cetuximab and panitumumab) that kill wild-type tumor cells Tw directly and enhance tumor cytotoxicity of NK cells, but also lead to increased NK cell death, cannot kill KRAS-mutants Tcp directly, and have no chemosensitization effect on irinotecan-resistant cells Ti, 4. a receptor tyrosine kinase inhibitor (sunitinib) that neutralizes the immunosuppressive effect of Treg cells, 5. an anti-angiogenic mAb (fresolimumab) that targets all TGF- β isomers, and6. adoptive cell transfer of NK cells and CTL.To generate protocols that are biologically feasible, and that minimize the potential of a patient experiencing life-threatening side effects, published treatment protocols that have been deemed safe were followed. Attention was paid to the safety of the selected dose, frequency, and time required to administer an intravenous injection. For each treatment considered, a positive term representing the rate of drug or cell infusion was introduced in the corresponding ODE to simulate an increase in the concentration of the injected agent in the tumor site.Equations 1 – 16 define the model of tumor growth that was used to assess the robustness of anti-cancer treatments with respect to the strength of the anti-tumor immune response, with respect to the tumor size at the start of treatment, and with respect to resistance to irinotecan, cetuximab and panitumumab therapies.
 | (1) |
 | (2) |
 | (3) |
 | (4) |
 | (5) |
 | (6) |
 | (7) |
 | (8) |
 | (9) |
 | (10) |
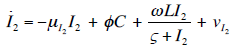 | (11) |
 | (12) |
 | (13) |
 | (14) |
 | (15) |
 | (16) |
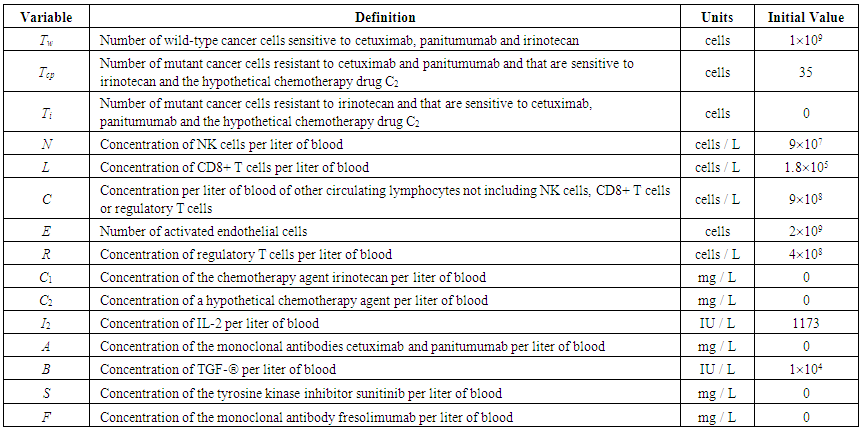 | Table 1. Model Variables and their Initial Values |
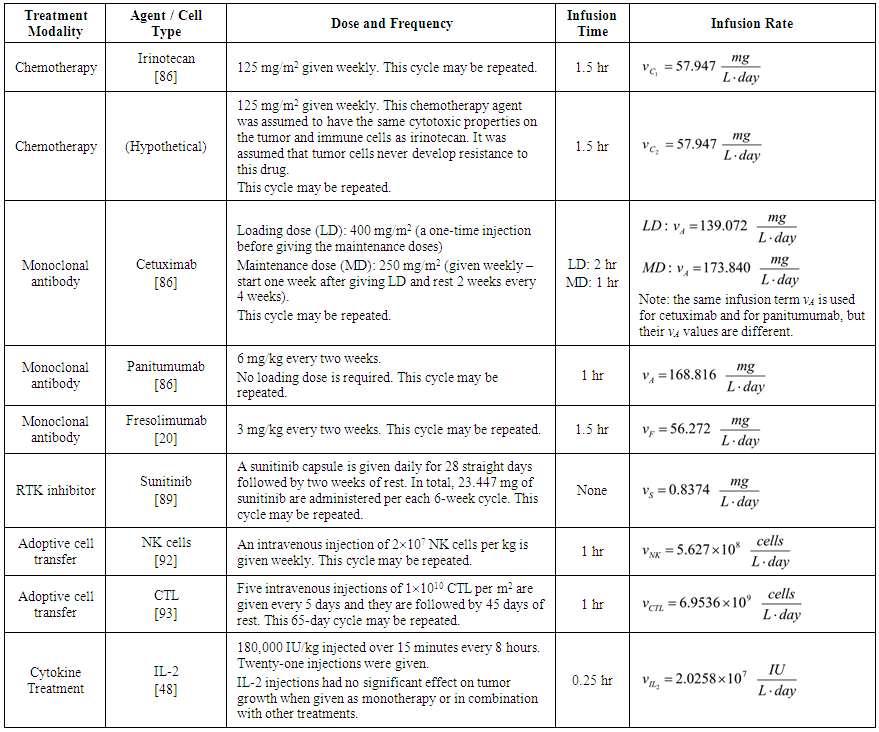 | Table 2. Treatment Dose and Frequency |
 and anti-TGF-
 were converted from mg/L to IU/L, and vice versa, by referring to the published specific activity of TGF-
 . An example of how to perform this conversion can be found in [94].The parameters d, l and s together determine the level of strength of a patient’s immune system response D, as defined by equation 15. The values of these parameters are taken from the sets
 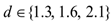 ,
,  and
and 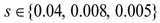 . A strong immune response (Ds) corresponds to the combination of values
 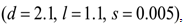 a moderate response (Dm) corresponds to the values
 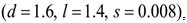 and a weak response (Dw) is characterized by the values
  . These levels of immune strength are the same as those that were considered in [86].The anti-cancer treatments listed in Table 2, as well as certain combinations of them, were assessed for their robustness with respect to the three levels of immune strength Ds, Dm, and Dw. To assess the robustness of a treatment with respect to tumor size, initial tumor sizes of up to 109 cells were considered. Robustness with respect to resistance to therapy was assessed by comparing two cases: 1) a case where wild-type tumor cells cannot become resistant to any treatment and there are no mutant cells present at the start of treatment, and 2) a case where there are 35 KRAS-mutant tumor cells initially present, and there are no irinotecan-resistant cells present, but irinotecan resistance emerges in an irinotecan dose-dependent manner. The emergence of irinotecan resistance is represented by the term
 that appears in equations 1 and 3.Cancer therapy tends to have side effects that must be kept into consideration when designing a treatment protocol. Chemotherapy has the undesirable effect of killing a significant number of immune cells. Cetuximab and panitumumab lead to NK cell death due to their interaction with mAb-tumor complexes. To ensure the safety in the clinic of all the simulated treatments that led to a significant reduction in tumor size, the criteria for minimum circulating lymphocyte concentration of
  lymphocytes per liter set by the World Health Organization (WHO) [95] was enforced. Depending on the effectiveness of a particular treatment, the predicted outcome was the elimination of the tumor, reduced or arrested growth, or continued growth. In all the simulations, a complete response (CR) to a cancer treatment was defined as a tumor size at the end of the treatment period that is less than or equal to the diffusion-limited value of
  tumor cells. Hence, a complete response is characterized by a reduction in tumor size below the threshold that would trigger the angiogenic switch. A partial response (PR) to treatment is described by a tumor that remains larger than
  cells, but that by the end of the treatment period is smaller than at the start of treatment. The no response (NR) classification applies when tumor size remains the same, or becomes larger than it was at the start of treatment, by the time the treatment period ends. A cancer treatment that leads to a complete response (CR) at the three levels of immune response strength D, for tumor sizes of up to 109 cells at the start of treatment, does not lead to the emergence of treatment resistance and is effective in spite of resistant cells being present, and that meets the minimum lymphocyte concentration criteria for safety of at least
  circulating lymphocytes per liter throughout the treatment period, is defined as being robust with respect to the above perturbations. This is the definition of robustness of an anti-cancer treatment that was considered in the computational analysis presented in the next section.
3. Results
- The results presented in Section 3.1.1 show that without angiogenesis and no immune system action, the tumor remains avascular and can only grow to its diffusion-limited size of 1 million cells. Through secretion of TGF-β that activates endothelial cells, tumor cells elicit angiogenesis, which increases the carrying capacity of the tumor. Section 3.1.2 discusses the predicted tumor growth with angiogenesis for three distinct levels of immune response strength for initial tumor sizes up to 109 cells. The simulations predict that if the tumor is smaller than a therapeutic size threshold that depends on the level of immune strength, the immune system alone will be able to eliminate the tumor. The robustness, or lack thereof, of various anti-cancer treatments is discussed in Section 3.2, with the assumption that wild-type tumor cells never mutate to become resistant to therapy and that there are no mutant tumor cells present before treatment begins. Section 3.3 describes a combination therapy that was found to be robust with respect to immune system strength, initial tumor size and treatment resistance. Lastly, Section 3.4 presents the results of the sensitivity analysis that was performed on the model parameters.
3.1. No Treatment Administration
3.1.1. No Immune System Action
- Figure 1A shows that in the absence of an active immune system and no anti-cancer treatment, a tumor that is unable to undergo an angiogenic switch will remain at the diffusion-limited size of 1 million cells. A tumor with an initial size of less than a million cells will not grow beyond this asymptotic size and will remain avascular, posing little risk of metastasis. Figure 1B shows that a tumor that is larger than 1 million cells will shrink the diffusion-limited size due to cell death, if it is unable to release cytokines that activate endothelial cells to start the process of angiogenesis.
 | Figure 1. Tumor growth without angiogenesis and no immune system action. A) In the absence of angiogenesis, no immune system action, and no treatment, a small tumor is able to grow up to the diffusion-limited size of 1 million cells. B) A tumor larger than 1 million cells will shrink to the diffusion-limited size due to cell death cause by an insufficient flow of nutrients into the tumor |
 EC. It was also assumed that each endothelial cell that becomes activated increases the tumor carrying capacity by 1 tumor cell. Hence, an angiogenic switch allows a simulated tumor to increase its carrying capacity by up to
  tumor cells.
 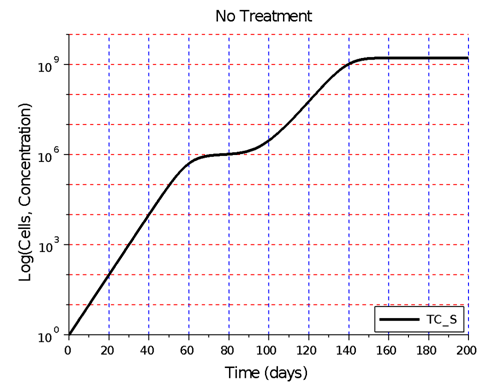 | Figure 2. Hypothetical angiogenic switch driven by TGF-β secretion. In this simulation, undergoing an angiogenic switch allowed the tumor to attain the asymptotic size of  cells on day 200. The figure illustrates a tumor dormancy of approximately one week. The dormancy period may be longer or may be nonexistent, depending on the environmental conditions and the type of tumor cells on day 200. The figure illustrates a tumor dormancy of approximately one week. The dormancy period may be longer or may be nonexistent, depending on the environmental conditions and the type of tumor |
3.1.2. Immune System Action
- The effect of the immune system on the growth of an angiogenic tumor depends on the antigenicity of the tumor and the strength of the immune response. The model simulations show that for each level of immune strength there exists a therapeutic tumor size threshold value below which an immune system of a particular strength will be able to eliminate the tumor. Figure 3A shows the effect of a strong immune response Ds on tumor growth in the presence of immunosuppression and the absence of treatment. In this case, a tumor of size up to
 cells will be eliminated without the need for treatment. This outcome represents the ideal case, where a body’s own defenses eliminate an infection without the need for medical intervention. The decrease in the number of activated endothelial cells (EC), shown in all the figures as a thick black line, is due to a decrease in TGF-β secreted by tumor cells. As immune cells continue to kill tumor cells, the concentration of TGF-β decreases, leading to endothelial cell deactivation and a decrease in the carrying capacity of activated ECs and of tumor cells. The thin black line represents the actual number of tumor cells over time.The therapeutic tumor size threshold corresponding to a moderate strength Dm is predicted to be approximately
  cells. Figure 3B shows that if a tumor has a size that is above this threshold, a compromised immune system capable of only a moderate anti-tumor response will not be able to arrest tumor growth. The tumor will eventually attain a size equal to its dynamic carrying capacity. This escape from immunodestruction by the tumor is due to a tip of the balance between the strength of the anti-tumor immune response and immunosuppression exerted by Treg cells in favor of immunosuppression. Figure 3C illustrates the prediction that if the immune response is weak (Dw), only tumors that have a size equal to or smaller than the diffusion-limited size of 1 million cells will be destroyed by the immune system. Hence, in the absence of treatment, an immune system that exhibits a weak anti-tumor response can only eliminate avascular tumors.
 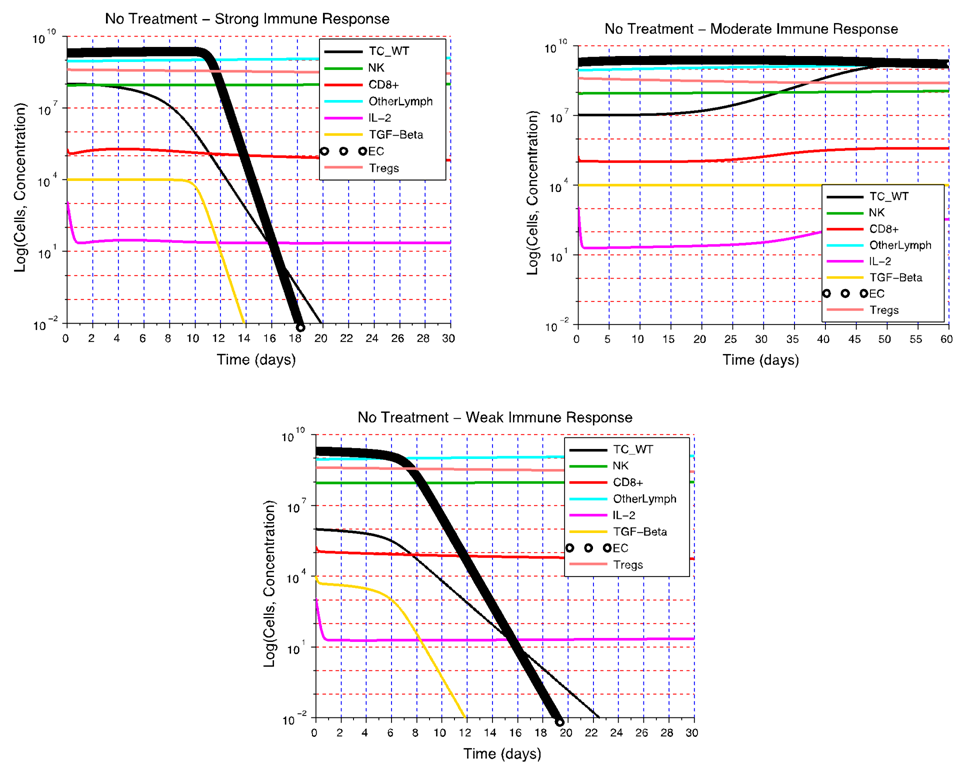 | Figure 3. Tumor growth for different levels of immune strength D without treatment. A) In the presence of immunosuppression and the absence of treatment, a strong immune response Ds is able to eliminate a tumor consisting of up to  cells. B) Without treatment, a moderate immune response Dm is not able to eliminate a tumor that is larger than cells. B) Without treatment, a moderate immune response Dm is not able to eliminate a tumor that is larger than  cells. C) If the immune response is weak (Dw), only non-vascularized tumors consisting of less than 1 million cells will be eliminated in the absence of treatment cells. C) If the immune response is weak (Dw), only non-vascularized tumors consisting of less than 1 million cells will be eliminated in the absence of treatment |
3.2. Treatment Administration without Resistance
3.2.1. No Immune System Action
- The potential of a treatment to eradicate a tumor in the absence of an immune response, and without resistance to treatment was investigated next. To simulate this scenario, the anti-tumor effect of NK cells, CD8+ T cells and circulating lymphocytes, the immunosuppressive activity of Treg cells and the mutation rate of wild-type tumor cells were all turned off. However, the potential of a tumor to undergo an angiogenic switch through release of TGF-β, resulting in activation of endothelial cells, was left intact. To eliminate the case of KRAS-mutants being present at the start of treatment, the initial number of KRAS-mutants was set to zero. To exclude the dose-dependent emergence of irinotecan-resistant cells, the parameter μ was set to zero. Initial tumor sizes up to 109 cells were considered. None of the monotherapies listed in Table 2, or their combinations, led to a complete response (CR) or a partial response (PR) when an anti-tumor immune response was absent. These results hint at the important role of the immune system in helping to destroy cancer cells that remain after a first-line therapy decreases tumor size below the corresponding therapeutic threshold. A natural anti-tumor immune response obviates the need to increase the dose or frequency of a first-line therapy, reducing the potential of harmful side effects that could result if a treatment were to be given for an extended period of time.
3.2.2. Immune System Action
- To assess the robustness of a treatment with respect to the level of immune strength and the size of the tumor at the start of the treatment, the best-case scenario for tumor treatment was first considered: a strong immune response Ds. The combination therapies that were simulated using the model are listed in Supplementary Table 2 in the Appendix. The only protocol that met the criteria for robustness and that was classified as being robust with respect to the level of immune strength and initial tumor size was the sunitinib + fresolimumab combination therapy. Sunitinib reduces immunosuppression by reducing the concentration of Treg cells in patients, while fresolimumab blocks the angiogenic effect of TGF-β, thus reducing the dynamic carrying capacity of tumor cells. Based on model simulations, these two drugs were ineffective in reducing tumor growth when given as monotherapy if the strength of the immune response was weak. On the other hand, giving these two treatments concurrently led to a synergy that made this combination treatment robust with respect to the three levels of D and with respect to tumor size at the start of treatment. Figure 4 illustrates the failure of sunitinib and fresolimumab monotherapies and the success of sunitinib + fresolimumab combination therapy for immune response strength Dw with an initial tumor size of 109 cells.When sunitinib is given as monotherapy in a clinical setting, patients undergo an average of 5 cycles of sunitinib capsule intake (28 capsules per cycle). The therapeutic effect of combination therapy illustrated in Figure 4C suggests that at most two cycles of sunitinib may be necessary to eliminate the tumor when combined with 3 biweekly injections of fresolimumab. This particular combinatorial approach to treat cancer has the potential to reduce the cost of treatment and is safe, since neither drug has a cytotoxic effect on immune cells. This is in contrast to chemotherapy, which tends to kill CD8+ T cells and NK cells.
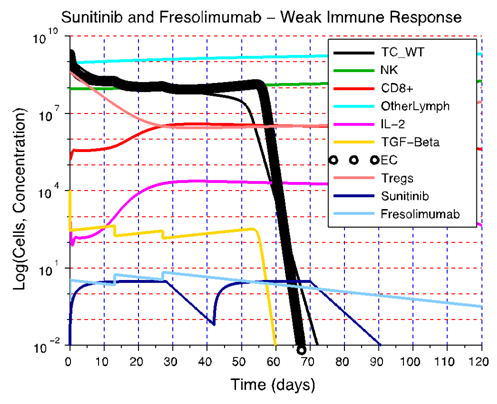 | Figure 4. A synergistic effect of sunitinib and fresolimumab leads to robustness with respect to immune strength D and to initial tumor size. A) The immune strength is so weak that a significant reduction of Treg cell concentration is not sufficient to boost the immune response enough to be able to take over and eliminate the tumor. B) By neutralizing TGF-β and reducing its concentration, fresolimumab monotherapy reduces tumor size below the initial size of 109 cells. However, the immune strength is weak and the concentration of Treg cells is high. In this case, it is not possible for the immune system to capitalize on the reduction in tumor size achieved through administration of fresolimumab. C) A reduction in tumor size by fresolimumab, combined with a decrease in the immunosuppressive effect of Treg cells due to sunitinib action, leads to synergy and complete tumor destruction even when the anti-tumor immune strength is weak |
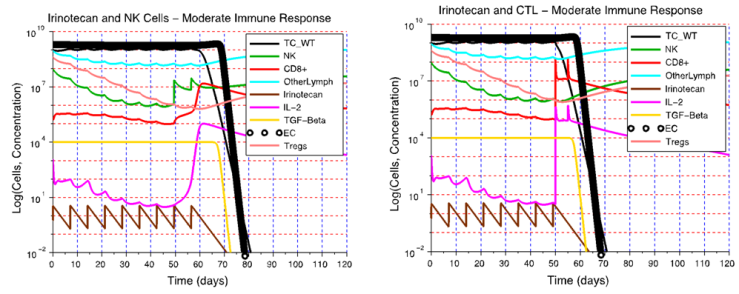 | Figure 5. Tumor elimination through an I+NK cell treatment and an I+CTL treatment at the Dm immune response level. A) A weekly NK cell treatment started on day 49 restores the NK cell activity that had been attenuated by chemotherapy. A high NK cell concentration together with a low Treg cell concentration leads to tumor eradication. B) Irinotecan chemotherapy reduces immunosuppression to a point that CTL therapy is successful if it is started after day 50. In I+CTL treatment, the concentration of CTL increases significantly after CTL injections are given, while the concentrations of NK cells and Treg cells remain low. The strong CTL activity eliminates the tumor in spite of the decrease in NK cell activity caused by the chemotherapy. The default parameter values for cetuximab were used to simulate the I+NK cell and I+CTL therapies |
3.3. Treatment Resistance
- The presence or emergence of mutant cells resistant to cetuximab, panitumumab or irinotecan may explain why combination treatments that involve these drugs fail to eliminate a tumor in a clinical setting. In the irinotecan + panitumumab combination therapy shown in Figure 6, irinotecan is given weekly and panitumumab biweekly. Continuing to give this combination treatment for several months leads to the elimination of irinotecan-resistant cells through the action of panitimumab, while the wild-type cells are eliminated by the enhanced cytotoxic effect of irinotecan + panitumumab. However, the KRAS mutants ultimately survive because they do not experience the enhanced cytotoxic effect of irinotecan + panitumumab. At steady state, the tumor will consist of approximately
 panitumumab-resistant cells, leading to treatment failure.
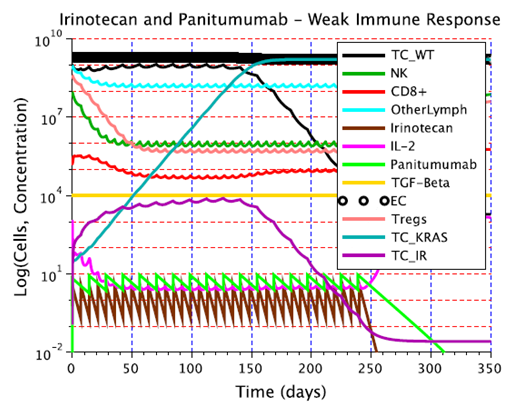 | Figure 6. The emergence of resistance to irinotecan + panitumumab combination therapy. This combination therapy is unable to kill the KRAS mutants, which are resistant to panitumumab. Consequently, the KRAS mutants continue to grow to their carrying capacity. This simulation assumed a weak immune response Dw, and an initial population of 109 wild-type tumor cells. The parameter values corresponding to panitumumab were used in this simulation |
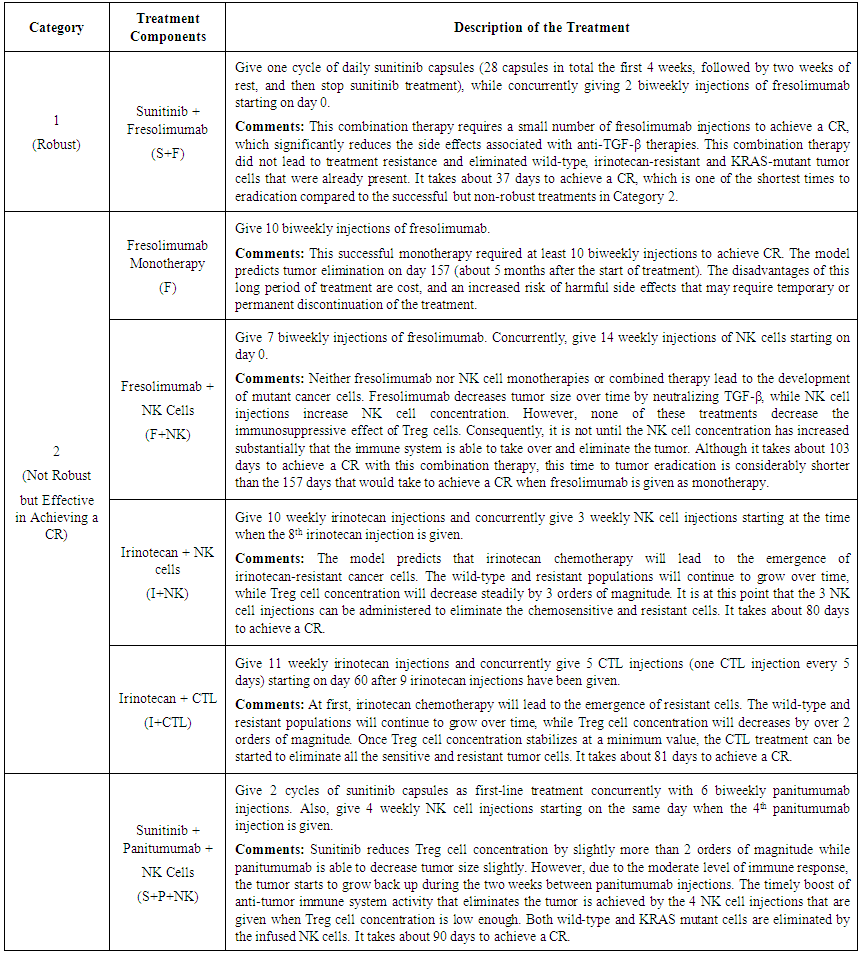 | Table 3. Description of Robust and Effective Treatments |
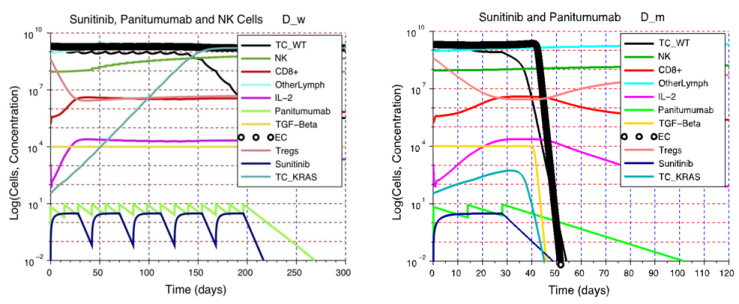 | Figure 7. The importance of the immune response strength D on treatment outcome. A) Although NK cell activity increases after the adoptive cell transfer, while immunosuppression is decreased by the sunitinib injections, these simultaneous changes in immunosuppression and NK cell activity are not sufficient to eliminate the tumor. The end result is a heterogeneous tumor consisting of wild-type tumor cells and KRAS mutants that is more difficult to treat. This example illustrates the need to design patient-specific treatments that take into account, and can address, the deficiencies in a patient’s immune system status. B) A patient with an immune system capable of a moderate response can benefit from a single cycle of sunitinib + panitumumab. The wild-type and KRAS mutant tumor cells are eliminated due to the moderate strength of the anti-tumor response combined with the synergistic effect of sunitinib + panitumumab |
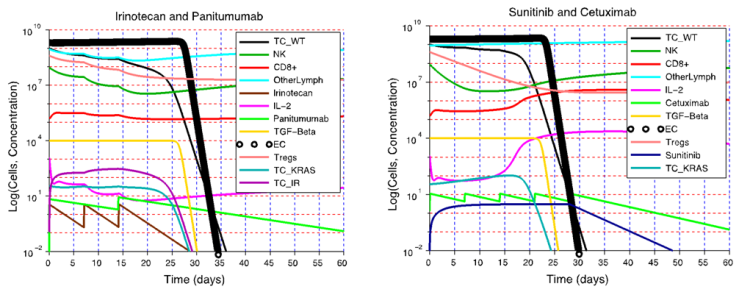 | Figure 8. A strong immune response can lead to elimination of resistant tumor cells. A) KRAS-mutant and irinotecan-resistant tumor cells remain vulnerable to immunodestruction if tumor cell antigenicity is high enough and the immune system is capable of a strong response. B) A sunitinib + cetuximab combination therapy is also likely to be therapeutic, leading to the destruction of wild-type and mutant tumor cells. Of note is the fact that in both treatment simulations, a strong immune response reduced the number of injections and sunitinib capsule intake required to eliminate the tumor |
3.4. Sensitivity Analysis of the Model Parameters
- We performed a sensitivity analysis of the model parameters to identify the parameter(s) that have the greatest influence on the predicted system dynamics. We followed the standard procedure of increasing and decreasing the value of each parameter listed in Table 4 by some percent while leaving all other parameters constant at the values shown in Supplementary Table 1. The case of no treatment with a moderate immune response and initial tumor size of 108 cells was considered. All other initial conditions were left the same as in Table 1. We computed the resulting percent change in the number of tumor cells at steady state (on day 250) after each parameter was increased and decreased by 5%.
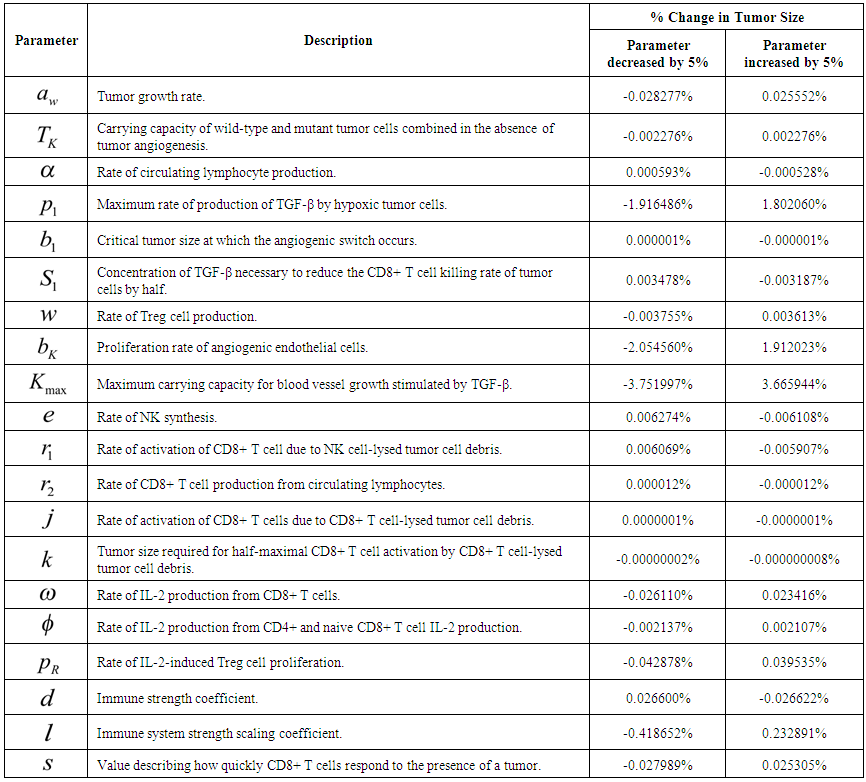 | Table 4. Sensitivity of Final Tumor Size to a 5% Change to Parameter Values |
4. Conclusions
- The model simulations presented in this article illustrated the importance of treatment timing and the strength of the anti-tumor immune response in determining the outcome of a treatment. The model analysis helped to identify treatment modalities that are most likely to synergize when given in combination. In particular, a combination of sunitinib and fresolimumab was predicted to be robust with respect to changes in the strength of the immune response, the tumor size at the start of treatment, and with respect to tumor resistance to cetuximab, panitumumab and irinotecan. This prediction suggests that an effective cancer treatment will be one that can disrupt the biological mechanisms that are responsible for tumor angiogenesis and immunosuppression, which could maximize the therapeutic effect of adoptive cell transfer. In the future, additional cell types and cytokines will be incorporated into the model to take into account the positive feedback loops that lead to anti-tumor and pro-tumor immune cell differentiation and that reinforce pro-tumor and anti-tumor cell phenotypes. The robustness of a cancer treatment with respect to changes in tumor growth rate and antigenicity may depend on the organ in which a cancer develops. Therefore, parameterization of the model with values that are characteristic of a particular cancer type will help to identify the treatment protocols that have the greatest potential to eliminate a specific type of cancer safely and efficiently.This research did not receive any specific grant from funding agencies in the public, commercial, or not-for-profit sectors.
Appendix
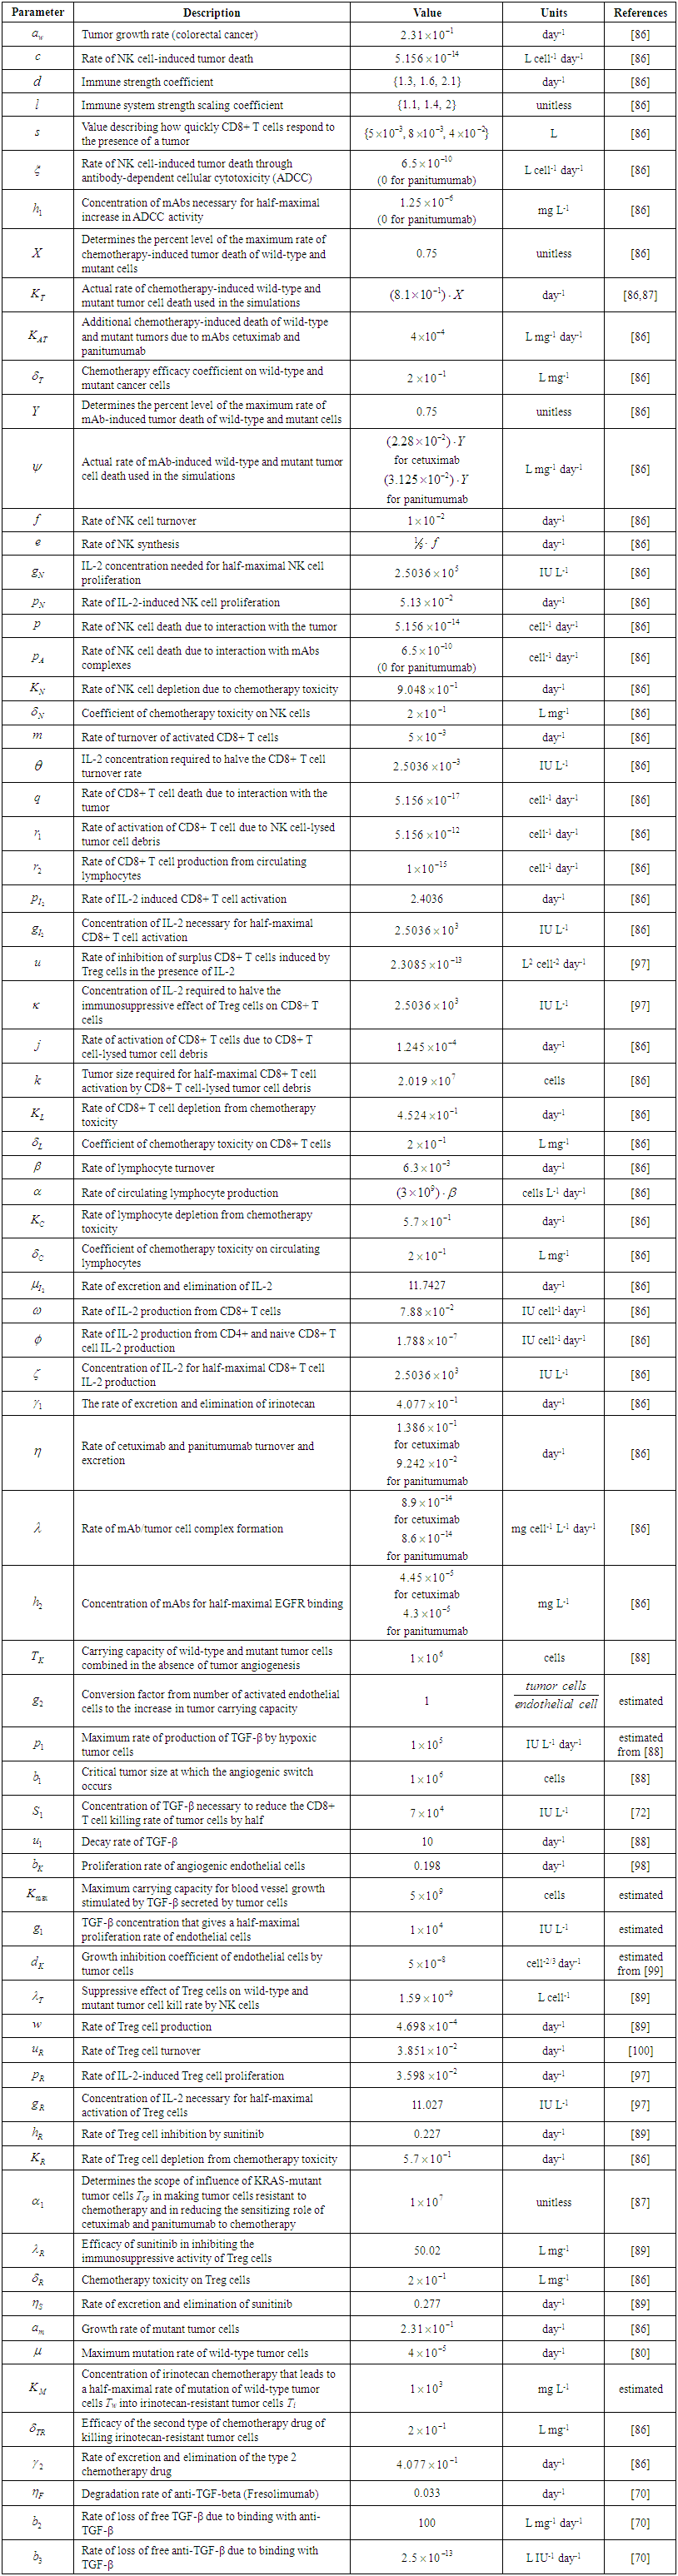 | Supplementary Table 1. Parameters of the Model |
 I = IrinotecanC = CetuximabP = PanitumumabS = SunitinibF = FresolimumabNK = Natural killer cellsCTL = Cytotoxic T lymphocytes C2 = Hypothetical chemotherapy drug
 CR = Complete response: a tumor size at the end of the treatment period that is less than or equal to the diffusion-limited value of 1106 tumor cells.PR = Partial response: a tumor that remains larger than 1106 cells, but that by the end of the treatment period is smaller than at the start of treatment.NR = No response: the tumor size remains the same, or becomes larger than it was at the start of treatment, by the time the treatment period ends.
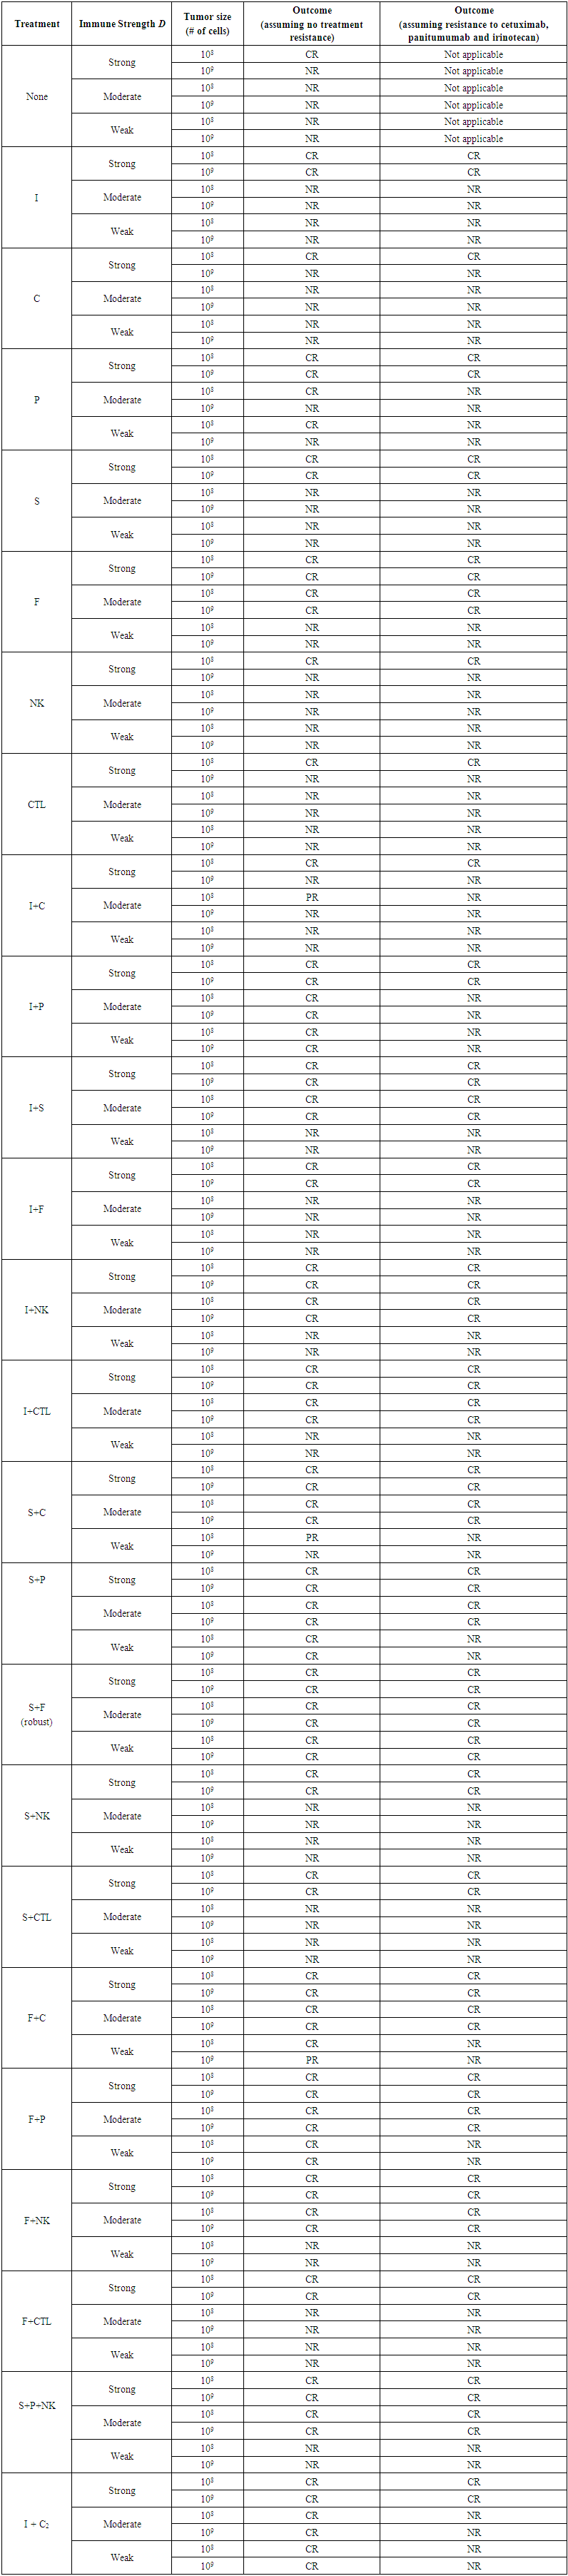 | Supplementary Table 2. Simulated Treatments and their Outcomes |