-
Paper Information
- Paper Submission
-
Journal Information
- About This Journal
- Editorial Board
- Current Issue
- Archive
- Author Guidelines
- Contact Us
International Journal of Tumor Therapy
p-ISSN: 2163-2189 e-ISSN: 2163-2197
2017; 6(1): 5-14
doi:10.5923/j.ijtt.20170601.02

Study of Centrosome-associated Kinase Aurora A Gene Expression as a Molecular Marker and OPN, CA242 and CA19.9 as a Tumor Markers in Diagnosis of Colorectal Carcinoma
 Abstract
 Reference
 Full-Text PDF
 Full-text HTML
Dalal M. Nemenqani1, 2, Eman M. I. Youssef3, 4, Wael F. Sedik4, 5, Awatif Elmohamady Edreis6, 7, Fatma Saffeyeldin Mohamed8, Fatma Oraby4, 9, Amal A. Soliman10, 11, Rehab M. Elsaid Tash12, Marwa M. Hassan13, Mona El-Fedawy El-Saied13, Walid S. H. Elsaied14, 15, Hala M. Nageb13
1Department of Pathology and Cytopathology, College of Medicine, Taif University, KSA
2Head of Laboratory & Blood Bank, KAASH, Taif, KSA
3Department of Medical Biochemistry, Faculty of Medicine (for girls), Al-Azhar University, Cairo, Egypt
4Department of Medical Biochemistry, College of Medicine, Taif University, KSA
5Department of Medical Biochemistry, Faculty of Medicine, Minia University, Egypt
6Department of Tropical Medicine, Faculty of Medicine, Tanta University, Cairo, Egypt
7Department of Internal Medicine, College of Medicine, Taif University, KSA
8Department of Tropical Medicine, Faculty of Medicine (for girls), Al-Azhar University, Cairo, Egypt
9Department of Medical Biochemistry, National Research Center, Cairo, Egypt
10Department of Clinical Pathology, Faculty of Medicine, Menoufyia University, Egypt
11Department of Clinical Pathology, College of Medicine, Taif University, KSA
12Department of Medical Microbiology and Immunology, Faculty of Medicine, Zagazig University, Zagazig, Egypt
13Department of Internal Medicine, Faculty of Medicine (for girls), Al-Azhar University, Cairo, Egypt
14Department of Pathology, Faculty of Medicine, Zagazig University, Zagazig, Egypt
15Department of Pathology, Faculty of Medicine, Tabuk University, KSA
Correspondence to: Eman M. I. Youssef, Department of Medical Biochemistry, Faculty of Medicine (for girls), Al-Azhar University, Cairo, Egypt.
| Email: |  |
Copyright © 2017 Scientific & Academic Publishing. All Rights Reserved.
This work is licensed under the Creative Commons Attribution International License (CC BY).
http://creativecommons.org/licenses/by/4.0/

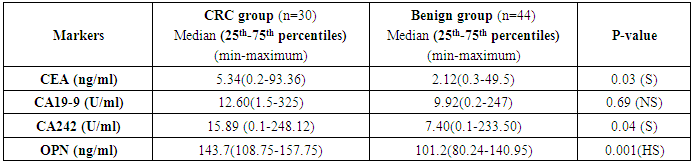
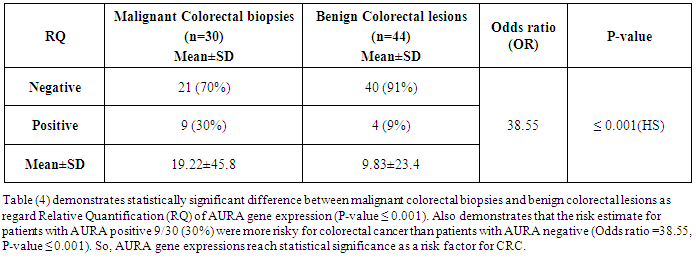
Aurora kinase A (AURA) is a serine/threonine-protein kinase enzyme that is encoded in humans by the AURA gene. AURA regulates the function of centrosomes and spindles for proper mitotic progression. AURA overexpression is observed in various cancers including colon cancer. Osteopontin (OPN) is a tumor progression gene and plays an essential role in tumorigenesis. The expression of OPN has been described to be related to the staging of colorectal cancer (CRC). Cancer Antigens CA 242 and CA 19-9 are widely synthesized and expressed by epithelial cells of the gastrointestinal tract. The present study aimed to assess the quantitative measurement of AURA gene expression in colonic tissue specimens of colorectal cancer as a potential tumor marker based on quantitative real-time polymerase chain reaction (qRT-PCR). Also determination of plasma OPN protein concentrations, CA19-9 and CA242 in serum in CRC patients using the Enzyme- linked immunosorbent assay (ELISA). In this study, the expression of AURA gene was analyzed in 30 malignant and 44 benign patients as a control group. A quantitative real-time PCR (qRT-PCR) was used to examine the copy number gains and mRNA level of AURA. The results showed that the AURA gene expression was highly expressed in (30%) 9 of 30 colorectal cancer studied specimens with (P-value <0.001) and expressed in (9%) 4 of 44, with a highly significant difference between the two groups. The medians of the four tumor markers (OPN, CA242, CEA and CA19-9) for the malignant and benign groups showed significant differences between the 2 groups as concerning CA242 and CEA, while a high significant difference was obtained regarding OPN, however no significant difference was achieved regarding CA19-9. Conclusively, it could be suggested that AURA gene in colorectal cancer specimens was highly expressed which could highlight the importance of this gene expression. Also the results showed that this procedure was able to discriminate between benign subjects and CRC and strongly support the idea that this genetic tissue marker might be a valuable diagnostic test for CRC. Furthermore, OPN protein level could be a sensitive marker of CRC.
Keywords: Centrosome-associated Kinase
Cite this paper: Dalal M. Nemenqani, Eman M. I. Youssef, Wael F. Sedik, Awatif Elmohamady Edreis, Fatma Saffeyeldin Mohamed, Fatma Oraby, Amal A. Soliman, Rehab M. Elsaid Tash, Marwa M. Hassan, Mona El-Fedawy El-Saied, Walid S. H. Elsaied, Hala M. Nageb, Study of Centrosome-associated Kinase Aurora A Gene Expression as a Molecular Marker and OPN, CA242 and CA19.9 as a Tumor Markers in Diagnosis of Colorectal Carcinoma, International Journal of Tumor Therapy, Vol. 6 No. 1, 2017, pp. 5-14. doi: 10.5923/j.ijtt.20170601.02.
Article Outline
1. Introduction
- Colorectal cancer (CRC) is the third most common malignant neoplasm in USA, estimated by the American Cancer Society; for both male and female with incidence of 9% and 8% respectively in the year 2017 [1]. CRC results from the progressive accumulation of genetic and epigenetic alterations that lead to the transformation of normal colonic epithelium to benign adenomas to colon adenocarcinoma and cancer progression [2]. Accumulation of epigenetic aberrations leads to changes in gene expression and affect the activity of cancer-related pathways [3, 4]. The development of CRC from normal epithelial cells through benign adenomas to malignant carcinomas and metastasis is a lengthy, multistep process, involving accumulation of mutations of key regulatory genes [5]. These steps include the activation of oncogenes, and inactivation of tumor suppressor genes and genes involved in DNA mismatch repair. Two forms of genetic instability are described in colon cancer. The first is driven by chromosomal instability (CIN) which comprises 85% of the cases, the progress of which involves both oncogenes and tumor-suppressor genes [6], while the second is the microsatellite instability (MSI) which expose deletions and amplifications of short sequences of nucleotides [7]. Chromosomal instability increases the rate of genomic alterations, necessary to bypass the rate-limiting steps in carcinogenesis. Analysis of chromosome copy number changes by comparative genomic hybridization has demonstrated that CRCs exhibit much more chromosomal instability than adenomas [8]. Regrettably, CRC diagnosis is often made at a too late stage and this induces a poor prognosis, emphasizing the need for prevention and early diagnostic tools. The development of such tools is highly dependent on the form of cancer being screened. The aurora kinase family is a collection of highly related serine/threonine kinases that are key regulators of mitosis. Aurora has evolved into 3 related kinases known as aurora-A, aurora-B, and aurora-C.Transfection studies have established aurora-A as a bone fide oncogene [9]. The aurora-A protein (also designated as STK15, BTAK, AURKA, aurora-2, AIK1, or ARK1) is a centrosome-associated protein and has been implicated in regulatory centrosome function, spindle assembly, spindle maintenance, chromosome segregation, and cytokinesis [10]. Dysregulation of Aurora kinases can cause aneuploidy which is a land mark of many human cancers. Their aberrant expression leads to centrosome amplification and malignant transformation, by the phosphorylation of tumor suppressor genes such as p53 [11]. For this reason the Aurora kinases are potential targets in treatment of cancer. The Aurora kinase inhibitors efficiently target highly proliferating cells, induce cytokinesis failure and ultimately cell death [12]. The gene for aurora-A is located on chromosome 20q13.2, a region commonly amplified in malignancies. In fact, amplification of aurora-A mRNA has been found in many human tumors. Aurora-A is likely to be regulated not only by amplification, but also by other mechanisms such as transcriptional activation and suppression of protein degradation [13]. Recently, a microarray mRNA expression profiling has been used to investigate the magnitude of differential expression between colorectal adenomas and adenocarcinomas for many genes, including AURA gene. AURA gene expression has been investigated as a key gene for carcinogenic pathways of colorectal cancers [14]. Microarray mRNA expression profiling allow to compare gene expression at a genome-wide level and to explore the transcriptional programs that are turned on or off in tumors during progression from normal through premalignant stages to cancer [15]. In addition, microarray is expensive and unsuitable for individual gene measurement. As such, Real time PCR can be of use in measuring single gene expression and to confirm the microarray results [16].Osteopontin (OPN) is a secreted glyco-phosphoprotein between 44-kDa and 75-kDa discovered in various cells and its gene locates in the long arm of human chromosome 4 (4q21–4q25). OPN protein is highly negatively charged, which contains an Arginine-Glycine-Aspartic acid sequence (RGD), extracellular matrix acidic glycoprotein that lacks an extensive secondary structure, it is composed of 314 amino acids [17]. OPN plays essential roles in a wide range of physiologic and pathologic courses, including bone turnover, wound healing, ischemia, inflammation, autoimmune responses, and tumorigenesis by stimulating some signaling pathway to promote the proliferation of tumor cells through binding to cellular receptors, integrins, and CD44 variants [18]. On the other hand, OPN serves as a survival factor for tumor cells due to its ability to inhibit the synthesis of nitric oxide (NO) by activated immune cells. Generation and release of NO is known to be lethal for both host cell and tumor cell due to inactivation of critical metabolic pathways. Therefore, tumor cells that produce OPN may protect themselves from oxidative damage. Moreover, data also showed that OPN delivers antiapoptotic signal to the cell, since tumor growth, either primary or metastatic, this could explain the association between OPN and tumor growth [19]. Studies on OPN tissue expression have shown that OPN is elevated in a number of tumors compared to normal specimens [20]. Moreover, intensity of OPN expression appears to correlate with patients’ survival and clinico-pathological data [21]. The expression of OPN has been described to be related to the staging of colorectal cancer with highest levels found in liver metastases [22]. It is recently reported that the OPN was the leading candidate gene related to occurrence and progression of CRC among more than 300 candidate tumor markers and more than 100 markers of tumor progression [23]. All these findings suggest that OPN is a promising diagnostic marker for primary tumor or metastases and, moreover, could be of prognostic value for cancer patients [22]. CA242 is a carbohydrate structures that is synthesized and expressed by both normal and malignant cells of the gastrointestinal tract [24]. An important characteristic of CA 242 is that it is only slightly and infrequently elevated in the sera of healthy subjects and in patients with benign diseases such as chronic pancreatitis, chronic hepatitis and liver cirrhosis while elevated levels are commonly found in serum from patients with gastrointestinal cancer [25]. The present study was designed to assess the development of a quantitative assay for the measurement of AURA gene expression in colorectal cancer as a potential tumor marker through its kinase activity based on Real-Time Polymerase Chain Reaction (qRT-PCR). Also determination of OPN protein concentration and some of tumor markers in relation to the disease using the Enzyme- linked immunosorbent assay (ELISA).
2. Subjects and Methods
2.1. Subjects
- The current study was conducted on 74 patients classified into two groups according to pathology results as follows: Group I: Colorectal malignancies: In those patients (n=30), colorectal masses were proved to be malignant by histopathological examination. Group II: Benign colorectal lesions: In those patients (n=44), 18 cases of ulcerative colitis, 13 cases of hyperplastic polyps, 8 cases of adenomatous polyps and 5 cases of familial polyposis, were detected and proved to be benign by histopathological analysis. They served as benign lesions control group. All patients were recruited from the Tropical and Internal Medicine Departments, Al-Zahara University Hospital, Cairo, Egypt. A verbal informed consent was taken from all subjects enrolled in the study after explaining the study’s purpose, procedures, and possible benefits to them. All the groups of patients studied in this work were subjected to the following: Full clinical assessment including and full history taking (Age, colorectal symptoms, smoking and dietary habits, any family history of colonic lesions), any medication received, history of any other systemic diseases. Complete physical examination including all other body systems. Radiological investigations, in the form of Abdominopelvic Ultrasound and CT. Tissue biopsies were obtained from any suspected lesion and were subjected to: a) Histopathological examination for all colorectal lesions and colorectal cancer tissues are grading to confirm the diagnosis. b) Molecular studies for measuring the expression of AURA gene using real time PCR (Applied Biosystem). Blood sampling for biochemical assays: 8ml of venous blood were withdrawn and divided into 4 tubes under aseptic conditions using sterile vacutainer from each subject as follows: Two ml venous blood were put into a plain sterile vacutainer for performing the routine laboratory investigations: renal functions, liver functions (Total bilirubin, direct bilirubin, ALT, AST, albumin, total proteins) and 2ml venous blood for performing tumor markers: Carcinoembryonic antigen (CEA), cancer antigen 19.9 (CA 19.9) and cancer antigen 242 (CA 242). Serum samples were stored at -20ºC until analysis by enzyme linked immunosorbant assay (ELISA) technique using commercial kits. Two ml venous blood were put into a sterile EDTA for performing CBC. Two ml venous blood were put into a sterile EDTA and centrifuged at 3000 rpm for 10 min, and then the supernatants were extracted and stored at -20ºC until analysis the osteopontin (OPN) protein concentration using the Enzyme- linked immunosorbent assay (ELISA).
2.2. Methods
2.2.1. Determination of Tumor Markers by Enzyme Linked Immunosorbant Assay (ELISA) Technique
- a) Determination of CEA and CA-19-9: Both kits were supplied from Monobind Inc. Lake Forest, CA92630, USA, CEA: Product Code: 1825-300, while CA-19-9 ELISA, Product Code: 3925-300.b) Determination of CA 242: The CanAg CA242 EIA, Diagnostics AB. Majnabbe Terminal, SE-414 55 Gothenburg, Sweden. Is a solid-phase, non-competitive immunoassay based on the direct sandwich technique. Calibrators, controls and patient samples are incubated together with biotinylated anti-CA242 monoclonal antibody (MAb) in Streptavidin coated microstrips. CA242 present in calibrators, controls or samples is adsorbed to the Streptavidin coated microstrips by the biotinylated anti-CA242 MAb during the incubation. The strips are then washed and incubated with horseradish peroxidase (HRP) labeled Anti-CA242 MAb. After washing, buffered Substrate/Chromogen reagent (hydrogen peroxide and 3, 3’, 5, 5’ tetra-methylbenzidine) is added to each well and the enzyme reaction is allowed to proceed. During the enzyme reaction a blue color will develop if antigen is present. The intensity of the color is proportional to the amount of CA242 antigen present in the samples. The color intensity is determined in a microplate spectrophotometer at 620 nm (or optionally at 405 nm after addition of Stop Solution).c) Measurement of OPN protein by ELISA: Quantitative determination of OPN levels by Quantikine human enzyme-linked immunoassay OPN (ELISA) kits [PharmPak (R&D Systems, Shanghai PRC 200050), (Catalog number: PDOST00], according to the manufacturer’s instructions, this assay employs the quantitative sandwich enzyme immunoassay technique. A monoclonal antibody specific for human OPN has been pre-coated onto a microplate. Standards and samples are pipetted into the wells and any OPN present is bound by the immobilized antibody. After washing away any unbound substances, an enzyme-linked polyclonal antibody specific for human OPN is added to the wells. Following a wash to remove any unbound antibody-enzyme reagent, a substrate solution is added to the wells and color develops in proportion to the amount of OPN bound in the initial step. The color development is stopped and the intensity of the color is measured. Optical densities were measured at 450 nm using a micro-plate reader set to 450 nm. The concentrations were calculated from the standard curve generated by a four parameter logistic (4-PL) curve-fitting programme.
2.2.2. Molecular Evaluation of Aurora A Gene Expression Using Real - Time Quantitative PCR (qRT-PCR)
- The following four steps were done: (1) Sample collection: Colon biopsies were obtained and stored at –70°C. (2) The TaqMan® Gene Expression Quantification assays are performed in a two-step reverse transcription-polymerase chain reaction (RT-PCR). In the reverse transcription step, cDNA is reverse transcribed from total RNA samples using random hexamers from the TaqMan® Reverse Transcription Reagents. In the polymerase chain reaction step, PCR products are synthesized from cDNA samples using the TaqMan Universal PCR Master Mix. RNA was extracted from tissue biopsies using commercially available kit (QIAamp® RNA Blood Mini Kits from QIAGEN, USA, Catalog No.: 52304), following the manufacturer’s recommendations modified protocol adapted to isolation of RNA from tissue samples [26]. (3) Complementary DNA formation using High-Capacity cDNA Archive Kit, Applied Biosystems, USA, Part Number: 4322171 [27]. (4) Quantitative real - time PCR (qRT-PCR) using TaqMan® Gene Expression Assay (TaqMan® MGB probes, FAM™ dye-labeled) Applied Biosystems, Part Number: 4331182. The PCR reaction exploits the 5´ nuclease activity of AmpliTaq Gold® DNA polymerase to cleave a TaqMan® probe during PCR. The TaqMan probe contains a reporter dye at the 5´-end of the probe and a quencher dye at the 3´-end of the probe. During the reaction, cleavage of the probe separates the reporter dye and the quencher dye, resulting in increased fluorescence of the reporter. Accumulation of PCR products is detected directly by monitoring the increase in fluorescence of the reporter dye. The increase in fluorescence signal is detected only if the target sequence is complementary to the probe and is amplified during PCR. Because of these requirements, any nonspecific amplification is not detected. Data from the amplification plot was obtained and analyzed. The PCR total reaction volume was 25 μl containing 1.25 μl of Gene Expression Assay and 12.5 μl of TaqMan Universal PCR Master Mix, with AmpErase UNG, then 5 μl of the cDNA template and 5 μl RNase free water were added and 1.25 μl of TaqMan Endogenous Control Assay. Primers were provided by (Applied Biosystems, USA) and were prepared according to manufacturer’s instructions.Sequence of the AURA gene primers and probe: the forward primer was: 5'-TTC CAG GAG GAC CAC TCT CTG T-3', the reverse primer was: 5'-TGC ATC CGA CCT TCA ATC ATT-3' and the TaqMan probe: 5'-FAM-TGT ACG TCG TCG AGC TGC TCA GGT CTT T-TAMRA-3'. The amplification conditions were 50°C for 2 minutes for AmpErase UNG activation, followed by 95°C for 10 minutes for AmpiTaq Gold Enzyme activation, 95°C for 15 seconds for denaturation followed by 60°C for 1 minute for annealing and extension for 40 cycles in an automated thermal cycler. Data from the amplification plot was obtained and analyzed.Interpretation of results: Interpretation of results was done using the Comparative CT method for Relative Quantitation according to this Arithmetic Formulas: Relative Quantification RQ = 2 – (Δ Δ Ct)Arithmetic Formulas: The amount of target, normalized to an endogenous reference and relative to a calibrator, is given by: 2 – (Δ Δ Ct)Where's Ct = Threshold cycleΔ Ct = Ct Target gene – Ct Reference geneWhere's Δ Ct = the difference in threshold cycles for target and reference. Δ Δ Ct = Δ Ct Case – Ct Calibrators The Comparative Ct method requires an endogenous control, which is a gene target used to normalize quantitative PCR results. The endogenous control should consistently express in all samples and the expression level should not be altered by any experimental condition. The AURA gene expression in a sample was determined by subtracting the cycle threshold of the reference gene from that of the target gene to get the normalized amount of the AURA mRNA, then comparing this value to that of the calibrators.
2.3. Statistical Methods
- For statistical analysis, statistical package for social science (SPSS) software version 17 was used [Cross tabulation test, the Correlation coefficient (r), the receiver operating characteristic (ROC) curve and odds ratio (OR): the odds of an event happening is the probability that the event will happen divided by the probability that the event will not happen. A P- value <0.05 was considered significant. In Receiver Operating Characteristic (ROC) curve the true positive rate (Sensitivity) is plotted in function of the false positive rate (100-Specificity) for different cut-off points. Each point on the ROC plot represents a sensitivity/specificity pair corresponding to a particular decision threshold. A test with perfect discrimination (no overlap in the two distributions) has a ROC plot that passes through the upper left corner (100% sensitivity, 100% specificity). Sensitivity: probability that a test result will be positive when the disease is present (true positive rate). Specificity: probability that a test result will be negative when the disease is not present (true negative rate).
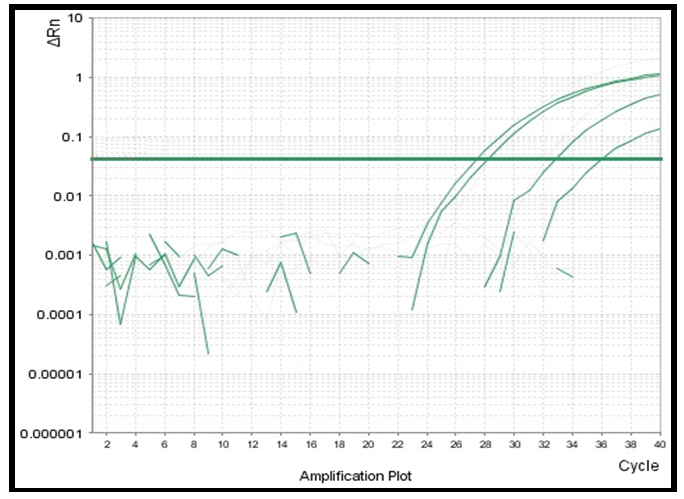 | Figure (1). Amplification Plot of quantitative real time PCR showing high level of AURA expression in a malignant colorectal tissue biopsies |
3. Results
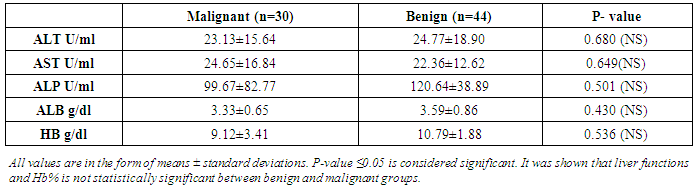
- The results obtained are presented in tables (1-5) and figures (2-5). Routine laboratory data of malignant and benign studied groups are shown in table 1. CRC patients (n=30) were 16 males and 14 females with a mean age of 49.4years±16. While the patients with benign colonic lesions (n=44) included 29 males and 15 females with a mean age of 50years±6.5. Considering smoking, 8/30 CRC patients (27%) were smokers and 5/44 patients with benign lesions were smokers. Regarding the family history of significant colorectal lesions, the study included 25 patients (84%) without family history of colorectal lesions, 3 patients (1.0%) with family history of colorectal lesions and 4 patients (15%) with unknown data about family history.
|
|
|
|
|
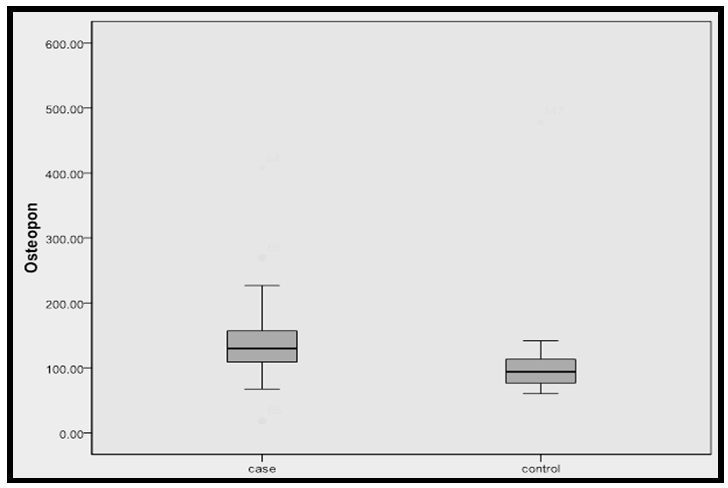 | Figure (2). Median OPN protein concentration in malignant and benign groups The level of OPN was significantly higher in CRC patients when compared with the other group (p=0.0001) |
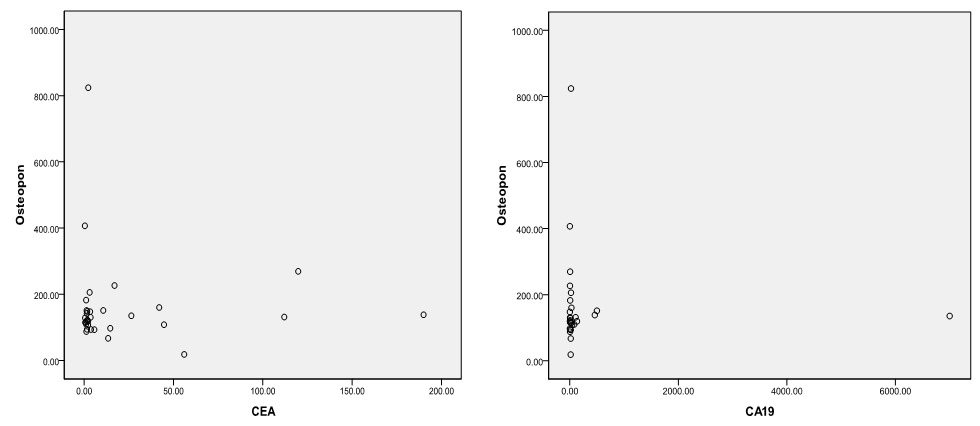 | Figure (3). Correlation between OPN protein and CEA (left) & Correlation between OPN and CA19-9 (right). There was no significant correlation between plasma OPN protein and CEA (r=0.001, p=0.873) and similarly no significant correlation between OPN protein and CA19-9 (r=0.013, p=0.759) |
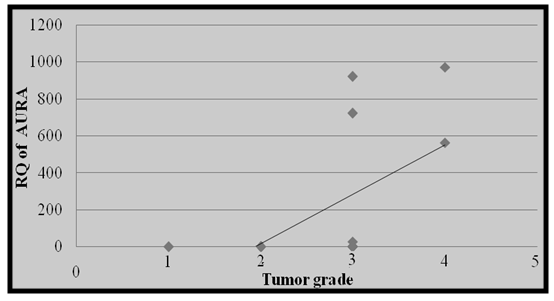 | Figure (4). Correlation between RQ of AURA gene expression and tumour grade. This figure demonstrates that there was a positive correlation between RQ of AURA gene expression and tumor grade (P-value=0.010, r=0. 602) |
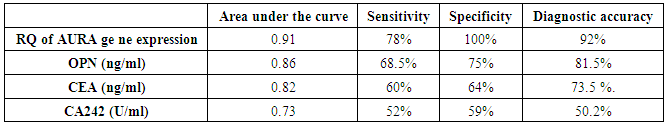
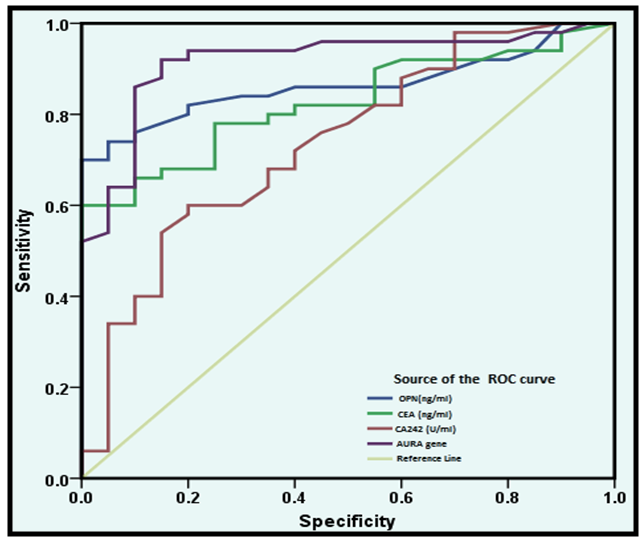 | Figure (5). Receiver Operating Characteristic (ROC)-curves for the studied four markers to differentiate malignant and non-malignant groups. Figure 7 showed ROC curve yielded an area under curve(AUC) of 0.91 for AURA gene expression (shown as purple line), 0.86 for OPN (shown as blue line), 0.82 for CEA (shown as green line) and 0.73 for CA242 (shown as red line) |
4. Discussion
- Colorectal cancer (CRC) persists as one of the most prevalent and deadly tumor types in both men and women in USA [1]. CRC is the major diagnostic and therapeutic problem. The number of patients in the world has increased recently [6]. Regarding OPN protein in this study, the level of OPN was significantly higher in CRC patients (143.7(108.75-157.75 ng/mL)) when compared with benign group controls (101.2(80.24-140.95 ng/mL)) with (P ≤ 0.001) and the area under curve for OPN in the ROC curve was 0.86 with 68.5% sensitivity and 75% specificity. A recent study done by Kamal et al., [28] in National Cancer Institute, Cairo University showed very similar findings in 100 newly diagnosed CRC patients and 112 healthy controls as they found significantly higher levels of OPN in CRC patients (129.7 (108.8–157.8) ng/mL) compared controls (93.7 (76.5–114.9) ng/mL (p = 0.0001) with 81.8% sensitivity and 68.2% specificity and AUC 0.79 (95% CI = 0.70–0.89, p < 0.0001). Similarly Fan et al., [4] measured the plasma OPN levels in 85 CRC patients and 86 controls. They found significantly increased levels of plasma OPN in CRC patients (133.57-29.20 ng/mL) compared with controls (78.70-23.64 ng/mL) (p<0.001). A categorical meta-analysis included six studies in which colorectal tumor stage (T stage) was related to OPN protein or mRNA levels in a total of 420 patients. The results showed that OPN levels significantly raised with increasing tumor stage [29]. The medians of the three tumor markers (CA242, CEA and CA19-9) in this study for the malignant and benign groups were significantaly differenant between the two groups as concerning CA242 and CEA, while no significant difference was achieved regarding CA19-9. Similar findings were previously reported by Zhao et al., [30] but they found that serum levels of the three markers were significantly higher in 134 patients with colorectal cancer compared with 200 healthy people as a control. However; they stated that sensitivity of CEA and CA242 for colorectal cancer diagnosis was higher than that of CA19-9. Also the present study results are in agreement with those reported by Carpelan-Holmstrom et al. [31] as regard elevation of serum concentrations of the markers CEA, CA 242 and when their serum values were compared between 204 patients with malignant colorectal disease and 104 patients with benign colorectal disease. The result of the serum levels of CA19-9 in this study agreed with the that done by Cerda et al. [32] which was performed on seventy CRC patients and 32 healthy controls. They reported that there was no significant difference in CA19-9 between the malignant and control group. The majority of researchers arrived to the conclusion that CA19-9 sensitivity is much inferior to that of CEA, and that elevated CA19-9 levels is a poor prognostic factor [33]. Lumachi et al. [34] reported sensitivity and specificity of five tumor markers, among them CEA, CA19-9 and OPN in 102 colorectal adenocarcinoma with Dukes B, G1-2 and 99 patients suffering from confirmed benign colorectal diseases as control group. They found the highest sensitivity for osteopontin (45.1%), followed by CEA 44.1%, and the least sensitivity was for CA19-9 (22.5%) while the highest specificity was for CEA (90.9%), and that of osteopontin was 31.3% and the least specificity was for CA19-9 (27.3%). The accuracy was 24.9%, 38.3% and 67.2% for CA19-9, osteopontin and CEA respectively. In this work, there was no significant correlation between plasma OPN protein and either CEA or CA19-9. This goes hand with hand with the study done by Fan et al., [4] and Kamal et al., [28] as both studies found that there was no significant correlation between OPN, CA19-9 and CEA (P>0.05).On the other hand, the results of this study showed that Aurora Kinase A is significantly over expressed in (30%, 9 of 30) colorectal cancer biopsies as regards relative quantification (RQ) of AURA gene expression (P-value <0.001). In the present study, the risk estimate for biopsies with AURA positive (9/30) was more for colorectal cancer than biopsies with AURA negative (Odds ratio =38.55, P- value <0.001). This finding was in accordance with the result of Zhang et al., [13]. They performed level of AURA m-RNA expression in colorectal samples by real time quantitative PCR (qRT-PCR) and copy number gains of AUKRA. Their study showed that copy number gains of AURA were detected in a relative high percentage in colorectal samples (32.4%, 43 of 134) and was positively correlated to AURA m-RNA overexpression. However, they also noted that the expression level of AURKA mRNA was enhanced in the group of CRC samples with unaltered copy numbers. These findings indicated that sporadic colorectal cancers exhibit different mechanisms of aurora A regulation and this may impact the efficacy of aurora-targeted therapies.Similarly, Baba et al., [35] reported that frequencies of AURA gene expression were over expressed in colorectal cancers (19%, 98 from 517). In agreement with this; Beatriz et al., [3] also found that amplification of the Aurora-A in the human CRC tissues was frequent (29%). Furthermore, Killian et al., [36] by useing another method; somatic quantitative multiplex polymerase chain reaction of short fluorescent fragments (QMPSF) on 57 CRC patients; reported that a gene copy number increase for AURA was detected in 53% of the colorectal cancer cases. This study was in accordance with Lassmann et al., [37] who stated that the expression of AURA mRNA was significantly higher in invasive carcinoma than normal epithelium (p-value<0.001). At the protein level, Lassmann et al., [37] also found a significant correlation between aurora A mRNA expression and aurora A protein positive tumor cells by immunohistochemistry in invasive carcinoma (p-value <0.05). Similary, Sillars-Hardebol et al. [38] had verified the increased AURA gene expression by immunohistochemical analysis of a series of adenomas and CRCs. They found significantly increased AURA gene expression among with other six gene sets in 37 CRCs compared to 31 adenomas by using microarray mRNA expression profiling of colorectal tumor tissue samples. Their findings are denoting that AURA gene is one of key genes involved during malignant transformation that can be used as tumor marker to improve molecular characterization of colorectal tumors. In a subsequent related study, Beatriz et al. [3] used genome-wide mRNA expression profiles by oligonucleotide microarrays. They found significantly upregulated mRNA expression of 96 genes and AURA gene overexpression was one of them indicating its crucial role in Adenoma carcinoma progression. Similar findings were declared by Chuang et al. [39] who identified 68 candidate genes that may be involved in malignant transformation. Among these, Aurora A with upregulated protein levels found in the studied samples. Carvalho et al. [40] reported that several genes, including AURA mapping at 20q were significantly overexpressed in carcinoma compared with adenoma. They concluded that these genes were important in chromosomal instability-related adenoma to carcinoma progression, therefore may serve as highly specific biomarkers for colorectal cancer with potential clinical applications. A recent study done on 151 patients who underwent curative surgical resection for colorectal adenocarcinomas by Koh et al., [41] found that AURA gene amplification was found more frequently in the 20q13.2–13.33 gain-positive group than the group with no significant gain on the AURA-containing locus. AURA protein expression was detected in colorectal cancer patient by immunohistochemistry in 45% of the cases (68/151). They also stated that AURA-positive patients had a significantly poorer progression-free survival than the AURA-negative patients (p<0.001). Finally, they confirmed that AURA expression was an independent and significant prognostic factor in colorectal adeno-carcinoma.According to the results of the current study and the corresponding studies, it is shown that the AURA gene expression in colorectal cancer patients was highly expressed, which could highlight the importance of this gene expression among these subsets of patients. The most interesting finding in this study was a positive correlation between RQ of AURA gene expression and tumor grade. The results showed that the predictive ability of this qRT-PCR assay was highly discriminative between normal subjects and colorectal cancer patients and this strongly support the idea that a valuable diagnostic test for cancer might be developed using Aurora Kinase A gene expression as a genetic marker in tissues. Also, we conclude that the plasma OPN protein level could be used as a sensitive marker of CRC. A larger sample size is recommended using greater number of subjects to avoid statistical interference and bias. Future studies involving a large number of cases with different histopathological types and staging of the disease may allow a more detailed assessment of the predictive ability of this qRT-PCR assay. However it needs to be combined with other markers in further studies to be more specific for colorectal cancer.