-
Paper Information
- Paper Submission
-
Journal Information
- About This Journal
- Editorial Board
- Current Issue
- Archive
- Author Guidelines
- Contact Us
International Journal of Theoretical and Mathematical Physics
p-ISSN: 2167-6844 e-ISSN: 2167-6852
2020; 10(2): 33-41
doi:10.5923/j.ijtmp.20201002.01

Theoretical Investigation of Surface Tension and Viscosity of Zn-In Alloy at Different Temperatures Using Optimization Method
 Abstract
 Reference
 Full-Text PDF
 Full-text HTML
H. K. Limbu1, 2, K. K. Mishra1, G. P. Adhikari2, I. S. Jha1
1Department of Physics, Mahendra Morang Aadarsh Multiple Campus, Tribhuvan University, Biratnagar, Nepal
2Department of Physics, Tri-Chandra Multiple Campus, Tribhuvan Univeristy, Kathmandu, Nepal
Correspondence to: H. K. Limbu, Department of Physics, Mahendra Morang Aadarsh Multiple Campus, Tribhuvan University, Biratnagar, Nepal.
| Email: |  |
Copyright © 2020 The Author(s). Published by Scientific & Academic Publishing.
This work is licensed under the Creative Commons Attribution International License (CC BY).
http://creativecommons.org/licenses/by/4.0/

The surface tension is calculated using Butler’s equation and Layered structure approach. Viscosity is obtained from Singh and Sommer’s formulation, Moelwyn-Hughes equation and Kaptay equation at different temperatures. we have computed interchange energy by estimating the best fit experimental and theoretical values at 700K using Flory’s model. Taking these values of interchange energy at 700K, interchange energy at different temperatures are calculated using optimization method. Using values of interchange energy at different temperatures, heat of mixing, entropy of mixing and free energy of mixing at corresponding temperatures are computed. The partial excess free energy is calculated with the help of values of free energy of mixing which is used to find surface tension.
Keywords: Flory’s model, Surface tension, Viscosity, Order energy parameter, Different temperatures, Optimization method
Cite this paper: H. K. Limbu, K. K. Mishra, G. P. Adhikari, I. S. Jha, Theoretical Investigation of Surface Tension and Viscosity of Zn-In Alloy at Different Temperatures Using Optimization Method, International Journal of Theoretical and Mathematical Physics, Vol. 10 No. 2, 2020, pp. 33-41. doi: 10.5923/j.ijtmp.20201002.01.
Article Outline
1. Introduction
- Zn-In alloy does not form intermetallic compounds and hence does not show brittle nature. It may be useful as a reliable high temperature lead free solder and alkaline battery anode [1]. It can be used in a protective molding to avoid reaction with moisture. The alloy exhibits good mechanical, electrical and thermal conductivity properties than its constituent components.In metallurgical science, the study of surface and transport properties of liquid alloy is important because a good knowledge of their mixing properties in the liquid state is necessary for preparation of desired materials. Surface tension is required to understand the surface related phenomena such as wetting characteristics of solders, corrosion and kinetics of transformation. We have used Butler’s equation [2] and Layered Structure approach [3], [4] to study the surface tension. And, viscosity is important for many metallurgical process and heterogeneous chemical reactions. The viscosity is studied with the help of Moelwyn-Hughes equation [5], Kaptay equation [4] and, Singh and Sommer’s Formulation [6].In this work, we have used Flory’s model [7], [8] to explain the thermodynamic and structural behavior of the alloy at different temperatures because the size effect is noticeable in the alloys. In Flory’s model, the interaction energy parameter is considered as temperature dependent and is determined by fitting experimental free energy of mixing at different concentrations. The mixing behavior of binary liquid alloys may be explained in terms of thermodynamic and microscopic properties. Thermodynamic behavior of the alloy is understood by the knowledge of free energy of mixing (GM), activity (a), heat of mixing (HM) and the entropy of mixing (SM). Theory of Flory’s model has been presented in section 2, result and discussion is dealt in section 3, and conclusions are provided in section 4.
2. Formalism
- The alloying behavior of liquid alloys can be studied with the help of either the electronic theory of mixing [9-10] or the statistical mechanical theory of mixing. Metal physicists [11-13] have keen interest in explain the concentration dependent asymmetry in the properties of mixing of binary liquid alloys and hence to extract additional microscopic information. Whenever there is difference in size of the atomic species in a liquid alloy, Flory’s model is best applicable for the determination of thermodynamic and microscopic properties since it has taken size mismatch into consideration. Flory’s expression for the free energy of mixing of a binary mixture A-B consists of CA (≡ c) mole of A and CB {≡ c(1-c)} mole of B respectively, where CA and CB are the mole fractions of A (≡ Zn) and B (≡ In) in the binary liquid alloy A-B. Thus free energy of mixing of those alloys whose constituent atoms differ widely in size can be expressed as
 | (1) |
 | (2) |
 | (3) |
 | (4) |
 | (5) |
 and
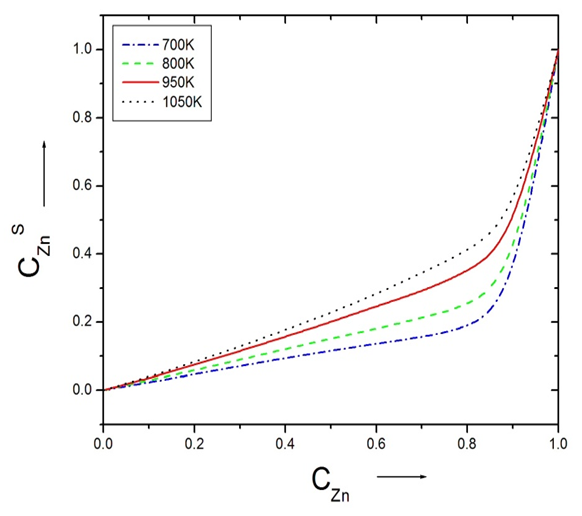
and  are atomic volumes of the pure species A and B respectively [7] defined as
 | (6) |
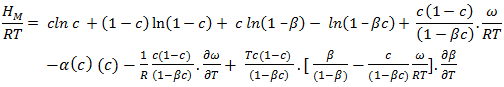
 = atomic volume at melting pointTM = melting temperature and 𝛼p = volume coefficient at constant temperature.From Flory’s model the expression for free energy of mixing is given by
  | (7) |
 | (8) |
 | (9) |
 | (10) |
 | (11) |
 | (12) |
 | (13) |
2.1. Viscosity
- The Moelwyn – Hughes equation:-Viscosity of liquid alloys helps to understand the mixing behavior of binary liquid alloys at microscopic level. It is one of the important transport properties. In order to examine the atomic transport behavior of the alloy, we have used the Moelwyn-Hughes equation [5]. The Moelwyn-Hughes equation for viscosity of liquid mixture is given as
 | (14) |
 is the viscosity of pure component K and for most liquid metals, it can be calculated from Arrhenius type equation [15] at temperature T as
  | (15) |
 is constant (in unit of viscosity) and En is the energy of activation of viscous flow for pure metal (in unit of energy per mole).Singh and Sommer’s Formulation:-According to Singh and Sommer [6], the deviation in the viscosity of a binary liquid alloy from the ideal mixing can be discussed quantitatively in terms of the energetic and the size factor. It is expressed as
  | (16) |
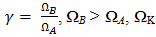
 | (17) |
 and
and  are the concentration of component and viscosity of pure component k respectively. Osman and Singh [16] suggested that when entropic effects are considered, the factor ф, as function of composition, can be obtained calculation from the expression
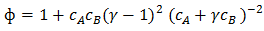 | (18) |
 is atomic volume.Kaptay equation:-The kaptay equation [17] for the viscosity of binary mixture has been derived taking account into the theoretical relationship between the activation energy of viscous glow and the cohesion energy of the alloy stating that in alloys with stronger cohesion energy the viscosity will increase, and not decrease. It is expressed as
 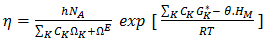 | (19) |
 is the Gibb’s energy of activation of the viscous flow in pure component K, HM is enthalpy of mixing of the alloy, CK (=A, B) represents concentration, and Ө is a constant whose value is taken to be 0.155±0.015 [4].
  of component K is expressed as
 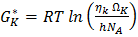 | (20) |
 is the viscosity of pure component K.The variation of viscosity,
  with temperature T from the Arrhenius type equation [16] is expressed as
 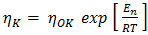 | (21) |
 is constant (in unit of viscosity) and En is the energy of activation of viscous flow for pure metal (in unit of energy per mole).
2.2. Surface Tension
- Butler’s equation:-The surface tension of the initial melt has great influence on the formation of solid alloys by the solidification process. The surface properties help to understand metallurgical modeling, description and prediction of structure development during solidification in the binary alloys. In our work, the Butler’s equation [2] is employed to study its surface tension. Butler’s assumed the existence of surface monolayer at the surface of a liquid as a separate phase that is in thermal equilibrium with the bulk phase and derived an expression
 | (22) |
 and
and  (i = 1,2) are partial excess free energies,
  and
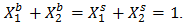
and  are mole fraction of component i in the surface and bulk respectively The molar surface area of the component i can be computed by using the relation
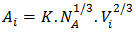 | (23) |
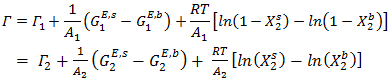
 Layered Structure approach:-The layered structure approach [3], [4] connects the surface tension
  of alloy to its bulk thermodynamic properties through the bulk activity coefficients
  as
as  | (24) |
 is surface tension, CKS is the surface concentration of pure component K (K = A, B) at temperature T, p and q are surface coordination fractions, related as p + 2q = 1. In a simple cubic crystal z = 6, p = 2∕3 and q = 1∕6, in a bcc crystal z = 8, p = 3∕5 and q = 1∕5, and in a closely packed crystal, z = 12, p = 1∕2 and q = 1∕4 [3], [4]. And,
  is the mean area of the surface per atom which can be computed as
 Where,
2.3. Optimization of Free Energy of Mixing (GM), Activity (a), Heat of Mixing (HM), Surface Tension (Γ) and Viscosity (η)
- The optimization method is a statistical thermodynamics or polynomial expressions. The adjustable coefficients, used in the process, are estimated by least square method. The various thermodynamic properties, described by a power-series law whose coefficient are A,B,C,D,E,…..(say), are determined by least-square method [18]. The heat capacity can be expressed as
 | (25) |
 | (26) |
 | (27) |
 we get the temperature (T) dependent free energy as
  | (28) |
 | (29) |
 | (30) |
 of the alloy liquid alloy at different temperatures can be determined by the relation
 | (31) |
 | (32) |
3. Result and Discussion
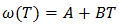
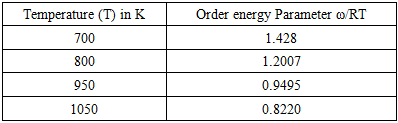
- The values of A and B in equation are calculated with the help of values of ω/RT and
 at 700K for Zn-In alloy using equation (32). These values of
  and
and  at temperature 700K is computed using the best fit approximation of experimental values of the alloys from Hultgrenet.al. 1973 [21] using equations (7) and (9). The best fit parameters of the alloy at 700K is found to be
  = 1.428 using equation (7) and
  = -0.39 using equation (9). By taking the values of coefficient constants A, B,
  and
and  the values of interchange energy (ω) at different temperatures (i.e. 700K, 800K, 950K, 1050K) are obtained. The values of free energy of mixing (GM) of the alloy at temperatures 700K, 800K, 950K and 1050K have been calculated by using the corresponding values of
  in equation (7) over the entire range of concentration. And, the values of free energy of mixing (GM) are used to calculate the corresponding excess free energy of mixing
  of the alloy at temperatures of study by using equation (31).Interaction energy (ω) is found to be positive for the Zn-In alloy, which indicates that is segregating in nature. Using above interchange energy (ω), we have computed free energy of mixing (GM), activity (a) entropy of mixing (SM), heat of mixing (HM), surface tension (Γ) and viscosity (𝜂) at temperatures 700K, 800K, 950K, 1050K using Flory’s model in which size factor plays important role.
3.1. Free Energy of Mixing (GM)
- The experimental values of free energy of mixing (GM) is taken from Hultgren et.al. [21] by which we have estimated the interchange energy (ω) at that temperatures by best fit method using equation (7) i.e. ω = 1.428RT at 700K. The free energy of mixing (GM) at different temperatures are obtained using equation (7) with the help of optimized values of energy order parameters ω(T) presented on the table 1. The plot of experimental values of free energy of mixing (GM) at 700K and theoretical values at temperatures 700K, 800K, 950K, 1050K of the Zn-In liquid alloy with respect to the concentration of Zn is shown in figure (1).
|
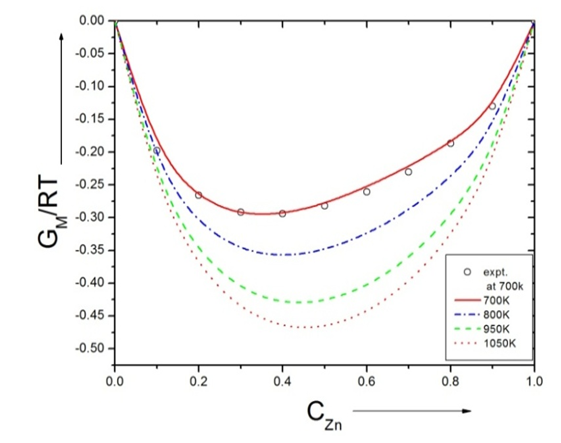 | Figure (1). Graph for GM/RT versus the concentration of CZn of Zn-In liquid alloy at temperatures 700K, 800K, 950K and 1050K |
3.2. Entropy of Mixing (SM)
- The experimental values of entropy of mixing(SM) at at 700K for the alloy is taken for Hultgren et. al. [21]. The values of
 estimated at the temperature using best fit method with the help of equation (9) i.e.
  = -0.39 at 700K. The entropy of mixing of the alloy at temperatures 700K, 800K, 950K, 1050K are calculated using equation (9) conjugation with equations (10) and (11) with the help of optimized values of energy order parameters ω(T) presented on the table 1. We obtained constant values of
  from equation (25).The plot of experimental values of entropy of mixing (SM) at temperatures 700K, 800K, 950K and 1050K of the alloy with respect to the concentration of Zn is shown in figure (2).
 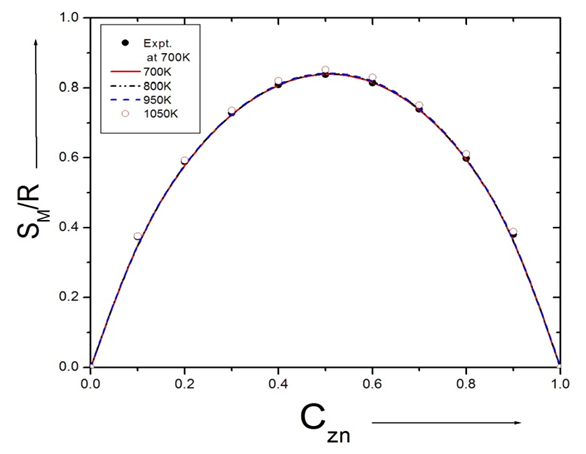 | Figure (2). Graph for SM/R versus the concentration of CZn of Zn-In liquid alloy at temperatures 700K, 800K, 950K and 1050K |
3.3. Heat of Mixing (HM)
- The heat of mixing (HM) for the alloys at temperatures 700K, 800K, 950K, 1050K are computed using equation (12) in conjugation with equations (7) and (9) with the help of corresponding optimized values of free energy of mixing (GM) and entropy of mixing (SM).The plot of experimental values of heat of mixing (HM) at 700K and theoretical values at temperatures 700K, 800K, 950K, 1050K of the Zn-In liquid alloy with respect to the concentration of Zn is shown in figure (3).
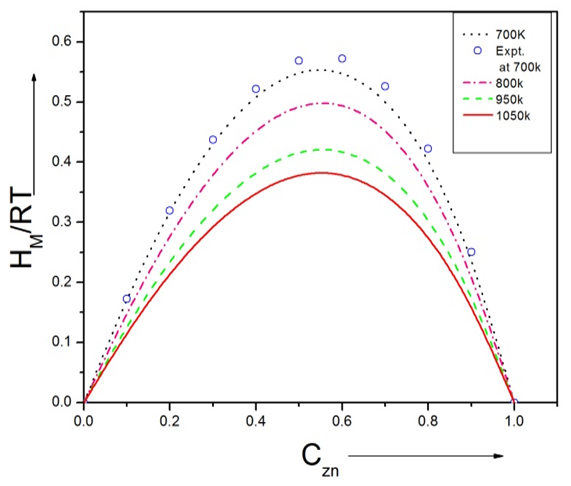 | Figure (3). Graph for HM/RT versus the concentration of CZn of Zn-In liquid alloy at temperatures 700K, 800K, 950K and 1050K |
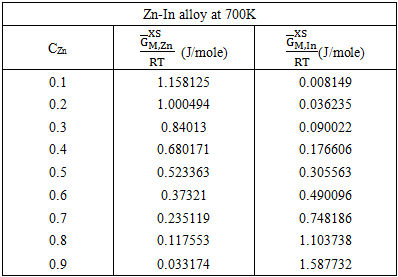
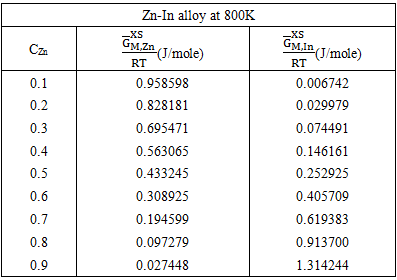
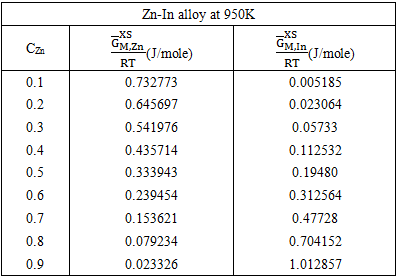
3.4. Excess FREE ENergy  ACtivity (a) and PARTIAL EXCESS FREE ENergy
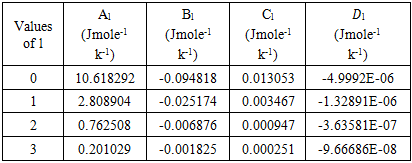
- The least-square method has been used to calculate the parameters involved in equation (29) at different temperatures and then the optimized coefficients for the alloys are computed which are listed in the table 2.
|
 of the components A(=Zn) and B(=In) are computed using equations [19]
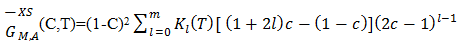 | (33) |
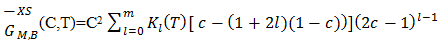 | (34) |
|
|
|
|
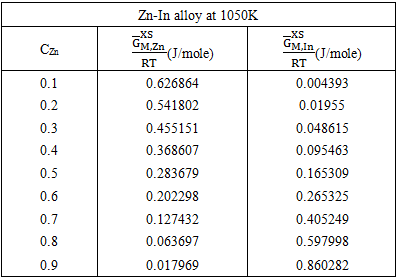
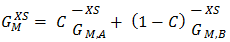 | (35) |
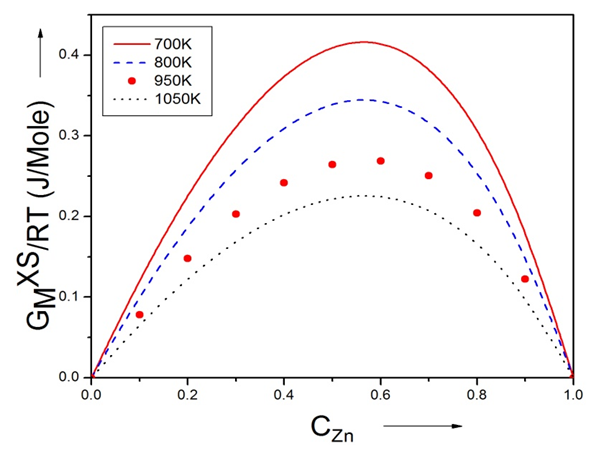 | Figure (4). Graph for  at different temperatures versus CZn of Zn-In liquid at temperatures 700K, 800K, 950K and 1050K at different temperatures versus CZn of Zn-In liquid at temperatures 700K, 800K, 950K and 1050K |
 (i = Zn or In for Zn-In) at different temperature over the entire range of concentration for components have been computed from the relation
 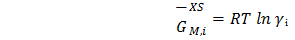 | (36) |
 | (37) |
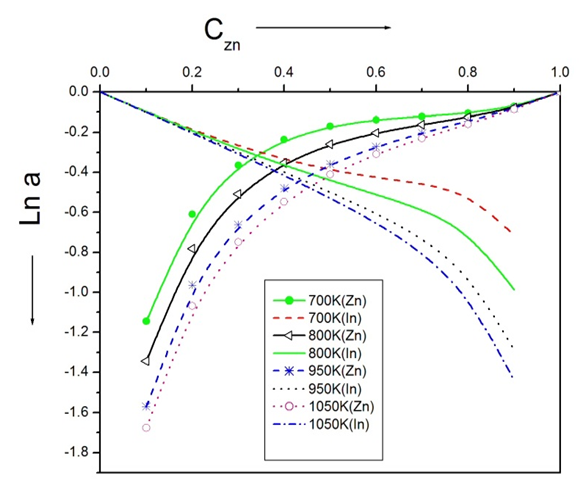 | Figure (5). Graph for at different temperatures versus CZn of Zn-In liquid alloy 700K, 800K, 950K and 1050K |
3.5. Surface Tension
- The surface tension of the liquid alloys can be computed using equation (22) conjugation with equation (23) using Butler’s model [2], [20]. The ratio of partial excess Gibbs energy in the bulk and that in the surface can be expressed as
 The value of parameter β has been taken as 0.83 as suggested by different researchers to compute surface tension of liquid alloys i.e. Guggenheim [11], Yeum et al. [22] and Tanaka et al. [17]. The temperature coefficients and surface tension at melting points of pure Zn and In components are taken from Smithells Metal reference book [14]. The surface tension of the pure component at temperature of investigation have been calculated using the relation.
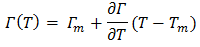 Where,
  (= -0.09 mNm-1k-1 for In, and -0.17mNm-1k-1 for Zn) is temperature coefficient of surface tension, Tm (= 430 K for In, and 692.5K for Zn) is melting temperature and T=700K, 800K, 950K and 1050K.We have calculated surface concentration of Zinc corresponding to the bulk concentration of Zinc component in the alloys using Butler’s equation (22). The plot of the surface concentration of Zinc Vs bulk concentration of Zn-In alloy at temperatures 700K, 800K, 950K and 1050K is shown in figure (6).
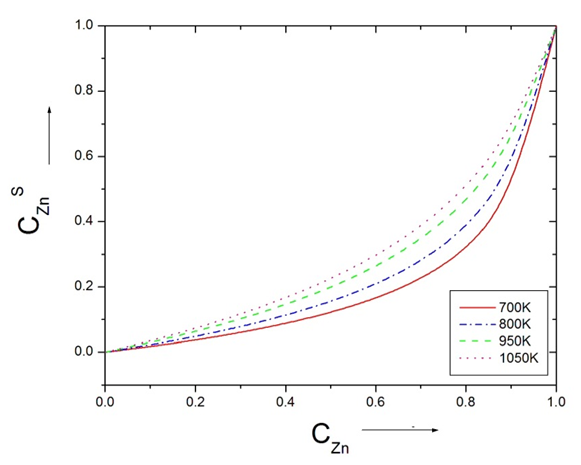 | Figure (6). The surface concentration of Zn versus bulk concentration of Zn in Zn-In alloy at temperature 700K, 800K, 950K and 1050K using Butler’s equation |
 | Figure (7). The surface tension () versus concentration of Zn at temperatures 700K, 800K, 950K, 1050K using Butler’s equation |
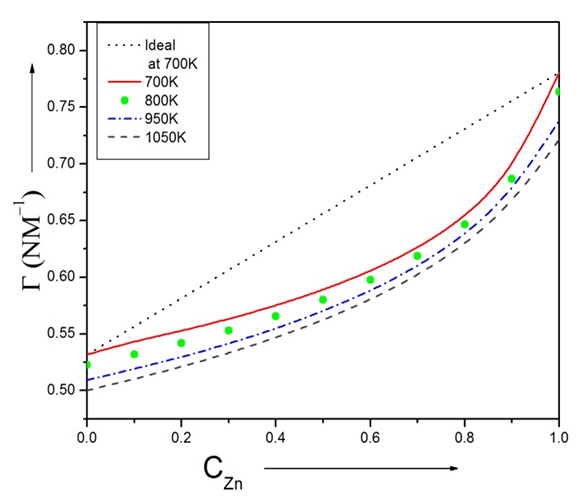
 | Figure (8). Surface concentration of Zinc ( CZnS ) versus the bulk concentration of Zinc (CZn) of alloy Zn-In alloy at temperatures 700K, 800K, 950K and 1050K using Layered Structure approach |
 versus the Concentration of Zinc of the alloy Zn-In is shown in figure (9) using Layered Structure approach at temperatures 700K, 800K, 950K and 1050K which shows temperature dependence.
 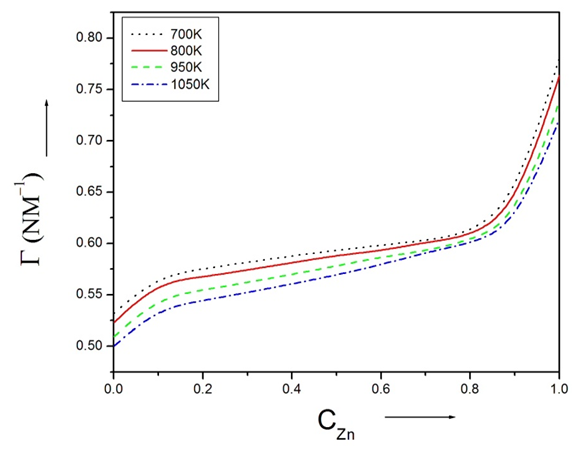 | Figure (9). The surface tension  versus concentration of Zn of Zn-In alloy at temperatures 700K, 800K, 950K, 1050K using Layered Structure approach versus concentration of Zn of Zn-In alloy at temperatures 700K, 800K, 950K, 1050K using Layered Structure approach |
3.6. Viscosity
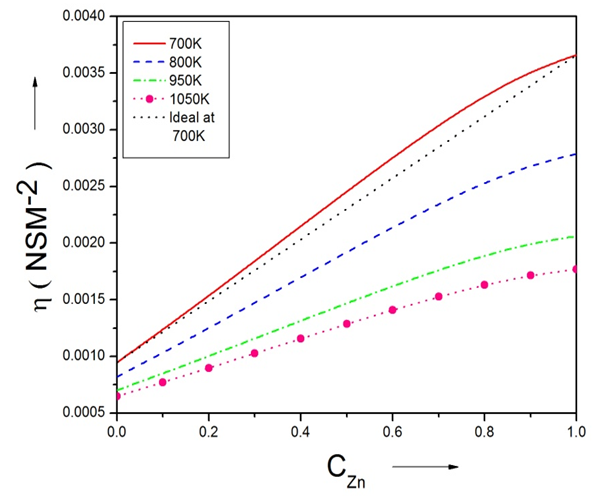
- The viscosity of alloys at temperatures 700K, 800K, 950K and 1050k are computed using Moelwyn-Hughes equation [3], [23] with the help of heat of mixing (HM) at temperatures 700K, 800K, 950K and 1050K.Viscosity of pure components i.e. Zn and In at temperature T (T =700K, 800K, 950K, 1050K) of the alloy are calculated using equation (15) with the help of the value of the constants E and 𝜂ok for the metals [15]. And, heat of mixing (HM) at temperature T (T =700K, 800K, 950K, 1050K) are obtained using equation (12) in conjugation with equations (7) and (9) with the help of optimized values of interchange energy parameters(ω) presented on table 2. The viscosity of pure component of Zinc is greater than the viscosity of pure component of Indium in the alloy at temperature T. As the concentration of Zinc component in the alloy increases, the viscosity of the alloy increases at temperature T. The plot of the viscosity at different temperatures (i.e. 700K, 800K, 950K and 1050K) with the concentration of Zinc is shown in the figure (10).
 | Figure (10). The viscosity of Zn-In liquid alloy versus concentration of Zinc at temperatures 700K, 800K, 950K, 1050K using Moelwyn-Hughes equation |
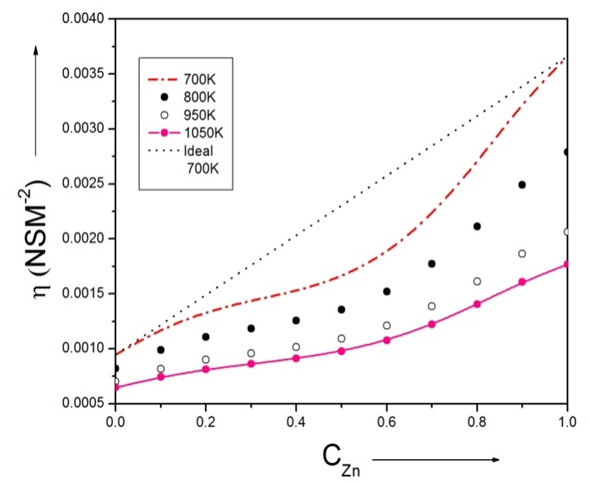
 | Figure (11). The viscosity of Zn-In liquid alloy versus concentration of Zinc at temperatures 700K, 800K, 950K, 1050K using Singh and Sommer’s Formulation |
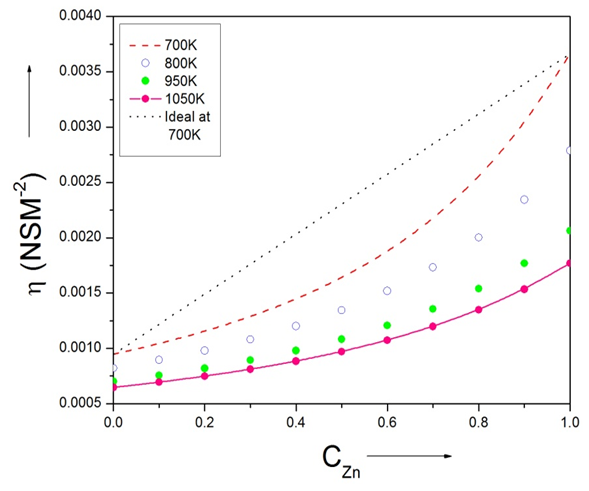 | Figure (12). The viscosity of Zn-In liquid alloy versus concentration of Zinc at temperatures 700K, 800K, 950K, 1050K using Kaptay equation |
4. Conclusions
- The interchange energy and size factor are temperature dependent which play important role in the mixing properties of the alloy using Flory’s model. The alloy is symmetric and segregating in nature. Thermodynamic property of the alloy is temperature dependent. The surface tension and viscosity of the alloy are temperature dependent and decrease as the temperature of study increase at each concentration range. The optimization method is useful to obtain a consistent set of theoretical model parameters which gives idea to predict into temperature and concentration region in which the direct experimental determination is unavailable.