Kelechukwu C. N. Dozie
Department of Statistics Imo State University, Owerri, Imo State, Nigeria
Correspondence to: Kelechukwu C. N. Dozie , Department of Statistics Imo State University, Owerri, Imo State, Nigeria.
| Email: |  |
Copyright © 2020 The Author(s). Published by Scientific & Academic Publishing.
This work is licensed under the Creative Commons Attribution International License (CC BY).
http://creativecommons.org/licenses/by/4.0/

Abstract
This paper examines the Buys-Ballot estimation procedure for time series decomposition when the trending curve is linear and admits mixed model. The main objective is to obtain the row, column and the overall means of Buys- Ballot table for the mixed model. The method adopted is Buys-Ballot procedure developed for choice model, estimation of trend parameter and seasonal indices by [1]. Results of the computed values of the estimated trend parameters and seasonal indices are given in table 3.
Keywords:
Descriptive time series, Mixed model, Trend Parameter, Seasonal Indices, Buys-Ballot Estimate
Cite this paper: Kelechukwu C. N. Dozie , Buys-Ballot Estimates for Mixed Model in Descriptive Time Series, International Journal of Theoretical and Mathematical Physics, Vol. 10 No. 1, 2020, pp. 22-27. doi: 10.5923/j.ijtmp.20201001.03.
1. Introduction
[2] proposed two methods of estimating the parameter of a linear trend-cycle component from the periodic means of the Buys-Ballot table (table 1). This method was initially developed for short period of time in which the trend-cycle component  is jointly combined and can be represented by linear equation
  where a is the intercept, b is the slope and t is the time point.The models most commonly used for time series decomposition are theAdditive Model:
 | (1) |
Multiplicative Model:  | (2) |
and Mixed Model | (3) |
If short period of time are involved, the cyclical component is superimposed into the trend [3] and the observed time series  can be decomposed into the trend-cycle component
  , seasonal component
  and the irregular/residual component
  . Therefore, the decomposition models areAdditive Model:
  | (4) |
Multiplicative Model:  | (5) |
and Mixed Model  | (6) |
It is always assumed that the seasonal effect, when it exists, has period s, that is, it repeats after s time periods. | (7) |
For Equation (4), it is convenient to make the further assumption that the sum of the seasonal components over a complete period is zero, ie, | (8) |
Similarly, for Equations (5) and (6), the convenient variant assumption is that the sum of the seasonal components over a complete period is s. | (9) |
1.1. Buys-Ballot Procedure for Time Series Decomposition
According to [3] the successive periodic mean  provide a simple description of the underlying trend from the methods of monthly or quarterly means. It was shown that the estimates of the seasonal indices can be obtained from the column means
  Therefore, while the periodic means give estimate of the trend, the column means gives estimates of seasonal indices. It has been observed that a time series theoretically contains four components, However, if short period time are involved, the trend components is estimated into the cyclical and we obtain a trend cycle components denoted by
  . Under these conditions, it can be stated that estimates of trend-cycle and seasonal components can be obtained from the row and column means, respectively, of the Buys-Ballot table. These estimates have been designated “Buys-Ballot” estimates in this study the details of the procedure for estimation of the trend-cycle component
  are presented in section 2 for the mixed model.The method has developed, we have restricted our discussions to the case, where the trend-cycle component is a straight line. That is
  The Buys - Ballot table helps in the assessment of the trend – cycle and seasonal indices of time series data. The row means
  estimate trend, and the differences
  or the ratio
  between the column means
  and the overall mean
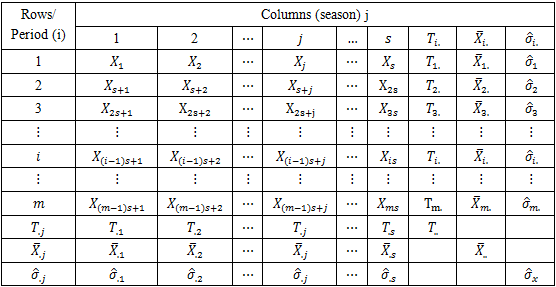
  estimate the seasonal indices. [4], showed seasonal variation (Table 1) of the Buys - Ballot table. According to them, each row is one period (usually a year) and each column is a season of the period/year (4 quarter, 12 months etc). A cell,
  of the table contains the mean value for all observations made during the period
  at the season
  To analyse the data, it is important to include the period and seasonal totals
  and
and  period and seasonal averages
  and
and  period and seasonal standard deviations
  and
and  as part of the Buys – Ballot table. Also included for purposes of analysis are the grand total
  grand mean
  and pooled standard deviation
2. Buys-Ballot Estimates for Mixed Model
This section considers the Buys-Ballot estimation procedure for trend and seasonal indices for mixed model in descriptive time series analysis when trend-cycle component is linear. Section 2.2 treats Buys-Ballot estimation procedure for trend, Section 2.3 discuss the Buys-Ballot estimation procedure for seasonal indices. Table 1. Buys - Ballot Table for Seasonal time series
 |
| |
|
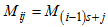
In this arrangement each time period t is represented in terms of the period i (e.g. year) and season j (e.g. month of the year), as  . Thus, the period (row), season (column) and overall totals, means and variances are defined as
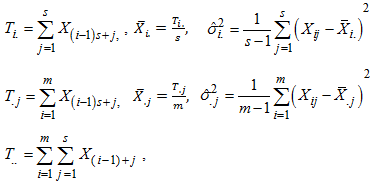
2.1. Buys-Ballot Procedure for Estimation of Trend
In developing this procedure we have restricted our discussion to the case where the trending curve is linear. We also assume that the length of periodic interval is s. Based on these, we obtain the following row and overall averages for the mixed model. (6). Recall, for the mixed model,  and
and  . When arranged in a Buys-Ballot table, with m-rows and s-columns

 . Therefore
  in (6) becomes
 | (10) |
For convenience, let  ,
,  and
and  . Hence,
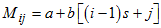 | (11) |
and | (12) |
The row total is 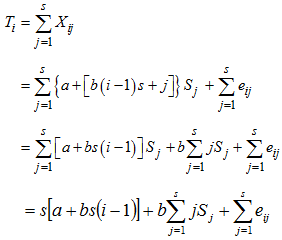 | (13) |
Hence, the row mean is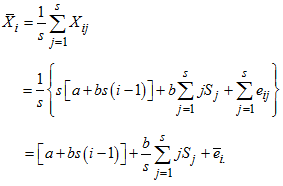 | (14) |
where 
2.2. Buys-Ballot Procedure for Estimation of Seasonal Component
We restrict our discussion of the Buys- Ballot procedure for estimation of seasonal component to the case where trend-cycle component of time series linear. The length of periodic interval is also taken to be s. Based on these, we obtain the following column and overall totals and averages for the mixed model.The column total is 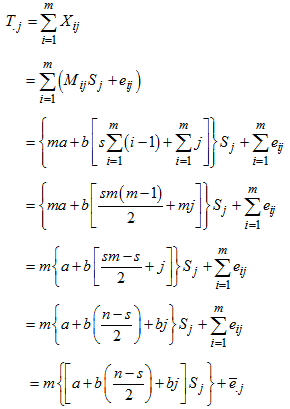 | (15) |
Hence, the column mean is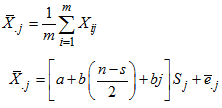 | (16) |
where  overall mean
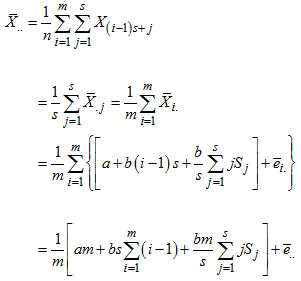 where
where 
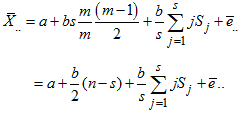 | (17) |
3. Estimation of Trend Parameters
We use the row means and overall means to estimate the parameters of the trend line. For mixed model 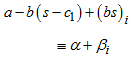 | (18) |
where 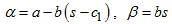
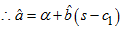 | (19) |
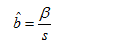 | (20) |
Again it reduces to  | (21) |
when there is no trend. That is, when  is estimated using the grand mean
3.1. Estimates of 
Here, we use column averages and overall averages to estimate the seasonal indices. For mixed model, using (16)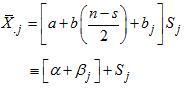 | (22) |
where  | (23) |
 | (24) |
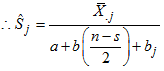 | (25) |
when there is no trend  , we obtain from (16) that
 | (26) |
4. Real Life Example
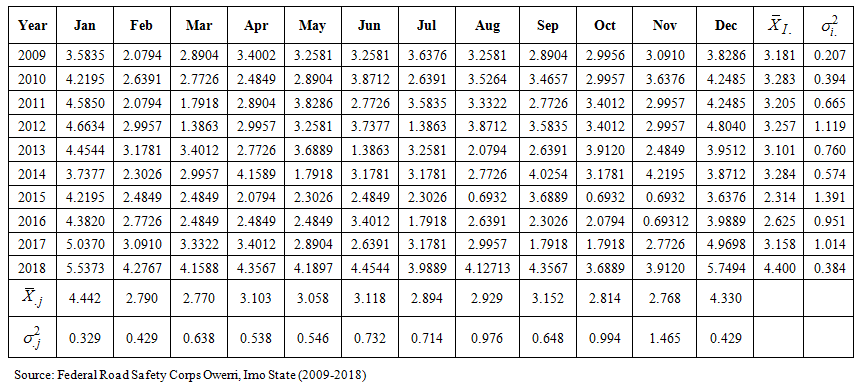
The real life example is based on monthly data on number of road traffic accident collected from Federal Road Safety Commission (FRSC) Owerri, Imo State, Nigeria for the period 2009 to 2018 shown in Appendix A. The series of 120 observations has been arranged in a Buys-Ballot table as monthly data (s = 12) and for 10years (m = 10). The time plots for the original and transformed series are given in figures 4.1 and 4.2 respectively. The expression of linear trend and seasonal indices for the mixed model is given as:Hence, 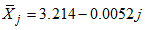 | (27) |
Using (23), (24) and (25)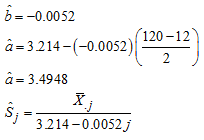
 | Figure 4.1. Time plot of the actual series on the number of road accidents between (2009-2018) |
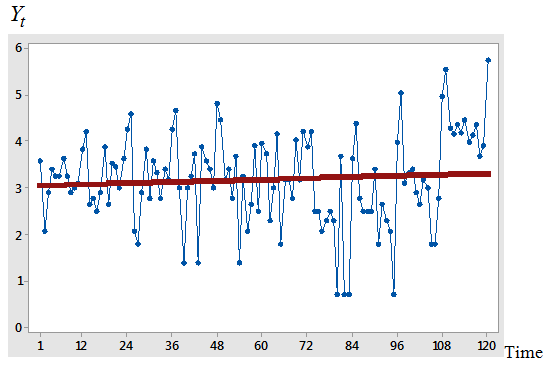 | Figure 4.2. Time plot of the transformed series on the number of road accidents between (2009-2018) |
Table 2. Estimates of Seasonal indices
 |
| |
|
5. Summary, Conclusions and Recommendations
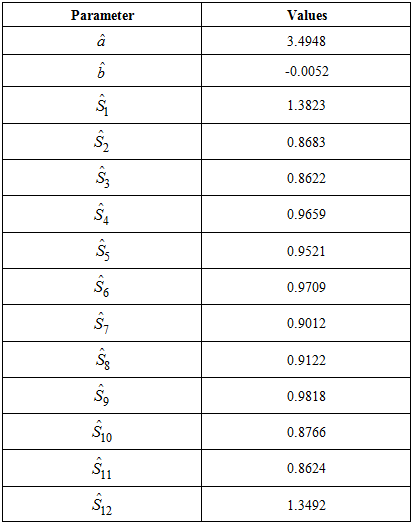
We have outlined the Buys-Ballot Procedure for the estimation of trend-cycle and seasonal indices for time series decomposition. This procedure is computationally simple when compared with other descriptive methods. The values of the estimated trend parameters and seasonal indices are easily computed and the results given in Table 3. No attempt has been made to discuss this method when the trend-cycle component is not linear or when the trend is separated from the cyclical component. Therefore, further research in these directions are recommended.Table 3. Estimates of Parameters of Trend and Seasonal Indices for Mixed model
 |
| |
|
Appendix A
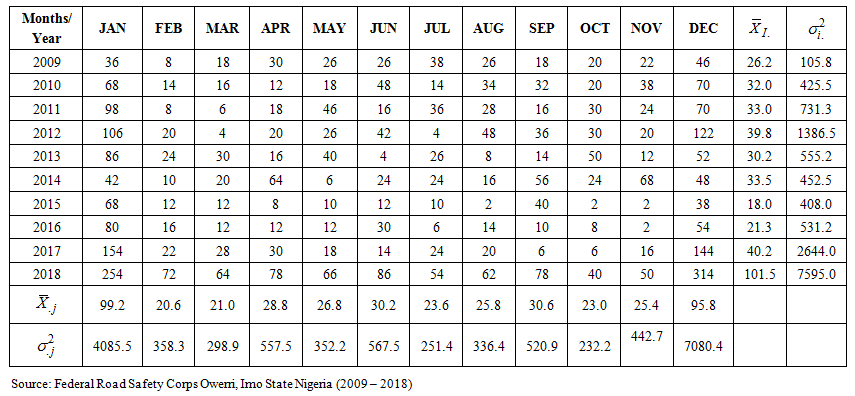 | Buys-Ballot table for the data on the number of road accidents (2009-2018) |
Appendix B
 | Buys-Ballot table for the transformed data on the number of road accidents (2009-2018) |
References
| [1] | Iwueze, I. S. & Nwogu, E.C. (2014). Framework for choice of models and detection of seasonal effect in time series. Far Far East Journal of Theoretical Statistics 48(1), 45– 46. |
| [2] | Iwueze, I. S. & Nwogu E.C. (2004). Buys-Ballot estimates for time series decomposition, Global Journal of Mathematics, 3(2), 83-98. |
| [3] | Chatfield, C. (2004). The analysis of time Series: An introduction. Chapman and Hall,/CRC Press, Boca Raton. |
| [4] | Iwueze, I.S., Nwogu, E.C., Ohakwe, J. & Ajaraogu J.C. (2011). Uses of the Buys – Ballot table in time series analysis. Applied Mathematics Journal 2, 633 –645. |

 Abstract
 Reference
 Full-Text PDF
 Full-text HTML