-
Paper Information
- Next Paper
- Previous Paper
- Paper Submission
-
Journal Information
- About This Journal
- Editorial Board
- Current Issue
- Archive
- Author Guidelines
- Contact Us
International Journal of Theoretical and Mathematical Physics
2012; 2(3): 37-40
doi: 10.5923/j.ijtmp.20120203.03
Study of Centrality with New Method in Nucleus-Nucleus Collisions at 4.2 A Gev/C
 Abstract
 Reference
 Full-Text PDF
 Full-Text HTML
Z. Wazir 1, M. Fakhar-e-Alam 1, W. A. Syed 1, S.A.Khan 2, M.A.Rafih Amer 3
1Department of Physics, International Islamic University, Islamabad
2National Centre for Physics, Islamabad, Pakistan
3Riphah International University, Islamabad.
Correspondence to: Z. Wazir , Department of Physics, International Islamic University, Islamabad.
| Email: |  |
Copyright © 2012 Scientific & Academic Publishing. All Rights Reserved.
We used a method based on Random Matrix Theory to analysis the simulation data on 12CC collisions at 4.2 A GeV/c generated from ultra relativistic Quantum Molecular Dynamics code1.3.The results are associated with the onset of region of central collisions by observed changes in the nearest-neighbor momentum spacing distributions for different secondary particles multiplicities.
Keywords: Random Matrix Theory, Nearest Neighbor Momentum Spacing Distributions, Ultra Relativistic Quantum Molecular Dynamics
1. Introduction
- Phase transition in nuclear matter at relativistic energies is one of the main subjects in experimental high energy physics. Different characteristics of particle production at nuclear-nuclear collisions depending on the centrality of collisions[1–6] but centrality cannot be defined experimentally; it can only be calculated indirectly. In different experiments[1-6] the centrality is defined by different parameters e.g.; as a number of identified protons, projectile and target fragments, slow particles, all particles, as the energy flow of the particles with emission angles equal 0◦ or 90◦, etc. Glauber approach[7] which contains some theoretical approximations enables one to establish approximately the centrality with the aid of the impact parameter b and the multiplicity of identified secondary charged particles in experiments. But, in this case, however, there is a model dependent definition of the centrality. So there are no unique criteria for the centrality measurement and get a true signal on the onset of a new phase of the hadronic matter.
2. Method
- In the proceeding report[8] it is demonstrated that some objects of Random Matrix Theory(RMT)[9,10] might be helpful in illustrating the phenomena of correlations in the spectral (momentum) distribution of secondary particles produced in nucleus-nucleus collisions at high energy. In fact it is a good approach in coordinating the results obtained with the standard analysis based on the method of effective mass spectra and two-pair correlation function used in the high energy physics[11]. It has been observed that the RMT approach does not depend on background measurements but depends only on fundamental symmetries preserved in nucleus-nucleus collisions. The objective of this paper is to introduce novel criteria for centrally collision, using a new method based on Random Matrix Theory(RMT)[8-11] that was actually introduced to explain the statistical fluctuations of neutron resonances in compound nuclei[16]. This theory assumes that the Hamiltonian belongs to an ensemble of random matrices which are consistent with the fundamental symmetries of the system. Besides these general symmetry considerations; there is no need to consider other properties of the system. It is assumed that the momentum distribution of secondary particles produced in nucleus-nucleus collisions may be associated with eigenstates (quantum levels) of a composite system. It is, therefore, natural to use the momentum as a proper variable for the analysis in order to avoid possible errors at the transformation from the momentum to the energy, which requires an accurate determination of the corresponding mass value[11].In general, this procedure does not involve any uncertainty or spurious contributions and deals with a direct processing of physical data. If the “events” are independent, i.e., correlations in the system under consideration are absent, the form of the histogram must follow the Poisson density. The Poisson spectrum corresponds to the dominance of many crossings between different energies (momenta). On the other hand, if the levels are repelled, the density is approximately given by the Wigner surmise form.In turn, the crossings are usually observed when there is no diffusion between the states that are characterized by different good quantum numbers, while the anti crossings signal about a strong mixing due to a perturbation brought about by either external or internal sources. In other words, any correlations that produce the deviation from the regular pattern (Poisson distribution): production of a collective state (resonance), or some structural changes in the system under consideration would be uniquely identified from the change of the histogram shape.To clearly recognize correlations the total set of spacings {si} has been divided on three sets, in correspondence with three regions of the measured momenta: a) 0.1 < |p| < 1.14 GeV/c (region I); b) 1.14 < |p| < 4.0 GeV/c (region II); c) 4.0 < |p| < 7.5 GeV/c (region III) (see Fig.1). The region boundaries were determined with the requirement that the shape of the spacing density P(S) does not change in the region under consideration. Note that there is no prescribed procedure how to define such regions. However, the empirical approach described above proved to be useful in data processing for various systems at the RMT analysis[9,12]. In the present paper the nearest-neighbor momentum spacing distribution P(S), related to all secondary particles are considered.
3. UrQMD
- To discard light on the production of the all secondary particles, a fully integrated Monte Carlo simulation package UrQMD (Ultra relativistic Quantum Molecular Dynamics model) have been employed[13]. The UrQMD model is aimed for simulation of nucleus-nucleus collisions at relativistic energies. Simulating the all secondary particles production in 12C+12C collisions at a momentum of 4.2A GeV/c.
4. Results and Discussions
- To see the behavior of the nearest neighbor spacing momentum distributions P(S) with multiplicity, the events has been divided in six stages: i) one with Nall = 10 − 14 all secondary particles; ii) the 2nd with Nall = 15 − 19 all secondary particles; iii) 3rd with Nall = 20 − 24 all secondary particles;iv) 4th with Nall = 25 − 29 all secondary particles; v) 5th with Nall = 30 − 34 all secondary particles; vi) and 6th with Nall = 35 − 40 all secondary particles. In this case the separation was also done according to the criteria discussed above.One evidently recognizes the onset of correlations for Nall = 10 – 14 and Nall = 15 – 19 all secondary particles with the increase of the absolute value of the momentum distribution (see Fig.1, top and middle row, from left to right). The onset of correlations in the interval 1.14 < |p| < 4.0 GeV/c (the region II), found in virtue of the RMT analysis, owes their origin to the protons produced as a result of decays of well known Δ++-isobars with masses mΔ++ = 1.232 and1.650 (GeV/c2)[11]. The presence of the sharp peak in the third interval 4.0 < |p| < 7.5 GeV/c (the region III) can be attributed to the interaction between stripping protons in the final state, which dominate in the peripheral collisions. Indeed, one could found that strong correlations are brought about by the protons pairs with zero angle in the momentum distribution interval 4.0 < |p| < 7.5 GeV/c. This interpretation becomes even more convincing with the increase of all secondary particles number (Nall = 20−24 and Nall = 25−29; see Fig.1&2, right column). With the increase of the multiplicity of all secondary particles, the number of the stripping protons decreases as shown in Fig.1&2. As a result, the correlations, brought about by these proton pairs, decreases as well. For the multiplicity Nall = 30−40 the distribution is neither the Poisson nor the Wigner surmise. Note, however, that the increase in the number of participant is associated with the onset of the central collisions.
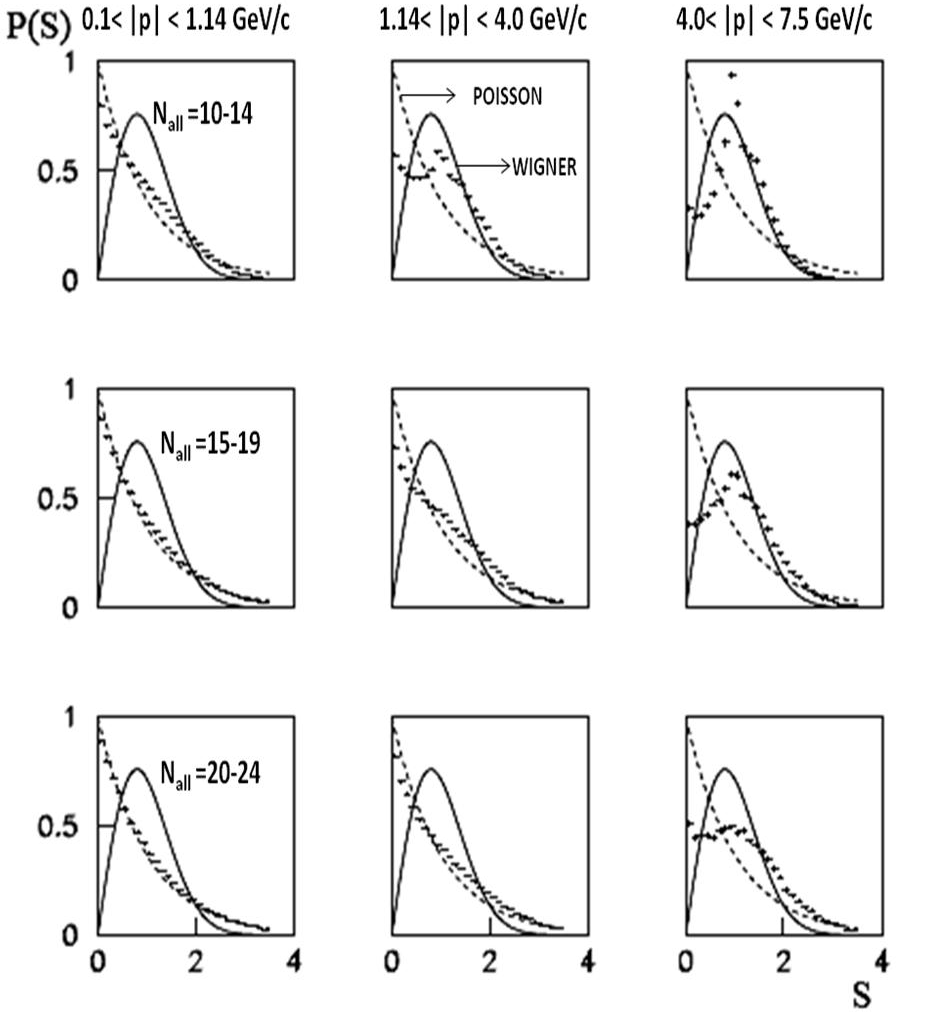 | Figure. 1. The P(S) distributions, based on the UrQMD results, for different regions of the momentum: the first column corresponds to 0.15 < |p| < 1.14 GeV/c; the second column corresponds to 1.14 < |p| < 4.0 GeV/c; the third column correspond to 4.0 < |p| <7.5 GeV/c. The P(S) distribution for different values of the all secondary particles: the top row corresponds to Nall=10–14; the middle row corresponds to Nall =15–19: the bottom row corresponds to Nall =20–24. The Poisson and the Wigner surmise distributions are connected by dashed and solid lines, respectively |
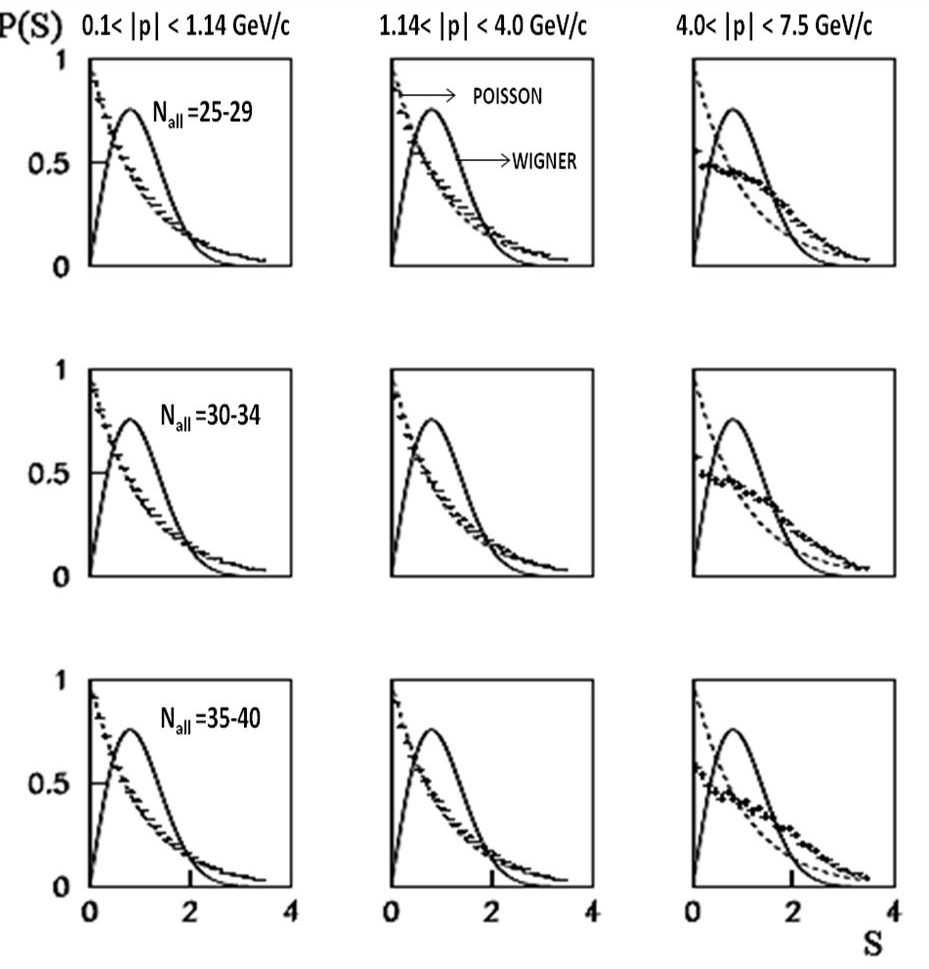 | Figure 2. The NNDs (histograms) P(S), based on the UrQMD results, for different regions of the momentum: the first column corresponds to 0.15 < |p| < 1.14 GeV/c; the second column corresponds to 1.14 < |p| < 4.0 GeV/c; the third column correspond to 4.0 < |p| <7.5 GeV/c. The NND distribution for different values of the all secondary particles: the top row corresponds to Nall=25–29; the middle row corresponds to Nall =30–34: the bottom row corresponds to Nall =35–40. The Poisson and the Wigner surmise distributions are connected by dashed and solid lines, respectively |
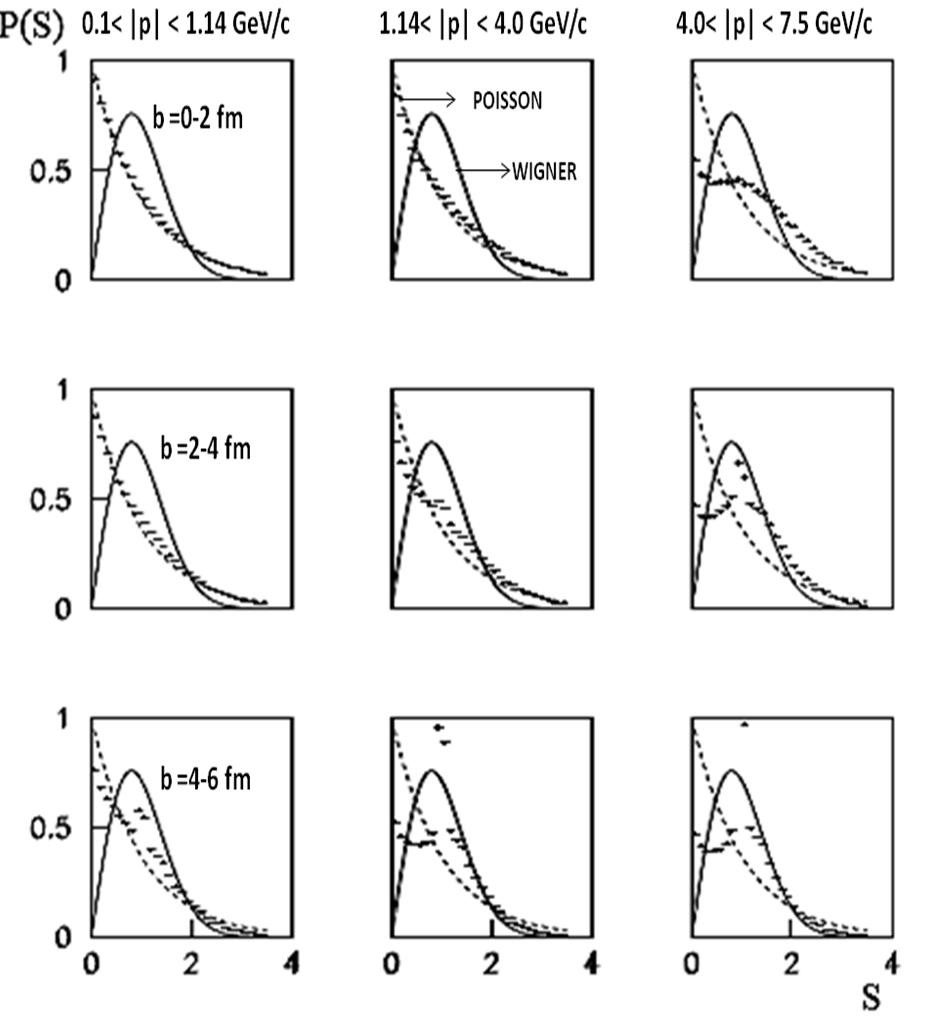 | Figure 3. The NNDs (histograms) P(S), based on the UrQMD results, for different regions of the momentum: the first column corresponds to 0.15 < |p| < 1.14 GeV/c; the second column corresponds to 1.14 < |p| < 4.0 GeV/c; the third column correspond to 4.0 < |p| <7.5 GeV/c. The NND distribution for different values of the impact parameter b: the top row corresponds to b=0–1; the middle row corresponds to b=1–2: the bottom row corresponds to b=2–3. The Poisson and the Wigner surmise distributions are connected by dashed and solid lines, respectively |
5. Conclusions
- It has been proposed novel criteria to define the centrality of the nucleus-nucleus collisions, using the procedure developed in the framework of the RMT approach. The transition from the Poisson distribution to the Wigner surmise distribution signals on the onset of correlations. In turn, the centrality of nucleus-nucleus collisions is associated with the absence of correlations.