-
Paper Information
- Paper Submission
-
Journal Information
- About This Journal
- Editorial Board
- Current Issue
- Archive
- Author Guidelines
- Contact Us
International Journal of Prevention and Treatment
p-ISSN: 2167-728X e-ISSN: 2167-7298
2019; 8(2): 41-45
doi:10.5923/j.ijpt.20190802.02

Circulating Osteoprotegerin Level in Relation to Obesity in Middle Aged Females
 Abstract
 Reference
 Full-Text PDF
 Full-text HTML
Doaa SE. Zaky1, Abeer AF. Ali1, Sabah E. Abd-Elraheem2, Suzan H. Abdel-Moniem1
1Internal Medicine Department, El-Azhar University, Cairo, Egypt
2Clinical Pathology Department, El-Azhar University, Cairo, Egypt
Correspondence to: Doaa SE. Zaky, Internal Medicine Department, El-Azhar University, Cairo, Egypt.
| Email: |  |
Copyright © 2019 The Author(s). Published by Scientific & Academic Publishing.
This work is licensed under the Creative Commons Attribution International License (CC BY).
http://creativecommons.org/licenses/by/4.0/

Background: Obesity is a major worldwide health hazard with adult mortality as high as 2.8 million per year. It is the second most common cause of preventable death after smoking. Obesity and bone metabolism are interrelated as both osteoblasts and adipocytes are derived from a common mesenchymal stem cell. Osteoprotegrin (OPG) is one of the bone regulator proteins (tumor necrosis factor (TNF)-related family) that regulates the differentiation and activation of osteoclasts. Objectives: The aims of the present study were to determine the circulating OPG serum level in adult middle-aged premenopausal obese females (in comparison to lean age matched females) and its relation to anthropometric measurements, lipid parameters and bone mineral density (BMD) in those females. Methods: A prospective cross-sectional observational study was carried out on 30 adult middle aged premenopausal females with simple obesity (without concomitant diseases) diagnosed by body mass index (BMI) ≥ 30 kg/m² according to WHO criteria 2012 and 20 age matched lean healthy females as control group. The obesity related anthropometric measurements was recorded. Bone mineral density (BMD) was measured using DEXA and serum OPG concentration was assessed using the ELISA immune-enzymatic method. Results: The current study reported significantly lower level of OPG in obese females in comparison to lean age matched females (9.54 ± 4.26 Vs13.1± 1.7 respectively, P = 0.001). There was a significant positive correlation between OPG serum concentration in obese females and waist hip ratio (WHR), however, no correlation was reported with BMI, waist circumference (WC), lipid parameters or BMD. Conclusion: OPG concentration was low in obese middle aged females and probably cannot play a protective role in bone metabolism in those females.
Keywords: Osteoprotegrin, Obesity, Bone Meneral Density
Cite this paper: Doaa SE. Zaky, Abeer AF. Ali, Sabah E. Abd-Elraheem, Suzan H. Abdel-Moniem, Circulating Osteoprotegerin Level in Relation to Obesity in Middle Aged Females, International Journal of Prevention and Treatment, Vol. 8 No. 2, 2019, pp. 41-45. doi: 10.5923/j.ijpt.20190802.02.
Article Outline
1. Introduction
- Obesity is a serious public health problem that linked to many prevalent medical problems worldwide as type 2 diabetes, hypertension, coronary artery disease and cognitive dysfunction [1]. Obesity is usually a product of unhealthy lifestyle and poor dietary habits. Women’s obesity is of particular concern due to its deleterious effects on contraception and fertility. Maternal obesity is associated with higher rates of cesarean section with increased risk of neonatal mortality and malformations. Moreover, obese women are at higher risk for multiple cancers, including endometrial, cervical and breast cancer [2]. However, obesity in women is associated with a lower risk of osteoporosis [3].Obesity and bone metabolism are interrelated as both osteoblasts and adipocytes are derived from a common mesenchymal stem cell and agents inhibiting adipogenesis stimulate osteoblast differentiation and vice versa [4]. Obesity has been considered as a protective factor for osteoporosis as bone mineral density (BMD) increases with weight. Leptin, as one of adipokines, is thought to mediate the effects of fat mass on the bone by direct stimulation of osteoblast activity and inhibition of osteoclast generation [5].Osteoprotegerin (OPG) is an α tumor necrosis factor receptor superfamily glucoprotein that acts as a decoy receptor for the receptor activator of nuclear factor kappa B ligand (RANKL) to exert an anti-resorptive bone effect [6]. It is a potent inhibitor of osteoclastogenesis through inhibition of osteoclast differentiation, suppression of the activation of the mature osteoclast and induction of apoptosis [7]. The OPG/RANKL system plays also an active role in pathological angiogenesis and inflammation as well as cell survival [8]. OPG is produced by a variety of tissues including heart, arteries, lung, kidney, intestine, and bone [9] and its expression is regulated by a wide array of factors, such as TNF- α, interleukin-1 and 18, TGF- β, and 17 β-estradiol [10].Increased OPG production represents an early event in the development of diabetes mellitus and was also elevated in metabolic syndrome and positively correlated to insulin resistance [11]. OPG/RANKL system can also mediates vascular calcification and development of atherosclerosis and coronary artery diseases [12]. Obesity is an important risk factor for diabetes, metabolic syndrome and cardiovascular disease, but data on the estimation of OPG concentrations and its effect on bone mass in obese women are scarce and great discrepancies among results are present.The aims of the present study were to evaluate the OPG serum level in adult middle aged premenopausal obese females (as compared to lean healthy female controls) and to estimate the relationship between OPG and anthropometric measurements, lipid parameters and bone mineral density (BMD) estimated by DEXA in those obese females.
2. Subjects and Methods
2.1. Study Participant
- This was a prospective cross-sectional observational study conducted at Al-Zahraa hospital, Al-Azhar University, Cairo, Egypt in the period between February to august 2016. The subjects included were 30 adult females with simple obesity (without concomitant diseases) diagnosed by BMI ≥ 30 kg/m² according to WHO criteria 2012 [13]. The study also included 20 age matched lean healthy females as control group. The patients were recruited from internal medicine out-patient clinic. Informed consents were obtained from all study participants in advance. All procedures were performed in accordance with the guidelines in the Declaration of Helsinki and approved by Research Ethics Committee of Faculty of Medicine for Girls, Al-Azhar University. Exclusion criteria were cigarette smoking, diabetes mellitus, hypertension, ischemic heart disease, kidney disease, acute sever infection, musculoskeletal disorders and malignancy. Anthropometric measurements were assessed in all patients, who were wearing light clothes, without shoes, in the morning. Body Mass Index (BMI) was calculated using the equation BMI = weight (in kilograms) divided by the square of the height (in meters). BMI ranged from 30 to 34.9 was considered as class 1 obesity, from 35 to 39.9 as class II obesity and ≥ 40 as class III obesity [13]. Waist circumference (WC) measured at the approximate midpoint between the lower margin of the last palpable rib and the top of the iliac crest at the end of a normal expiration. WC ≥ 80 cm in females considered central obesity [14]. Hip circumference measured around the widest portion of the buttocks. Waist hip ratio (WHR) ≥ 0.85 cm in females carry a substantially increased risk of metabolic disease [14]. Blood pressure was measured by sphygmomanometer after half an hour of physical rest in a sitting position.
2.2. Laboratory Investigations
- Morning peripheral blood sample was obtained after 12 hours fasting from each study participant to evaluate the selected biochemical parameters. Serum calcium (ca), albumin, urea, creatinine and liver enzymes (alanine amino-transferase (ALT), aspartate amino-transferase (AST)) were carried out on Dimension RxL Max analyzer (Siemens Healthcare GmbH - Henkestr. 127, 91052 Erlangen, Germany) by colorimetric techniques. C-reactive protein (CRP) was assessed by latex agglutination slide test, using Omega Diagnostics (Scotland, UK). Serum lipids was estimated using commercial kits (Abcam, Cambridge, MA, USA). Dyslipidemia were diagnosed when the plasma level of total cholesterol more than 200 mg/dl, LDL is ≥100 mg/dl, HDL less than 40 mg/dl, and triglycerides more than 150 mg/dl (according to the National Cholesterol Education Program (NCEP) adult treatment panel III Lipid profile). OPG concentration was assessed using the ELISA immune-enzymatic method (supplied from Glory Science., Ltd, USA).
2.3. Dual-energy X-ray Absorptiometry (DEXA)
- Bone mineral density (BMD) was measured for all participants using DEXA (Lunar Prodigy; GE Lunar, Madison, WI, United States) at lumbar spine (L1–L4). BMD values were expressed as absolute values (g/cm2) as well as the number of standard deviations (SD) from the mean of healthy, young, sex-matched individuals (T-score) and the number of standard deviations from the mean of healthy age-matched and sex-matched individuals (Z-score). Using International Society for Clinical Densitometry (ISCD) 2007 [15]; T-score of -2.5 or lower was defined as osteoporosis, from -1 to -2.5 as osteopenia and -1 or higher as normal. For BMD measurement in premenopausal women, Z‑scores of ≤ -1 SD was interpreted as low BMD for chronological age and those above -1.0 as within the expected range for age.
2.4. Statistical Analysis
- Data were collected, revised and analysed by Microsoft Office 2003 (excel) and Statistical Package for Social Science (SPSS) version 16. The data are given as means ± SDs (standard deviations). Student’s T test and one-way analysis of variance (ANOVA) were used to compare the differences among the groups. Ranked spearman correlation coefficient test was used to measure the mutual correspondence between two values. Chi square test was used to determine the extent that a single observed series of proportions differs from a theoretical or expected distribution. The confidence interval was set to 95% and the margin of error accepted was set to 5%. So, the probability of error at (0.05) was considered significant and at 0.01 and 0.001 were highly significant.
3. Results
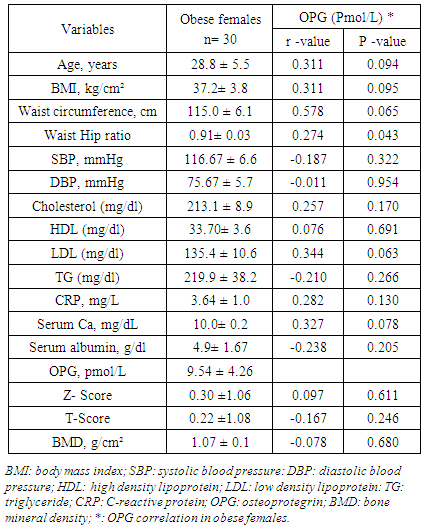
- The present study was enrolled 30 adult females diagnosed with simple obesity without concomitant diseases (mean age 28.8 ± 5.5 years, ranged from 24 to 40 years) and 20 age matched lean healthy females (mean age 29.5 ± 2.1, ranged from 28 to 36 years) P= 0.598. Demographic, clinical and biochemical characters of the obese females were presented in table 1.
|
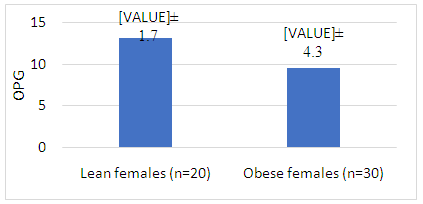 | Figure 1. Comparison between circulating OPG level in obese and lean females |
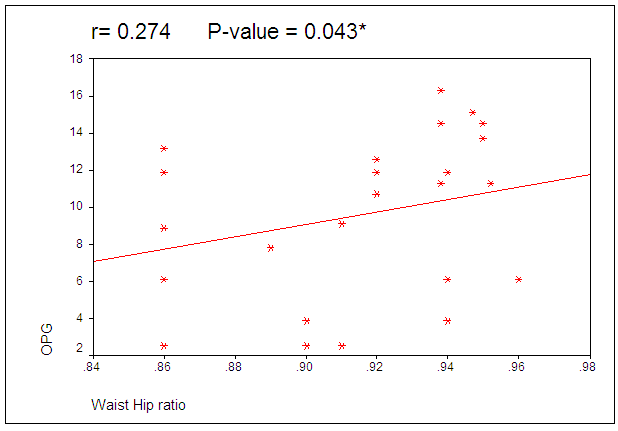 | Figure 2. Correlation between circulating OPG level and WHR in obese females |
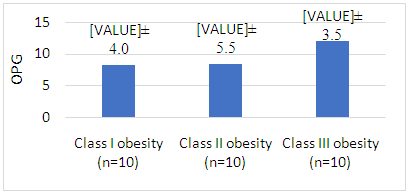 | Figure 3. Comparison between circulating OPG level in obese females according to BMI |
4. Discussion
- The current study reported significantly lower level of OPG in obese adult premenopausal females in comparison to lean age matched females. Lower serum OPG levels in obese women may be explained by higher serum parathyroid hormone (PTH) level that is linked to obesity, as PTH inhibits the expression of OPG [16]. It also may be related to lower activity of bone metabolism in obese women and less compensating production of OPG. Our data are on line with previous study in obese perimenopausal women that reported significant lower serum OPG, osteocalcin and 25-OH-D in comparison to healthy controls [17,18] and weight reduction therapy resulted in further decrease in OPG serum concentrations [18]. However, other contradictory results that compared obese and normal body weight individuals in terms of circulating OPG level reported no differences between them [19], but it significantly increased in obese adolescent subgroup which indicate increased serum OPG levels during puberty in obese individuals [20]. This contradiction between results may be related to the selection criteria as age, androgen and estrogen status which are significant determinants of OPG serum levels [21].Adipose tissue is anatomically distributed into two main compartments within the body with different metabolic characteristics: subcutaneous adipose tissue and visceral adipose tissue. Visceral adiposity is of importance owing to its association with various medical pathologies [22]. Despite the frequent use of BMI, it cannot distinguish between lean and fat body mass or subcutaneous and visceral fat compartments. However, WHR is significantly correlated to visceral adipose tissue (quantified by CT images taken in the abdominal region) [23]. As regard the correlation between serum OPG concentration and anthropometric measurements, our results revealed significant positive correlations between OPG serum concentration and WHR however, no correlation was reported with BMI or WC. WHR, rather than BMI or WC, is a predictor for obesity- related risk stratification (all-cause mortality) of high-functioning older adults, and possibly all older adults [24]. OPG may be the pathogenic link between WHR and obesity related risk stratification. The results of the present study were comparable to other study that revealed significant correlation between circulating OPG concentration and WHR, BMI and CRP concentration as well as insulin resistance in patients with metabolic syndrome [25]. The discrepancy in correlation to BMI may thus be a consequence of the study populations being characterized by different hormonal parameters in metabolic syndrome.Visceral obesity is associated with elevated triglycerides, low HDL cholesterol, and increased small, dense LDL particles [26]. In the present study despite positive OPG correlation with WHR, it did not correlate with TG, HDL or LDL. This data is consistent with previous in vitro studies reporting that oxidized LDL did not change OPG expression in human coronary artery smooth muscle cells [27] and lymphocytes [28].By contrast, a study in obese sub-Saharan African women revealed positive correlation of OPG with HDL and negative correlation with LDL which suggest its role as a marker of atherogenic risk in obese African women [29]. Moreover, other studies consider increased circulating and tissue OPG as a risk factor for atherosclerosis due to its proinflammatory and profibrotic effects on the vasculature [30]. One of limitations in the present study was inability to rule out unknown confounders that related to lipid levels as dietary habits or OPG as exercise.It was speculated that OPG as inhibitor of osteoclastogenesis may exert a protective role against osteoporosis in obese patients. The serum OPG level in the present study didn’t correlated to BMD which suggested that it has no protective role against osteoporosis in adult premenopausal women. Our data was consistent with others [17] reported that serum OPG concentration in obese perimenopausal women does not correlate significantly either with biochemical markers of bone turnover, calciotropic hormones or BMD. However, it contradicts a study of obese postmenopausal females that reported negative correlation between BMD mean T scores and OPG [31]. They introduced OPG as a diagnostic bone marker to discriminate females with reduced BMD from normal subjects. The contradicted results may be related to different hormonal pattern in pre and postmenopausal females.
5. Conclusions
- The serum OPG level in adult middle aged obese women is significantly lower in comparison to lean healthy controls and correlate positively with WHR. OPG does not correlate significantly with BMI, lipid profile or BMD in those patients, so, it probably cannot play a pathogenic role in dyslipidemia or protective role in bone metabolism in obese females.