-
Paper Information
- Paper Submission
-
Journal Information
- About This Journal
- Editorial Board
- Current Issue
- Archive
- Author Guidelines
- Contact Us
International Journal of Prevention and Treatment
p-ISSN: 2167-728X e-ISSN: 2167-7298
2018; 7(1): 6-13
doi:10.5923/j.ijpt.20180701.02

Knee Range of Motion Inversely Correlated with Body Mass Index and Blood Glucose in Sedentary Adults
 Abstract
 Reference
 Full-Text PDF
 Full-text HTML
Fairservice A., Massei M., Riggs M., Burton L., Zeine R.
Saint James School of Medicine, Park Ridge, IL, USA
Correspondence to: Fairservice A., Saint James School of Medicine, Park Ridge, IL, USA.
| Email: |  |
Copyright © 2018 The Author(s). Published by Scientific & Academic Publishing.
This work is licensed under the Creative Commons Attribution International License (CC BY).
http://creativecommons.org/licenses/by/4.0/

Background: Restricted knee range of motion (ROM) is an important clinical manifestation in rheumatological and orthopedic conditions, including arthritis and obesity. This study explores the relationships between Body Mass Index (BMI), blood glucose levels, and knee ROM in sedentary adults versus those who are physically active. Design: A total of 70 adults, 27 male and 43 female, between the ages of 22 and 46 participated. Participants were assigned into either active or sedentary subgroups based on self-reported activity levels (hours active/week). Knee ROM was measured by goniometry, weight, height, and blood glucose were measured, and BMI was calculated. Statistical analysis was performed using Pearson correlation coefficient and unpaired Student’s t-test. Results: The degree of knee flexion showed a significant moderate negative correlation with BMI in both the active (r = -0.58, p < 0.001) and the sedentary (r = -0.64, p < 0.001) groups. The decrease in knee flexion was more pronounced in the sedentary subgroup with a decrease of 0.52 degrees for each kg/m2 increase, as compared to a decrease of 0.32 degrees for every kg/m2 increase in the active group. Knee flexion also showed a trend for a minimally negative correlation with blood glucose in the sedentary (r=-0.15), but not in the active subgroup (r = 0.003). Knee extension in the sedentary subgroup also showed a trend for a minimally negative correlation with BMI (r = -0.05) and blood glucose (r = -0.12). However, the trend was reversed in the active subgroup in which knee extension showed minimal to weak positive correlations with BMI (r = 0.17) and blood glucose (r = 0.03). Conclusion: Knee ROM was restricted in participants with increased BMI and blood glucose. The effects were more pronounced in knee flexion as compared to knee extension, and in sedentary as compared to active adults. Findings are consistent with a role for metabolic factors in joint degeneration.
Keywords: Range of Motion, Osteoarthritis, Knee Flexion, Knee Extension, Blood Glucose, Body Mass Index
Cite this paper: Fairservice A., Massei M., Riggs M., Burton L., Zeine R., Knee Range of Motion Inversely Correlated with Body Mass Index and Blood Glucose in Sedentary Adults, International Journal of Prevention and Treatment, Vol. 7 No. 1, 2018, pp. 6-13. doi: 10.5923/j.ijpt.20180701.02.
Article Outline
1. Introduction
- Maintaining adequate joint mobility is necessary for the completion of everyday tasks [1]. Unfortunately, a societal shift to more sedentary lifestyles has contributed to diminished joint functioning primarily influenced by deficits in physical activity [2]. There are many predisposing factors influencing joint mobility, especially within the knee joint [1]. Currently one of the major health concerns in North America is overweight and obesity, both of which have been shown to negatively influence joint mobility and contribute to degenerative diseases [2]. Per the World Health Organization [3], “overweight and obesity are defined as abnormal or excessive fat accumulation that presents a risk to health.” The etiology of obesity is multifactorial; however, the condition is generally caused by an imbalance between energy consumption and expenditure (i.e., unhealthy dietary practices and/or limited physical activity) [4]. Obesity is commonly measured by body mass index (BMI) calculation: a person’s weight in kilograms divided by his/her height in meters squared [3]. For adults, overweight is classified as BMI greater than or equal to 25kg/m2, and obesity greater than or equal to 30kg/m2 [3]. The body’s fat content consists of fatty acids, which can be synthesized from glucose [5]. It has been shown that increases in blood glucose leads to an increase in BMI [6]. High blood glucose can lead to lipogenesis and eventual weight gain [5]. Insulin plays an important role in the uptake of glucose into cells to be used for energy, and aids in the normalization of blood glucose in a healthy individual after consuming a large quantity meal [5]. Additionally, increased body weight (i.e., obesity) can lead to insulin resistance because as the body accumulates more fat, the number of insulin-sensitive receptors decreases [6]. This process can eventually lead to the development of Type 2 diabetes mellitus (DM) [7]. Obesity can also lead to chronic inflammation, which is linked to Type 2 DM and metabolic syndrome [8]. Limited joint mobility has also been recognized as the most common and earliest long-term complication of Type 2 DM [9]. Although the effect on knee mobility in Type 2 DM does not appear to be documented, Rao et al. [10] compared ankle range of motion (ROM) and stiffness while measuring the effect of knee flexion in patients with Type 2 DM. Individuals with Type 2 DM revealed lower dorsiflexion and higher passive ankle stiffness than non-diabetic individuals. Ankle ROM measurements are usually taken with the knee in 10-25 degrees of flexion, and it was found that knee flexion in both patients with and without Type 2 DM provided an increase in ankle dorsiflexion [10]. This demonstrates the importance of knee mobility on other joints as well as itself. Aside from Type 2 DM, obesity has been correlated to several other chronic diseases, such as osteoarthritis (OA). It is believed that OA is one of the leading causes of pain and chronic disability and can be characterized by the degeneration of hyaline cartilage [11]. Hyaline cartilage, referred to as articular cartilage when on the articulating surfaces of bones, provides a cushion to transfer the load of weight bearing movements between bones [12]. Blood vessels and nerves do not supply articular cartilage, making it very difficult to repair once damaged [12]. Cartilage needs regular joint movement in order to maintain a healthy metabolism, and inactivity can lead to degradation of cartilage through build up of degrading enzymes like metalloproteinase [12]. Inactivity often leads to weight gain, and research has shown associations with OA and increased BMI (i.e., obesity), especially in patients with knee OA [13-15]. Lohmander et al. [15] found that 36% of those with hip OA and 50% of those with knee OA have obesity. Obesity has also been linked to a varus knee misalignment, which puts more pressure on the medial compartment of the knee joint [16, 17]. Also, each additional kilogram of body weight on top of a healthy weight based on BMI amplifies the compression on the knee joint four fold during activity [16]. This increased load on the medial compartment can intensify the cartilage loss in the knee, thus assisting the process of OA development [17]. Due to these effects of excess weight on the knee joint, it is important to identify other factors that could lead to development of OA so that they may be treated and/or prevented. The early stages of OA are especially important to identify in young patients, as preventive treatment could be initiated to slow or reverse the disabling effects of the disease [18]. In young patients, OA is often related to a poor biomechanical environment due to excess pressure on the joint [15]. This excess pressure can be due to factors such as excess weight or joint instability, which can predispose the articular cartilage to premature degeneration [19]. Joint stability can be defined as “the ability of a joint to maintain the appropriate functional position throughout its range of motion” [20]. Joint instability, or laxity, can shift the load bearing area (i.e., the center of the joint) to the peripheral area, which can result in overloading of the articular cartilage [18]. The normal ROM of the knee is 120 degrees for flexion and 0 degrees for extension [1, 21]. Thus, any exceeding range could be considered joint laxity, and potentially risk articular cartilage damage to the knee joint. Given the increasing prevalence and disabling effects of knee OA [18, 22], and seemingly higher correlation to BMI than other forms of OA [15], the purpose of this study was to investigate correlations amongst blood glucose levels, body mass index, and knee ROM in sedentary adults. To determine differences in performance, a comparison group consisting of active adults was also examined. Our working hypothesis was that sedentary adults would reveal decreased ROM (flexion/extension) in association with higher BMI and glucose levels, while active adults would exhibit improved ROM (flexion/extension) in association with lower BMI and glucose levels. Furthermore, the active group would be expected to exhibit a greater ROM as compared to the sedentary group.
2. Method
2.1. Participants
- Participants were recruited via purposive sampling [20]. Upon approval from the school ethics committee, the primary researchers recruited students and faculty members of Saint James School of Medicine (St. Vincent campus). No members of the general public were recruited and those interested were instructed to contact the primary researchers through email. To be included in this study, adult male and female participants must have been younger than 65 and not be currently diagnosed with a musculoskeletal injury or health related condition by a certified healthcare provider. Activity levels were self-reported by the participants. The active group consisted of participants who met the criteria for “active” as determined by the American College of Sports Medicine [24] and Canadian Society for Exercise Physiology [25]. Essentially, active status is defined by performing at least 150 minutes of moderate-to-vigorous aerobic physical activity per week [25]. Participants failing to meet these criteria were placed into the sedentary group. All participants were excluded from the study if he/she had undergone any knee surgery within the past five years, had received any corticosteroid injections in the testing knee within the past year, had acute or chronic knee pain or edema, was taking any medications treating obesity, diabetes, and knee pain/edema, or had a history of elevated blood glucose and/or joint pain/inflammation (Table 1).
2.2. Procedure
- Participants were asked to commit to one 15-minute test session. After informed consent was obtained, all testing was conducted in the St Vincent campus Physical Diagnosis laboratory by the primary researchers who had previous clinical experience measuring BMI, knee ROM and blood glucose. Only one of the primary researchers measured knee ROM among all participants to increase the reliability of the measurements.
2.2.1. Blood Glucose
- The participants were asked to fast for two hours prior to testing. At the start of the test session, the participant’s fasting blood glucose level was then measured. A 70% solution of alcohol was applied to the puncture site for sterilization purposes. Once completed, blood was drawn from the participant’s index finger using a sterilized lancet. The blood specimen was then placed onto an Easy Touch Health Pro Glucose Monitoring System via the manufacturers guidelines. After this was completed, the participants’ BMI was calculated by measuring his/her height (m2) and weight (kg). Lastly, ROM of the knee was measured using a universal goniometer and included flexion and extension.
2.2.2. Range of Motion
- A goniometer is a simple clinical device that assesses joint ROM on the human body. Reliability and validity of the device has been well established in previous research and it is commonly used in the clinical setting [26, 27]. Measurements regarding ROM of the knee were adapted from previously reported procedures [28, 29]. To determine the testing leg, a coin was flipped with heads indicating right and tails indicating left. The same procedure was used to determine the initial order of measurement for knee flexion/extension. After the testing leg was determined, the lateral epicondyle was palpated and marked. This was used as reference for the positioning of the goniometer’s axis. Once the axis of the device was established, the proximal arm of the goniometer was then positioned along the femur in alignment with the greater trochanter. Additionally, the distal arm of the goniometer was positioned along the fibula in alignment with the lateral malleolus. Upon placement of the goniometer in the correct position, the participant was asked to actively extend the knee until the measurement was recorded. For knee flexion, the participant was instructed to actively flex his/her leg and hip so that the calcaneus of the foot is brought proximally to the gluteal muscles comfortably and until the measurement was recorded. The mean of three trials was recorded for knee flexion and extension [28, 29].
2.3. Design and Analysis
- The current study follows a cross-sectional design. To determine the relationship between variables, a Pearson product-moment correlation coefficient was evaluated. An independent samples t-test (α = .05) was also determined to examine intergroup differences between the active and sedentary participants. All statistical analyses were performed using Microsoft Excel© 2017, Version: 15.30.
3. Results
3.1. Participant Demographics
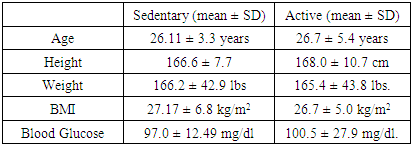
- A total of 70 adults participated, 27 males and 43 females. The 22 females and 15 males who were in the active subgroup had a mean age of 26.7 ± 5.4 years (22 to 46 years), height 168.0 ± 10.7 cm (151.5 to 185.5 cm), and weight 165.4 ± 43.8 lbs (97 to 300 lbs). The calculated average BMI for the active subgroup was 26.7 ± 5.0 kg/m2. The 21 females and 12 males who were in the sedentary subgroup had a mean age of 26.11 ± 3.3 years (22 to 37 years), height 166.6 ± 7.7 cm (152 to 190.5 cm), and weight 166.2 ± 42.9 lbs (105 to 332 lbs). The calculated average BMI for the sedentary subgroup was 27.17 ± 6.8 kg/m2 (Table 1).
|
3.2. BMI
3.2.1. Knee Flexion
- In the active subgroup, a moderately negative correlation was found between knee flexion and BMI that was statistically significant (r = -0.58, p < .05) (Figure 1). Similarly, in the sedentary subgroup, a statistically significant moderately negative correlation was also found between knee flexion and BMI (r = - 0.64, p < .05) (Figure 2).
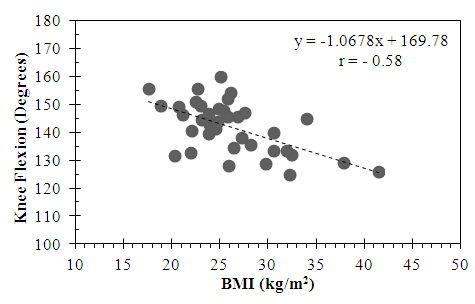 | Figure 1. Relationship between Knee Flexion and BMI in the Active Subgroup |
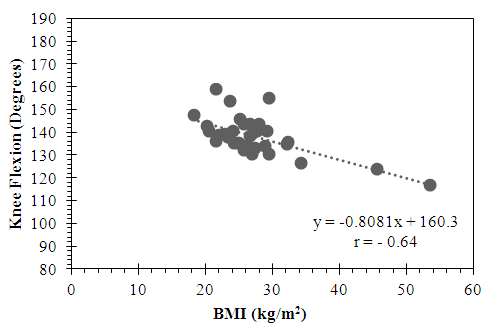 | Figure 2. Relationship between Knee Flexion and BMI in the Sedentary Subgroup |
3.2.2. Knee Extension
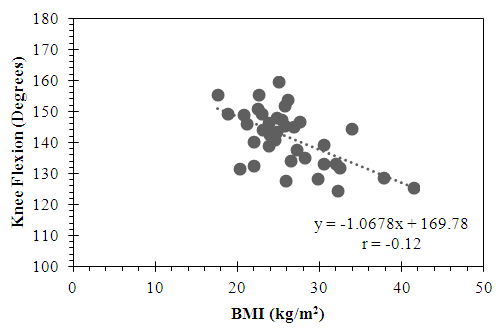
- The active subgroup showed a small positive correlation between knee extension and BMI, however, this did not reach statistical significance (r = 0.17, p = 0.2) (Figure 3). By contrast, the sedentary subgroup showed a trend for a minimally negative correlation, which did not reach statistical significance (r = -0.05, p = 0.75) (Figure 4).
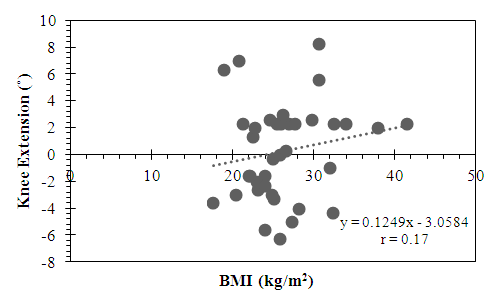 | Figure 3. Relationship between Knee Extension and BMI in the Active Subgroup |
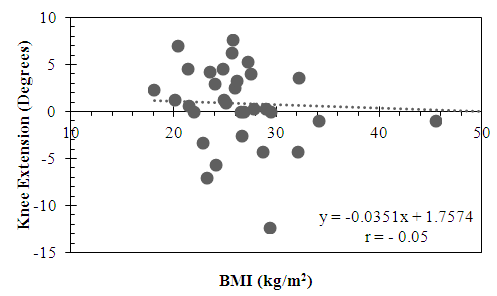 | Figure 4. Relationship between Knee Extension and BMI in the Sedentary Subgroup |
3.3. Blood Glucose
- The average blood glucose levels were 100.5 ± 27.9 mg/dl for the active subgroup, and 97.0 ± 12.49 mg/dl for the sedentary subgroup. A minimally positive correlation was revealed during knee flexion/extension for the active group and a minimally negative correlation was observed during knee flexion and extension for the sedentary group. These correlations however, did not reach statistical significance for knee flexor ROM (t (63) = -1.57, p = 0.12) or knee extensor ROM (t (63) = -0.61, p = 0.54).
3.3.1. Knee Flexion
- The active group showed a trend for a minimally positive correlation between knee flexion and blood glucose levels that did not reach statistical significance (r = 0.003, p = 0.82) (Figure 5). By contrast, the sedentary group showed a trend for a minimally negative correlation between knee flexion and blood glucose that also did not reach statistical significance (r = - 0.15, p = 0.40) (Figure 6).
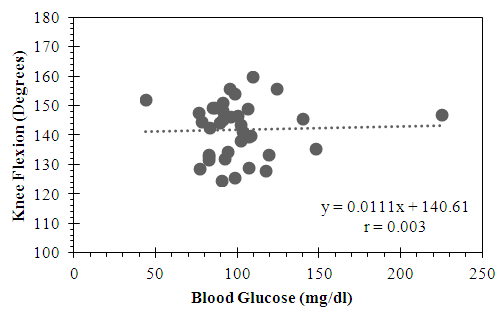 | Figure 5. Relationship between Knee Flexion and Blood Glucose in the Active Subgroup |
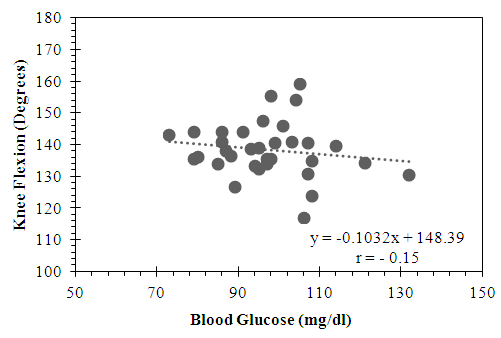 | Figure 6. Relationship between Knee Flexion and Blood Glucose in the Sedentary Subgroup |
3.3.2. Knee Extension
- Similarly, the active group showed a trend for a minimally positive correlation between knee extension and blood glucose that did not reach statistical significance (r = 0.018, p = 0.84) (Figure 7). Once again, by contrast, the sedentary group showed a minimally negative correlation between knee extension and blood glucose that also did not reach statistical significance (r = -0.12, p = 0.48) (Figure 8).
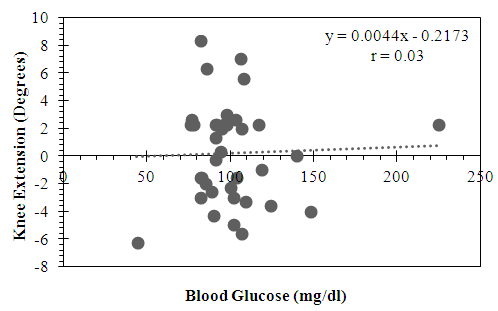 | Figure 7. Relationship between Knee Extension and Blood Glucose in the Active Subgroup |
 | Figure 8. Relationship between Knee Extension and Blood Glucose in the Sedentary Subgroup |
4. Discussion
- This study analyzed correlations between knee joint range of motion, BMI and blood glucose levels, in groups of sedentary and active adults.
4.1. BMI and Knee ROM
- A significant moderately negative correlation was found between BMI and knee ROM in both the active and sedentary groups; therefore, as BMI increased, knee flexion decreased. Although both groups were in the overweight category, the active group had greater knee flexion than the sedentary group. This supports the hypothesis that having a sedentary lifestyle could be more indicative of developing OA in the future as compared to more active individuals due to the association of decreased ROM with OA development.No significant correlations between BMI and knee extension were found in the active or sedentary group. It does not appear that knee extension was negatively influenced by excess weight in the active or sedentary populations, as they were both in the overweight category. In a study to identify the diagnostic accuracy of ROM, hip flexion and knee flexion measurements were identified as good diagnostic value for early symptomatic OA [30]. Knee flexion puts more pressure on the joint than knee extension does [31], which may explain why BMI was significantly correlated to flexion rather than extension in the current study. Although active individuals are more likely to have a BMI within normal range, BMI does not take into consideration body composition, and thus individuals with high muscle mass may register in the overweight or obese category [32]. This may explain why the active group experienced better knee flexion than the sedentary group although both groups had similar BMI results. Felson et al. [14] found that obesity was associated with risk for developing both symptomatic and asymptomatic OA. Knee OA is only one of many health comorbidities associated with overweight and obesity, and without proper management techniques, these preventable and reversible conditions can diminish the impact on patients’ lives. Leyland et al. [33] relayed that BMI was predictive of knee arthroplasty in 40% of overweight patients. The estimated number of knee arthroplasty procedures performed in the USA increased from 542,000 in 2006 [34], to over 600,000 in 2012 [35]. Due to the aging population in America, the number of surgeries performed is expected to exceed three million by 2030, and costs associated are expected to increase [35]. Aside from the increasing age, it has been reported that 35.5% of adult men and 35.8% of adult women in the USA have obesity [36]. As the results demonstrate, a BMI classified as overweight is correlated with decreased knee ROM, which is a risk factor for knee OA. Taking preventative measures and implementing more techniques for weight management could help alleviate the burden of overweight and obesity on the health care system. This may assist in reducing the prevalence of knee OA, and in turn, reduce the number of knee arthroplastic surgeries in the United States. Knee arthroplasty procedures have been shown to reduce pain by up to 47%, reduce stiffness by 57%, and increase physical function by 43% compared to pre-operative conditions [37]. These improvements would appear to increase the patient’s quality of life significantly, however, even after a successful operation pain and restrictions in daily life remained [34, 37]. Due to the continued effects of knee OA even after replacement surgery, it appears that prevention and management techniques of knee OA, such as weight management including strength and flexibility training, could be valuable primary prevention methods that can be started at an early age.
4.2. Blood Glucose and Knee ROM
- It is believed that high blood glucose levels and insulin resistance often develop into Type 2 DM [38]. Previous reports have shown that limited joint mobility may be an early complication of Type 2 DM [39]. The results indicated no correlation between blood glucose levels and changes in knee flexion and knee extension for the active subgroup. Additionally, there was no significant correlation found between blood glucose levels and changes in knee flexion and knee extension for the sedentary subgroup. The average fasting blood glucose for the active and sedentary subgroup were very similar, and both on the cusp of the pre-diabetic range. The Easy Touch monitoring system has been tested for reliability and was found to be highly accurate and precise when testing blood glucose levels from a range of 42 to 555mg/dl [40], which all of the values obtained in this study fall within. The average BMI for both active and sedentary subgroups were in the overweight category, and due to the association of increased weight and increased blood glucose levels [8], these values are not surprising. A number of participants were in the pre-diabetic range (15 of 38 active participants). These participants in the pre-diabetes category had normal knee ROM. Conversely, the participants that displayed limited ROM did not have an increase in blood glucose.It is possible that there was no correlation between glucose intolerance and knee ROM given the age of the participants. The mean age of both active and sedentary subgroups were 26 years old, and the average age of diagnosis of type 2 DM is 46 years in the United States [41]. Thus, these participants may have not fully experienced the negative health effects from their current elevated blood glucose levels. Most individuals diagnosed with Type 2 DM have obesity, since excess weight can cause insulin resistance [42]. Participants who are overweight at a young age and have elevated blood glucose levels are at risk for developing Type 2 DM in the future and pose a risk for developing OA. Type 2 DM has been found to be a strong predictor of severe OA of knee and hip joints independent of BMI and age [43]. Osteoarthritis in men and women between the ages of 40 to 80 years is not only due to joint degeneration from mechanical breakdown and overload, but is also correlated to glucose metabolism [43].
5. Conclusions
- This study is one of the first seeking identification of a correlation amongst BMI, blood glucose, and knee ROM. The results revealed a moderately negative correlation between BMI and knee flexion. The study population, although many were active, all sit for long periods at a time throughout the day due to the demands of school. This particular population may be seated for 6 to 8 hours a day, which is transferable to very common office or desk jobs in the United States. Limitations of this study include the small sample population available, as well as the blood glucose testing method. The participants were asked to fast for only two hours prior to testing due to time constraints and class scheduling of the participants. A more accurate glucose measurement would be the glycosylated haemoglobin assay, which provides information about the degree of long-term glucose control by measuring the average plasma blood glucose over a three month period; however, this was not available to the researchers at the time of the study [44]. There is also a possibility of error of measurements with the goniometer, so the same researcher took all measurements to try to diminish this. For future studies exploring this area, it is suggested to sample a larger and broader population to strengthen the results demonstrated in this study. It is possible that with an older population, the results may be more indicative of the effects of risk factors for developing knee OA, such as obesity, knee ROM, and blood glucose.