-
Paper Information
- Paper Submission
-
Journal Information
- About This Journal
- Editorial Board
- Current Issue
- Archive
- Author Guidelines
- Contact Us
International Journal of Prevention and Treatment
p-ISSN: 2167-728X e-ISSN: 2167-7298
2017; 6(3): 45-49
doi:10.5923/j.ijpt.20170603.01

Correlation between Physical Activity, Nutrition and Morphological Characteristics of Student Population
 Abstract
 Reference
 Full-Text PDF
 Full-text HTML
Šeper Vesna , Nešić Nebojša , Davidović-Cvetko Erna
College of Applied Sciences, Lavoslav Ružička Vukovar, Croatia
Correspondence to: Šeper Vesna , College of Applied Sciences, Lavoslav Ružička Vukovar, Croatia.
| Email: |  |
Copyright © 2017 Scientific & Academic Publishing. All Rights Reserved.
This work is licensed under the Creative Commons Attribution International License (CC BY).
http://creativecommons.org/licenses/by/4.0/

The aim of this research was to identify whether there is correlation between nutrition, physical activity and morphological characteristics of student population. Physiotherapy final year students, 27 females and 13 males, age 20.6±1.3 participated. They were asked to complete two questionnaires: on frequency of eating bread, pastry, milk, fruit, vegetables, meat and fish for past 6 months and short International Physical Activity Questionnaire (IPAQ) Croatian version for past seven days. We measured height, weight, upper and lower extremities circumference, waist and hip circumference and calculated body mass index, percent body fat, lean body mass and waist to hip ratio. Results showed significant difference in consumption of integral bread (p=0.048) and fish (p=0.041) among sexes, but no correlation between morphological characteristics and nutrition (p>0.05). There is no significant sex difference regarding physical activity (PA), except in category vigorous PA (p<0.05). Correlation between PA and morphological characteristics exists for females and males (p<0.05). To conclude, it appears that morphologic characteristics show no correlation with nutrition but do with physical activity in both sexes although women are less active than men.
Keywords: Nutrition, Physical activity, Morpholgic characteristics, Students
Cite this paper: Šeper Vesna , Nešić Nebojša , Davidović-Cvetko Erna , Correlation between Physical Activity, Nutrition and Morphological Characteristics of Student Population, International Journal of Prevention and Treatment, Vol. 6 No. 3, 2017, pp. 45-49. doi: 10.5923/j.ijpt.20170603.01.
Article Outline
1. Introduction
- Physical activity and balanced nutrition are two main components of good health and longelivity. World Health Organisation gave recommendations on physical activity but 70% of people in developed countries do not meet those recommendations (Ostojic, Stojanovic & Milosevic, 2013) and it is estimated that by the end of 2020 noncommunicable diseases will be the cause of 73% of all deaths in the world (Rao et al, 2012). The number of overweight people also increased (Hills, Dengel & Lubans, 2012; Huijig et al 2015), as well as the number of adults and children with cardiovascular and metabolic diseases (Ostojic et al, 2011). Students are particularly at risk because during university years physical activity decreases, weight is gained and eating habits change (Shah, Amirabdollahian & Costa, 2011). Research on physical activity and nutrition of students show that they do not participate regularly in physical activity, and if they do it is usually not enough to benefit health, they eat unhealthful food usually when stressed or bored, late at night or in relation to drinking alcohol (Keating et al, 2005; Nelson et al, 2009; Bhochhibhoya et al, 2014). Data also show increase in consumption of meat, eggs and dairy products and decrease in legumens, friuts and vegetables (Westhoek et al, 2014). Dietary habits of student population usually include sweets, snacks, soft drinks and pastries (Moreno et al, 2012). Their diet and physical activity behaviors are influenced by enrolling on a college and forming new social networks (Harmon et al, 2016), as well as leaving home and creating some new permanent habits (Young, Sturts & Ross, 2015). Knowing this, a question about physical activity and nutrition of students in Vukovar emerged. We wanted to know are they physically active, what kind of food do they choose and how it correlates with their morphological characteristics, since they are physiotherapy students, future educators on healthy way of life.
2. Methods
2.1. Subject Sample
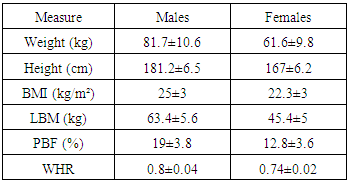
- Physiotherapy final year students, 27 females and 13 males, age 20.6±1.3 participated in the research. They were randomly selected. Mean values for body mass index (BMI), lean body mass (LBM), percent body fat (PBF), waist to hip ratio (WHR), weight and height are shown in table 1. Research took place at College “Lavoslav Ružička” in Vukovar during 2015.
2.2. Ouestionnaires
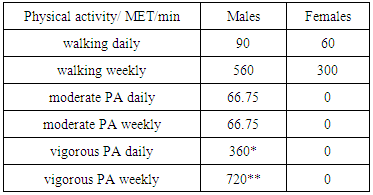
- Students were asked to complete a questionnaire on frequency of vegetables, fruit, dairy products, eggs, meat, fish, bread and pastry, grains, drinks, fried food and salt consumption 6 months prior to the research. They had to choose the answer best fitting the frequency of consumption where zero (0) stood for less than one time per week, one (1) – one time per week, two (2) – two to four times per week, three (3) – almost every day, four (4) – two or more times per day). Physical activity was estimated using short IPAQ questionnaire Croatian version. This questionnaire asseses physical activity as a part of every day living. Examinees had to estimate how much time did they spend during the day or week, one week prior to research, doing vigorus or moderate physical activity, how long did they walk, or sit. All the answers regarding physical activity less than 10 minutes were not taken into consideration. Results were calculated in MET minutes. Because of the assumption that a person sleeps 8 hours at night results such as 960 MET minutes of daily activities were expeled. Answers about physical activity like Don't know, Not sure or Didn't do this type of PA were marked as 0.
2.3. Measurements
- We measured weight, hight and body circumferences (forearm, arm, leg, waist and hip). The room where the measurements took place was 24°C, air conditioned, and students wore shorts and sleeveless T-shirts. Day before the measurements they engaged in no physical acitivity. They were divided into two groups, and two persons did the measurements, one physiotherapist and one student who noted the results. One group had 17 students and they were measured from 8am until 10am, and the other group had 23 students and they were measured from 1pm until 3pm. They were divided in two groups due to classes schedule. Weight and height were measured using Seca scale, type 700, class III, maximum weight 200kg, minimum weight 1kg with 0.1kg sections and maximum height 200cm with 0.1cm sections. Upper arm, forearm, thigh and shin, waist and hip circumference were measured using measuring tape, maximum lenght 150cm with 0.1cm sections. Before the measurements all the orientation marks on the body were highlighted using a pen. Upper arm circumference was measured on both arms relaxed at side 10cm below acromion in standing position. Forearm circumference was measured in the same way but 10cm below olecranon process. As for the thigh circumference it was also measured in standing position 10 cm below greater trochanter and for the shin circumference over the widest part of it. Waist circumference was measured over the navel and hip circumference over the widest part of both hips. Based on the aquired measures body mass index (BMI), waist to hip ratio (WHR), percent body fat (PBF) and lean body mass (LBM) were calculated. BMI was calculated as weight in kilogrammes divided by height square in metres; WHR as waist circumference divided by hip circumference in centimetres; PBF according to formula by McArdle at al (1981) for females using age, waist circumference + right tigh circumference + right shin cirumference and for males using age, right upper arm circumference + waist circumference + right shin circumference. LBM was calculated using Hume formula (1966) for males 0.3281 x weight in kg + 0.33929 x height in cm – 29.5336 and for females 0.29569 x weight in kg + 0.41813 x height in cm - 43.2933.
2.4. Statistical Analysis
- Statistical program MedCalc 10.2.0.0 was used for analysis. Chi square was used to determine differences in frequency of food consumption among sexes (P<0.05). Cluster analysis using Ward's method was applied to group examinees according to the similiarity of answers regarding frequency of food consumption, and Two-way Anova was used to determine differences between morphologic characteristic of groups based on two factors: food and sex (P<0.001). Mann-Whitney test was used to establish differences in physical activity among sexes (P<0.05). Correlation between physical activity and morphologic characteristic was estimated with Pearson's coefficient (P<0.05).
3. Results
- Physiotherapy students participated in this research more women (27) than men (13), age 20.6±1.3. Men were taller and heavier than women with higher BMI, LBM and WHR values (table 1.).
|
|
4. Discussion
- This research found that morphological characteristcs of students correlate with physical activity and with sex, but not with nutrition. Vigorous PA correlates with LBM in men whereas walking correlates with weight, WHR, PBF and LBM in women. There were no significant differences between men and women regarding physical activity except in category vigorous PA. Those changes may be due to the fact that PA was estimated, not measured or contributed to hormones (Cook & Schoeller, 2011) and sex (Larson-Meyer et al, 2012). Hallal et al (2012) and Varela-Mato et al (2012) also found that men are more active than women since men find physical activity more important in weight menagement and health maintenance than women (Elinder, Sundblom & Rosendahl, 2011). Of course, initial results also showed that men were taller and heavier than and women with higher values of BMI and LBM and lower values of PBF than women similar to research by Geer & Shen (2009) and Lakoski et al (2011) on sex differences, body fat and body mass index, who reported that college men tend to have higher LBM and women PBF. This also may be due to hormones, especially testosteron (Plaisance et al, 2009), or age (Taylor et al, 2010) as morphological differences tend to be more obvious with age. Regarding the fact that walking correlates with changes in weight, WHR, PBF and LBM in women is important as it can be a good intervention strategy in prevention metabolic disorders in older age. Some of the experimetal research state that decreasing time spent sitting or standing is better than adding vigorous PA into daily routine (Hamilton, Hamilton & Zderic, 2007). Besides PA nutrition is also important factor in metabolic disorders prevention, especially since we adopt eating habits very soon and it is difficult to change them. No correlation was found between morphological characteristics of students and nutrition in this research. Men and women significantly differ only in frequency of intergral bread, grains and fish consumption. We contributed this to the fact that students completed a questionnaire on frequency of groceries consumption, because there is only one student restaurant in Vukovar and to the influence of region on food choice (El Ansari, Suominen & Samara, 2015; Baldini et al, 2009). For example, Mediterranean diet suggests eating fish and white meat, integral bread, vegetables, fruit as dessert and avoiding margarine (Papadaki et al, 2007) as do Vukovar students. Or, compared to American students who eat a lot of fried food and drink aerated beverages (Racette et al, 2005; Ko, 2007), students from Vukovar eat fried food often also but drink less cola beverages. We also think that the ability to make own decisions regarding food, and eating with friends impact food choices students make (Huang et al, 1994; Sukalakamala & Brittin, 2006).
5. Conclusions
- Nutrition has no impact on morphological characteristic of students in this research, and there aren't so many differences between men and women regarding food choices they make. However, physical activity showed correlation with morphological characteristics, especially walking for women, eventhough men reported beeing significantly more active. This could be used in future when planning training programmes for women and men aiming to prevent metabolic disorders or cardiovascular diseases. For more sheered results all students should be included and PA and nutrition sholud be objectively measured.