-
Paper Information
- Paper Submission
-
Journal Information
- About This Journal
- Editorial Board
- Current Issue
- Archive
- Author Guidelines
- Contact Us
International Journal of Prevention and Treatment
p-ISSN: 2167-728X e-ISSN: 2167-7298
2017; 6(2): 19-27
doi:10.5923/j.ijpt.20170602.01

Assessing Self-Reported General Health in Rural Bangladesh: Updating a User Friendly Tool
 Abstract
 Reference
 Full-Text PDF
 Full-text HTML
S. M. Raysul Haque , Shabareen Tisha , M. Omar Rahman
School of Public Health, Independent University Bangladesh, Dhaka, Bangladesh
Correspondence to: S. M. Raysul Haque , School of Public Health, Independent University Bangladesh, Dhaka, Bangladesh.
| Email: |  |
Copyright © 2017 Scientific & Academic Publishing. All Rights Reserved.
This work is licensed under the Creative Commons Attribution International License (CC BY).
http://creativecommons.org/licenses/by/4.0/

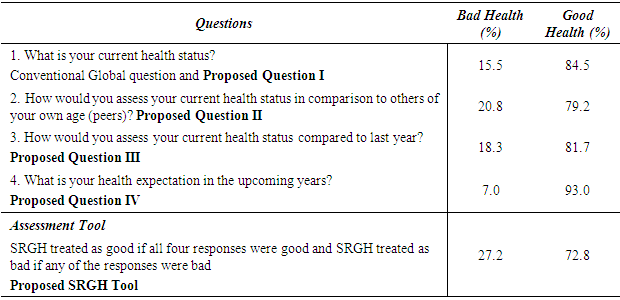
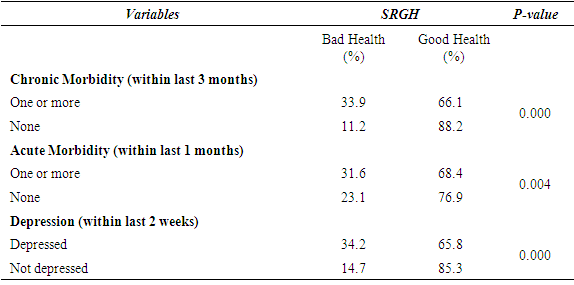
Self-reported general health (SRGH) is the frequently measured health perceptions in public health research due to its simplicity, cost-effectiveness and promptness in execution. Usually the SRGH is measured using a single global question (what is your current health status?) by most researchers. However, additional few questions to capture comparison of current health status over time and with peers may improve the validity and reliability of the measure. The goal of this study is to introduce a user friendly quick SRGH measurement tool including three additional questions to the conventional single global question for developing country perspective and to test the validity and reliability of this proposed modified tool. This is a cross sectional study where we have used the platform of live in field experience (LFE) course of Independent University Bangladesh (IUB) to collect data from 2nd to 13th January 2017. The sample consists of 908 randomly selected adults aged 18 years and above in Saturia, an Upazila of Manikganj district under Dhaka division. Data on SRGH, chronic morbidity, acute morbidity and depression were collected along with basic socio-demographic profile. Analyses were conducted using frequency distribution, Cronbach's Alpha and chi-square test. Prevalence of bad health was 15.5% using the conventional single question, while it was 20.8% when compared to peers, 18.3% when compared to last year’s status and 7.0% for predicted bad health in the coming year. Prevalence of bad health was 27.2% for negative response to any of the four questions combined. Approximately additional 12% people with perceived bad health are identified using the modified tool. Reliability statistics of the proposed four item tool denoted by Cronbach's Alpha was 0.83. All three potential determinants of general health were statistically significantly associated with this newly measured SRGH as the p value is 0.000, 0.004 and 0.000 respectively for chronic morbidity, acute morbidity and depression. As it is a reliable and quick to execute, we can introduce this tool in our regular national health surveys to get a practical scenario of population health with a very minimal resources.
Keywords: Self-Reported General Health, SRH, Cronbach's Alpha, Bangladesh
Cite this paper: S. M. Raysul Haque , Shabareen Tisha , M. Omar Rahman , Assessing Self-Reported General Health in Rural Bangladesh: Updating a User Friendly Tool, International Journal of Prevention and Treatment, Vol. 6 No. 2, 2017, pp. 19-27. doi: 10.5923/j.ijpt.20170602.01.
Article Outline
1. Introduction
- A single question-“What is your current health status? Would you say that it is very good, good, moderate, bad or very bad?” is widely used to measure self-reported health (SRH) which is one’s perception about his/her own health. This SRH is viewed as an all-inclusive measure of health, representing the well-being status of an individual. It is a valid [1] and reliable [2] predictor for health status. Self-perceived health has been found to be predictive of mortality which is used to be taken as an important objective health indicator [3-5, 6-21]. Based on findings from longitudinal analyses, it can be shown that self-reported health (SRH) is extrapolative of chronic disease incidence [3, 22, 23-24], regaining from illness [25], functional deterioration [4, 22, 26-30] and the use of health services [5, 31], even though more objective health measures are taken into account. For longer span of time this SRH is more stable than physicians’ ratings [32]. Even though it a subjective status, World Health Organization endorses SRH for routine use in population studies [33] as it can classify persons at higher risk for adverse health consequences [34-36]. When individuals rate their own health, they knock into facts that have important projecting power.For a developing country like Bangladesh where the population density is 1,237 per sq. km [37]; 31.5% population live below poverty line [38, 39]; health expenditure is only 2.8% of GDP [40] here it still lacks comprehensive measures that can provide basic information on population health. We have only 4.90 physicians and 2.90 registered nurses per 10,000 population along with 1 hospital bed for 1,528 population [41]. Practical condition is much worse in rural areas, because rural people have problems both in availability and accessibility to proper health systems [42]. At present Bangladesh is combating both communicable and non-communicable diseases with sub-optimal health care setting. As we cannot afford any expensive or time consuming complex measures, we need such health measures that are consistent, valid and straightforward to execute and can identify high-risk groups in community for earlier interference. Evidence says SRH as a subjective tool would be even more useful than an objective, diagnostic-based tool [17, 43, 44]. So for a developing country perspective it could be a very effective tool to identify high risk group in community by introducing it in national health related surveys. Though the use of SRH for low-income countries increased in the past decade [1] but still in practice the detailed exploration of SRH as a risk-assessment tool has largely been limited to the developed world. The feedback of the respondents regarding their current health status were associated with their educational level. Evidences show there is an inverse association between years of schooling and self-rated poor health [45] or individuals with higher education reported better health status [46]. This is one of the key reason that the application of SRH being a very powerful indicator of health is not widely used in developing countries [15, 47, 48]. Previously SRH was measured by assessing functional limitation [49, 50] or by tools like the Sickness Impact Profile [51] or the Perceived Well-Being Scale [52]. Most popularly it was measured by various sub-scales of the Short Form 36 Health Survey Questionnaire [53] which specifies a high degree of construct power. All these tools were relatively lengthy and touches different dimensions of health and psychology. The level of education is a vital issue to accommodate those lengthy tools. Later and till now one global question is widely practiced which is the first question of Short Form 36 Health Survey Questionnaire which is “What is your current health status?” Again educational level act as a vital issue to respond this single question which basically represent different dimensions of health comprehensively. People in less educated countries like Bangladesh, specially the rural people often fail to consider the depth and dimension of this single global question. They consider it as a question for their current physical health without concerning mental health component. We have found very few studies in developing countries where researcher used other relevant questions to support and justify the usual single global question. Yulia Blomstedt et. al (2012) used this question ‘How has your health been since the last rainy season to the current rainy season? instead of usual single global question but not to support the usual global question [1]. Ingeborg Eriksson et. al (2001) used this question “How would you assess your general health status compared to that of others of your own age?” [54], which also lacks time comparison. Still there is huge scope to use other relevant questions or to develop an easy and quick tool to justify the single global question. This is much required for the population of developing countries with low literacy rate to make the SRH measurement more understandable and logical. To our knowledge, this is the first attempts where we are going to overcome the in-general criticism of self-reported health measurement particularly in developing countries. Here we are introducing three additional questions along with that single conventional question “What is your current health status?” (which mainly focused on physical health and lacks the mental health component). So the additional questions will be - “How would you assess your current health status in comparison to others of your own age (peers)?’’ which is age comparative [54]; “How would you assess your current health status compared to last year?” which is time comparative [1] and “What is your health expectation in the upcoming years?” which is predictive and certainly reflect respondent’s mental health status. Research proves that optimistic thinking about the future fosters motivation and successful performance [55]. On the other hand pessimistic thinking diminishes motivation and successful performance [55]. Even optimistic thinking about future has hinders the emergence of acute and chronic disease and slows its progress [56]. Combining these four answers (discussed in methodology section) instead of usual one question, we will define self-reported health as good or bad. Precisely we want to mention that it would be self-reported general health status. Often we have observed that in spite of having a particular health problem, respondent rated his health status as good. On the other hand we have also observed the opposite scenario. So we want to use the term self-reported general health (SRGH) instead of self-reported health (SRH). In the proposed tool the first question was a well-known global question. These second and third questions were quite well focused on comparing oneself with others and with time. Fourth question would cover the mental component of health. All these four question would easily help a person in a developing country to properly reveal his or her current health status. We had also considered other health related variables such as depression, symptom based chronic morbidity and symptom based acute morbidity. These are the most common contributing factors for general health. We want to test the association between self-reported general health measured by our newly developed tool and the above mentioned potential contributors in Bangladesh perspective. We also want to test the validity and reliability of this new tool.
2. Research Hypothesis
- Considering educational and cultural context, it is relatively difficult to measure SRGH in developing countries by a conventional single global question. Here we had approached with a four questions scale including that single global question. Other three questions were used to support that conventional one to measure SRGH more conveniently in Bangladesh/ developing countries. It is relatively difficult to practice a SRGH scale by compiling only four item and get a relatively higher internal consistency. We are assuming that we will get a relatively high internal consistency through Cronbach's Alpha score preferably more than 0.7 for this four item scale. Along with this we will also get a significant association with the potential contributors of general health through chi-square test.
3. Data and Method
- This is a cross sectional study which was done in Saturia, an Upazila of Manikganj district under Dhaka division of Bangladesh. Here we have used the platform of “Live in Field Experience (LFE)” course of Independent University Bangladesh (IUB). We have collected data from 2nd January to 13th January 2017. This current study is a part of an ongoing research where ultimately we want to assess the prevalence of self-reported general heath and its association with medicine consumption among adults of Saturia. So sample size has been estimated considering our ultimate goal using the following formula
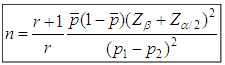 Here, n = Size of the smaller group (Bad SRGH) r = Ratio of larger group (Good SRGH) to smaller group (Poor SRGH) [here we considered it 2] [45, 50] p1 = Proportion of medicine consumption in good SRGH group (0.4) [57]p2 = Proportion of medicine consumption in poor SRGH group (0.5)
  = Weighted average of p1 and p2 (0.43) Zβ = Correspond to the power (0.84 for 1-β= 80%) Zα/2 = Corresponds to two tailed significance level (1.96 for α =.0.05) So the total sample size would be 876 ≅ 900 individuals. Our study area Saturia, an Upazila of Manikganj district, is one of those sites of IUB, Live in Field Experience course. Currently IUB has eight different sites. All the sites had been selected purposively based on the availability of local collaborative institute or NGOs. Then they had selected three villages randomly in each site. To ensure the quality of progression then they had selected 100 household randomly from each villages of a site and by this way they were following 300 household in each site twice a year for very basic health and socio demographic information. So we have already 300 randomly selected households in three different villages (100 household per village) in Saturia, Upazila. We had collected data from all adult (age 18 years and above) members of those households and we got 830 adults from that IUB, LFE platform. Then again we randomly assigned 10 house hold in each of those three villages to get that additional 70 adults and we got total 908 adults. Demographic, economic and detail symptom based morbidities and medicine consumption information were obtained by face-to-face interviews using a pre-tested questionnaire. In this particular study the primary outcome was how they rated their current health conditions by a combined four question tool. Here we also want to assess this outcome in relation with other potential health variables. SRGH is our dependent variable, outcome is whether they were currently healthy or not. We had asked four questions, the first one was “What is your current health status?” the second, third and fourth question will be “How would you assess your current health status in comparison to others of your own age?; “How would you assess your current health status compared to last year?” and “What is your health expectation in the upcoming years?” There were four answer options for each questions. Answer options for second, third and fourth questions was very good or same in a sense of good or same in a sense of bad or very bad.
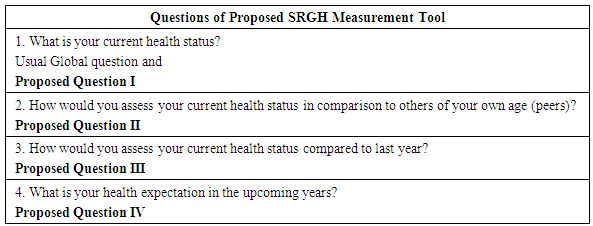 Considering our local cultural context, [49] we had considered four options for the answer of the first question which was as very good, good, bad and very bad avoiding the fair or moderate option to make it easier for the respondents. We have combined these four questions to rate the current health status with a view to get more sophisticated comprehensive information and then for analysis purpose we had combined very good and good as good and very bad and bad as bad, as the dichotomy of bad versus good would provide the sharpest contrast [49]. Ÿ We had treated SRGH as good for a person if all four responses were good. Ÿ We had treated SRGH as bad for a person if any of the responses were bad. Self-reported chronic morbidity was assessed with a checklist of 10 common conditions considering our local perspective as a proxy for chronic morbidity [49, 50]. High blood pressure, arthritis, asthma or other breathing difficulty, diabetes, pain or burning on urination, stroke or paralysis, heart disease or angina pectoris, gastric or ulcer problems, cancer and a residual category called ‘‘other conditions” were considered. For each condition, respondents was asked to report whether they had ever experienced the mentioned problem/problems (by asking common symptoms) 3 months prior to the survey or had visited a health care professional for that respective problem. If so whether it had caused them no difficulty or inability to carry out their day-to-day activities. Those who reported none of the 10 common conditions or one or more conditions but it didn’t create any difficulty throughout their daily activities was labeled as having no chronic morbidity. Those who had experienced one or more of the 10 conditions with difficulty/inability to carry out their day-to-day activities was labeled as having chronic morbidity. Self-reported acute morbidity had assessed similarly with a checklist of 10 common conditions considering our local perspective as a proxy for acute morbidity [49]. Headache, eye infection, toothache, cold and cough, fever, watery diarrhea or diarrhea associated with mucus or blood, vomiting or/and stomach ache, skin problems, accidental trauma, and a residual category called ‘‘other conditions’’ were considered. For each condition, respondents had asked to report whether they had experienced the mentioned problem/problems 30 days prior to the survey or not or have visited a health care professional for that respective problem or not. Those reporting at least one of the aforementioned conditions was labeled as having acute morbidity. It is worth mentioning that, for both self-reported acute and chronic morbidity, the summary measures are composed of different categories of symptoms and disease labels that reflect the usual morbid conditions in rural Bangladesh. They are locally specific and nor for cross- country comparison. Depression level was assessed by diagnostic structured interviews based on the Major Depression Module of the Mini International Neuropsychiatric Interview (MINI), a questionnaire with nine questions based on the criteria of the Diagnostic and Statistical Manual of Mental Disorders, Fourth Edition (DSM-IV). The analysis was done in different steps. First, frequency distribution was observed for each of the four questions of the SRGH assessment tool individually and then combining them as mentioned earlier. In case of time comparison we had considered both present, past and also time in future in aspect of respondents’ health status. In case of peer comparison we had considered similar age with the respondents’. To observe the construct power and the reliability of the proposed tool, we did Cronbach's Alpha test. We did this test considering an option which represent the reliability statistics of the proposed SRGH tool if each of the items is deleted. It means if we remove a specific question form this SRGH tool then what would be the value of Cronbach's Alpha as a means of internal consistency. Again to check the validity we did chi-square test between the SRGH measured by our new tool and the other health related variables. To do all these statistical stuffs we have used SPSS version 22.
4. Results
- Table 1 represent the frequency distribution of both dependent and independent variables. Among 908 participants 51.2% were male and 48.8% were female. Regarding age category 47.2% belonged to 18-39 years age group and 37.1% belonged to the age group 40-59 years. 60 years and above participants were only 15.6%. In aspect of their relationship status 81.1% were married and 18.9% were single. Among our study population 70.3% had at least one or more symptom based chronic morbidity and 47.9% had at least one or more symptom based acute morbidity. We found 36.2% of the respondents did not have depression while other were having different levels of depression ranging from minimal to severe depression. In case of level of education, 35.3% had no formal education while primary, seconder and higher education rates were 19.4%, 31.8% and 13.6% respectively.
|

|
|

|
5. Discussion
- In the field of public health the predictive ability of subjective health estimation is well established by research. So the demand of measuring self-reported general health (SRGH) in different settings with the same goal is also increasing day by day. Definitely a tool which is quite user friendly in aspect of SRGH measurement in developed countries will not be appropriate for developing countries. Even within the developing countries it may need special attention considering educational level and cultural context as these issues varies a lot from country to country. Our aim for this particular study was to develop and test a very easy, well understandable and quick tool to measure SRGH in developing county with low literacy rate like Bangladesh. Keeping in mind of that single global question, we added three more questions along with that well established global one (what is your current health status?), which was commonly used in developed countries. There were few main findings revealed in this particular study. A single question was not able to capture the self-perceived health status of the population of Bangladesh. With that single global question we had found that only 15.5% study population reported bad health. On the other hand when we had asked them to compare their current health status with peers of similar age, the same study population reported 20.8% bad health. Again when we had asked then to compare their current health status with the same time of last year and we got 18.3% study population reported bad health. With the fourth question the prevalence of bad health was much less which was only 7%. So it is very clear that if we can knock respondents from different angles regarding their current health status and summarize the findings we could get a comprehensive result which would be 27.2% bad health and 72.8% good health in this particular case. According to Yulia Blomstedt, et al. (2012) [1] in Burkina Faso which is a West African country, two attempts were made to include that single conventional question to measure self-rated health in annual house hold survey. In 2000, the prevalence of bad or poor SRH was only 3.5% with this question “What do you think about your health, is it very good, good, medium, bad, or very bad?’. In 2008 the prevalence of bad or poor SRH was only 8.5% with this modified version of the same SRH question ‘How do you appreciate your health today, is it very good, good, medium, bad, or very bad? These two finding were quite contradictory with this low income country profile where life expectancy was 56.7 years and the total adult literacy rate was 26% in 2010 [1]. Then in 2009 considering the above question was not culturally and locally sensitive, they had introduced another similar but easily understandable question and two other visual analogue scales to measure SRH and then they got the prevalence of bad SRH was 38.5% with this question ‘How has your health been since the last rainy season to the current rainy season?. The prevalence of bad SRH was 44.2% with both the visual analogue scales. So they were are getting relatively considerable number of bad SRH by using a tool like the visual analogue scale or a locally understandable question. These 38.5% or 44.2% bad SRH goes more appropriate with their country profile.According to Haque SM et al. (2015) [57], the prevalence of bad SRH was only 5.5% in rural Bangladesh whereas the prevalence of good SRH was 94.5% with that conventional single question with the answer option of good, average and bad health. Here he had considered average health status as good because when the second question was asked, what do you mean by average health? Majority replied that on an average it is good. Now in this particular study when we asked the same question which was the first proposed question of SRGH measurement tool with the answer options of either very good or good or bad or very bad avoiding the average category to make it more locally user-friendly then we got 15.5 % as bad SRGH and 84.5% as good SRGH. This time the prevalence of bad SRH is little higher than the previous one. Again when we checked it through a combined four questions, we got 27.2% bad SRGH which is quite interesting and also practical in aspect of our country profile in comparison to the previous one. According to this article “Self-rated health assessments in the 2002 World Health Survey: how do they correlate with education? by Subramanian SV et al. (2010) [45] we found that the prevalence of bad self-reported health in Bangladesh, India, Nepal, Pakistan and Sri Lanka was 19.7%, 17.7%, 10.9% 5.6% and 5.2% respectively with that conventional single question. It was clearly mentioned in the report that years of schooling is a vital factor for this SRH measurement. So it might be a miss leading fact for the mentioned developing countries which was also supported by another report of WHO. In 2000 WHO [58] published a report where they had ranked 191 countries according to their health systems. The rank of Bangladesh, India, Nepal, Pakistan and Sri Lanka was 88, 112, 150, 122 and 76 respectively. These two reports were quite conflicting in aspect of country’s health system and the perception of own health by their population. The prevalence of bad self-reported health in Pakistan was only 5.6% whereas their health systems’ ranking was 122 out of 191 countries, which is quite confusing as the prevalence of bad self-reported health in Sri Lanka was 5.2% with a ranking of 76. Same thing was also applicable for Bangladesh, India and Nepal. Possible explanation could be the use of single global question in SRH measurement. In case of Sri Lanka it did not create any confusion as the literacy rate was quite high in comparison to the other south Asian countries. So using an easy SRH measurement tool like what we have proposed in this study might provide different result in that 2002 World Health Survey, especially for developing countries.In majority of studies like Ingeborg Eriksson et al. (2001) [54], they compared three different single question assessments of self-reported health in Stockholm, Sweden and found that these three different SRH measurements represent parallel assessments of subjective health but in our study we found that individual assessments by the four questions of our proposed tool didn’t parallely assess SRGH in rural Bangladesh. When we had considered it as tool for SRGH assessment, we got a high internal consistency which was 0.83 denoted by Cronbach's Alpha. It is well established that if the value of this alpha is 0.7 or more then it is internally well consistent. In case of a tool having less questions like this particular one, Cronbach's Alpha less than 0.7 even considered as good internal consistency predictor. We might get a higher value of alpha if we had a relatively larger sample size or samples from different areas of Bangladesh. We did not find any such question from our proposed tool by removing which can considerably increase the internal consistency (the value of Cronbach's Alpha). If we remove first, second and third question individually from this tool the internal consistency would be dropped from 0.83 to 0.70, 0.81 and 0.71 respectively. The only question that could be removed from this tool to make it more internally consistent would be question number four as the value would be 0.87, but in total the increase of alpha would be only 0.04 and this particular question represent the mental health component of general health status. Yes we could think about to remove this question if we would get much higher alpha value like 0.90 or higher. This newly measured SRGH is statistically significantly associated with all three potential determinants of general health as the p value is 0.000, 0.004 and 0.000 respectively for chronic morbidity, acute morbidity and depression, which is an another indicator to check its validity. Regarding the limitation of this study first we want to mention that the whole concept rely on subjective evaluation of health which is on the other hand is a practical issue for a developing county. It would be better if we can compare this subjective status with objective indicators like diagnostic test and get the similar findings. Such facility requires a huge involvement of resources and this limitation creates further scope of research in this field. Qualitative research is also needed to explore the inside view of this SRGH measurement issue.
6. Conclusions
- We got a higher internal consistency for this only four item tool to measure SRGH and also found it statistically significantly associated with the potential determines of general health like chronic morbidity, acute morbidity and depression. Despite of having few limitations we would highly recommend it to use in regular national health surveys as a subjective screening tool for a developing country like Bangladesh.
ACKNOWLEDGEMENTS
- We would like to thank Dr. Dipak Mitra, Head, School of Public Health, Independent University Bangladesh for his continuous support and inspiration. We are also thankful to Dr. Wasimul Bari, Professor, Department of Statistics, Biostatistics and Informatics, University of Dhaka for his kind support throughout the study.