Fredrick Chiumya , Simon Tembo
Electrical and Electronics Engineering Department, University of Zambia, Lusaka, Zambia (Engineering Institute of Zambia)
Correspondence to: Fredrick Chiumya , Electrical and Electronics Engineering Department, University of Zambia, Lusaka, Zambia (Engineering Institute of Zambia).
| Email: |  |
Copyright © 2016 Scientific & Academic Publishing. All Rights Reserved.
This work is licensed under the Creative Commons Attribution International License (CC BY).
http://creativecommons.org/licenses/by/4.0/

Abstract
The health care system in developing countries like Zambia faces serious challenges in attending to all the medical needs of the population due to limited number of physicians in health care centers, limited medical infrastructure to accommodate patients, high cost of accessing medical centers by people in the outlying areas, and the cost of medical infrastructure used to diagnose patients. With the recent increase in Non-Communicable Diseases among people of all ages, that require regular check-ups as a preventive measure, the health care challenges have become more pronounced. Therefore, in order to help solve these challenges, Body Area Network (BAN) methods implemented in developed countries can be made available at an affordable cost to reduce the strain on the medical system, by reducing the rate of medical check-up by people with non-communicable diseases. A BAN is subsystem of a health monitoring system that performs acquisition and digitization of physiological body parameters. However, these methods are costly, and in most cases complex for a developing country like Zambia to adopt. In this study, a simple, low cost BAN artefact was developed to measure temperature, pulse rate and oxygen saturation using low cost miniature sensors and an open source microcontroller. The BAN artefact developed converted the measured physiological parameters into digital serial format, which could be sent to medical personnel via any wireless communication platform such as global system for mobile communication (GSM). The medical personnel receiving the information can use the information to make informed decisions about the condition of a patient, and consequently help in reducing the burden placed on the medical sector. Upon evaluation of the BAN artefact, it was found to be reliable and valid in producing accurate results.
Keywords:
Bod area network, Health monitoring system, Microcontroller, Artefact, Physiological parameters
Cite this paper: Fredrick Chiumya , Simon Tembo , Design of an Affordable Body Sensor Network for Prevention of Non Communicable Diseases, International Journal of Prevention and Treatment, Vol. 5 No. 3, 2016, pp. 29-38. doi: 10.5923/j.ijpt.20160503.01.
1. Introduction
According to the central statistics office of the Republic of Zambia [1], the population of Zambia grew from 9,885,591 persons in 2000, to 13,092,666 persons in 2010, representing a percent increase of 32.4 percent over the period in question. Sadly, this ever increasing population depends on the limited health care system with a total number of health care facilities at only 1,882 [2]. A research carried out by the world health organisation [3] revealed that non communicable diseases such as heart diseases, stroke, cancer, diabetes, alcohol and substance abuse related conditions, tobacco-smoking and nutritional related illnesses are emerging problems that require urgent attention in Zambia and the world over [4]. Current global mortality from non-communicable diseases (NCDs) remains unacceptably high and is growing. Thirty-eight million people die each year from NCDs, mainly from cardiovascular diseases, cancers, chronic respiratory diseases, and diabetes [17]. Over14 million deaths from NCDs occur between the ages of 30 and 70, of which 85% are in developing countries [17]. Concise overview of some of the NCDs affecting people is as follows [18]: a. Cardiovascular disease: a heart or blood vessel disease that diminishes blood flow to the heart, brain or body as a result of a blood clot or build-up of fatty deposits inside an artery, causing the artery to harden and become narrow. b. Diabetes mellitus-Type II, which is an extended metabolic condition that is a result of high blood sugar, insulin resistance, and relative lack of insulin. Common signs include increased thirst, regular urination, and unexplained weight loss.c. Cancer, a disease caused by an uninhibited division of abnormal cells in a part of or all of the body. d. Chronic respiratory diseases which are prolonged diseases of the airways and other parts of the lungs. Examples are asthma, chronic obstructive pulmonary-disease, lung cancer, cystic fibrosis and sleep apnea. e. Epilepsy, which is a neurological disorder marked by sudden recurrent episodes of sensory disturbance, loss of consciousness, or convulsions, associated with abnormal electrical activity in the brain. f. Mental illnesses which are ailments that affect a person’s mood, thinking and behavior. Examples include depression, anxiety disorders, eating disorders and addictive behaviors.g. Injuries mostly due to road traffic accidents and burns.h. Hypertension, a condition caused by blood flow through the blood vessels with potency greater than required. Also referred to as high blood pressure. Most of these health conditions are associated with poor lifestyles, such as unhealthy diets, physical inactivity, alcohol abuse and tobacco use [3], while some are also associated with biological risk factors, which run in families [2]. Figure 1 shows the concise figures expressed as a ratio of deaths in an area to the population of Zambia, expressed per 1000 per year, otherwise called morbidity as a result of respective NCDs between the year 2008 and 2009 [2]. 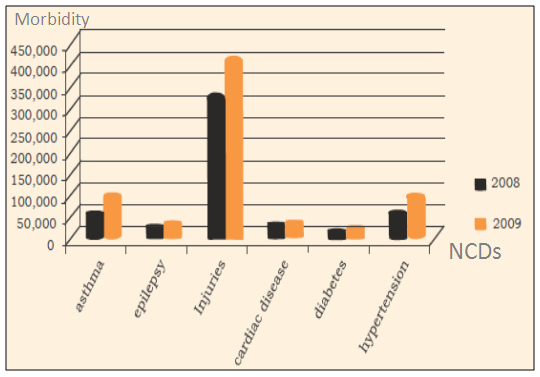 | Figure 1. Zambia NCDs Morbidity at Primary Health Care: 2008-2009 [2] |
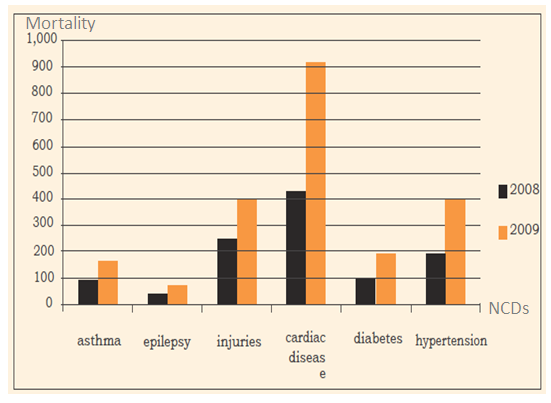 | Figure 2. Zambia NCDs Mortality at Primary Health Care: 2008-2009 [2] |
From Figure 2, it was deduced that between 2008 and 2009, cardiac diseases were the highest cause of mortality among NCD diseases and recorded the highest increase of almost 100 percent. Similarly, mortality between 2008 and 2009 as a result of injuries and hypertension increased by over 100 percent, while diabetes, asthma, and epilepsy recorded an increase of over 90 percent, 50 percent and about 25 percent respectively. In order to prevent NCDs in Africa and the world over, health sectors of African governments and the world over, in conjunction with World Health Organisation (WHO) and other international organisations, have come up with policies and budgets to encourage and support people to engage in healthy activities such as regular physical exercises, reduced alcohol and tobacco smoking by increasing tax, and change in eating habits by encouraging nurturing on healthy diets [17-19]. Furthermore, a progress report on Prevention and control of non-communicable diseases, a survey carried out in the European Region describes some of the general methods of prevention that have been introduced as follows [4]:a. 74 percent of countries in European Region have policies that integrate several NCDs and their risk factors, which have increased since 2010. b. Advancement with surveillance of NCD risk factors has been significant since 2010. More than 80% of countries across the European Region report surveys among adults on exposure to key risk factors as a result of NCDs. c. Ninety per cent of countries report that risk factors are being taken care of by other than health ministries, and 54 percent have formal multi sectoral mechanisms to coordinate policies relevant to NCDs. There has also been an increase in Partnerships with international organizations and United Nations agencies by 13% since 2010.d. Almost all European Region countries (from 93 percent to 100 percent) have increased tax on tobacco and alcohol. A few have introduced taxes on unhealthy foods. e. More than half of the countries in the Region have devised policies to limit the marketing of foods and non-alcoholic beverages to children; some administer the policies by law and others depend on voluntary compliance.f. Almost all primary care health systems in the European Region (94–96 percent) provide primary prevention, detect risk factors and manage NCDs. g. Since 2010, the most advancement has been made in assimilating home-based care, self-help and self-care into primary care. Policies and action plans that integrate early detection, treatment and care across the major NCDs and conditions increased by about 10% between 2010 and 2013; and more than 80% of countries have essential medicines for NCDs. h. High technology procedures for treating NCDs are also increasingly available.The increase in the number of deaths as result of NCDs among young, middle age and the ageing population has resulted in an influx of people going for regular check-up of vital signs such as body temperature, heart rate, respiration rate and blood pressure in order to avoid fatality. The practice of regular check-ups has become common in Zambia and the world over, and has resulted in adding of more pressure on the already constrained and under funded health sector. This is so because, in addition to attending to patients with critical health cases, there is a huge demand on the limited hospital staff and infrastructure to also attend to regular check-ups of vital health signs.One way of minimising these health care challenges on the health sector in developing countries is to minimise regular check-ups by utilizing integrated technological solutions that incorporate user-driven healthcare with Information, Communication and Technology (ICT), in order to provide health care with more accessible and inexpensive methods. This can be achieved by using an affordable Body Area Network (BAN) for monitoring of vital signs and diagnosis remotely without the need to physically go to a health facility. In [9] a BAN is described as part of a health monitoring system and is defined as a combination of sensors, actuators and a processing unit for acquisition and processing of physical parameters. Whereas a health monitoring system is a group of specialized transducers, a processing unit and communication platform that uses radio to monitor and record physical or environmental conditions [9]. Figure 3 shows BAN architecture. 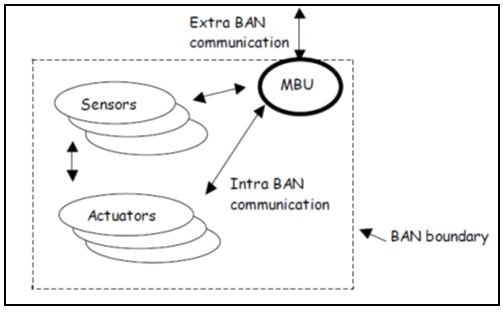 | Figure 3. BAN architecture [10] |
Communication between sensors and the mobile base unit (MBU) within the BAN platform is referred to as intra BAN communication, whereas communication between BAN and a remote location via a wireless network is called extra Ban communication [9]. An MBU can either be a phone or processing unit. A number of past researchers [5-8, 10-14] have supported this theory. However, they are either complex or costly to be implemented in a developing country such as Zambia. This research looked at reducing cost and introducing simplicity of design by coming up with a small health monitoring model utilising open source technology.Health monitoring facilitates improvement of certain areas of health care system towards dealing with wellness, prevention and early detection of NCDs rather than illness by implementation of wearable system technologies or Body area network (BAN) for continuous health monitoring. Therefore, the purpose of this study was to come up with ways of helping the overstretched healthcare system, by coming up with an affordable, small, and yet effective BAN model which could be used by patients to remotely measure analogue physiological parameters and produce serial digital results that could be displayed on a serial monitor, and can be communicated via any communication platform to a physician.
2. Methods and Materials
The study used a design science research approach [9] to come up with a BAN artefact. It involves the following stages: identification of the problem through analysis of requirements and development of a conceptual model, design and development of a system prototype, analysis of the prototype, and test evaluation of the results.
2.1. Development of Conceptual Framework
A conceptual framework was realized based on literature reviewed and the gaps that existed in previous researches. It was observed that past researchers had come up with BAN artefacts which were costly, complex or technologically advanced for a developing country to adopt. Therefore, a conceptual framework was realized that looked at the followinga. Required inputs; measuring of physiological parameters such as temperature, oxygen saturation and heartbeat, b. The process; analogue to digital conversion and serial processing of the digital results c. Expected output; serial digital output of temperature, oxygen saturation and heartbeat that could be displayed on a serial display and at the same time, transmitted over any wireless communication network.
2.2. Design and Development of System Architecture
A low cost model design strategy was adopted in coming up with the BAN artefact and included a. Identification of an open source, low cost programmable microcontroller; b. Identification of miniature, low cost sensors to measure temperature, oxygen saturation and heartbeat; c. And finally, integration of the system components namely: A 9V regulated DC power supply, Arduino Uno Board, Temperature sensor. Heartbeat sensor, Oxygen saturation sensor, capacitor and Resistors on a Printable circuit board as shown in Figure 4.DC power was supplied from a 9V DC battery and regulated using a 7805C voltage regulator to produce five volts regulated output voltage. The regulator is suitable for this study because it gives maximum output voltage of 5.2volts at 1.5amps which is above the maximum load drawn by each sensor in the circuit. Three sensors namely; temperature sensor, oxygen saturation sensor and pulse rate sensor were employed. The temperature sensor circuit consisted of a voltage divider circuit with a potentiometer and a 4.7kiloohm fixed resistor. The voltage drop across a fixed resistor was determined by varying potentiometer value due to changes in temperature. This output line voltage drop was then fed to the Arduino Uno microcontroller pin A1. Blood oxygen saturation was effectively measured in this model by pulse oximetry [15]. The light absorbed by the blood varied with the oxygen saturation of haemoglobin. The photo-detector D2 detected the light transmitted at 650nm for red light and 940nm for infrared light as the blood pulsated through the tissues. The pulsations were converted into varying electrical voltage that was fed to analogue input pin A2 of the microcontroller. The sensor or probe is designed for use on the finger or toe. Heartbeat was measured using a miniaturised sensor wrapped on a finger and consisted of a super bright red LED and light detector D1 whose output was connected to a microcontroller (Chen, 2005). When the heart pumped, a pulse of blood rushed through the blood vessels. With each heart pulse, the detector signal varied. This change was converted to electrical pulse voltage output by a sensor between zero and five volts logic level and fed to analogue pin A0 of the microcontroller. 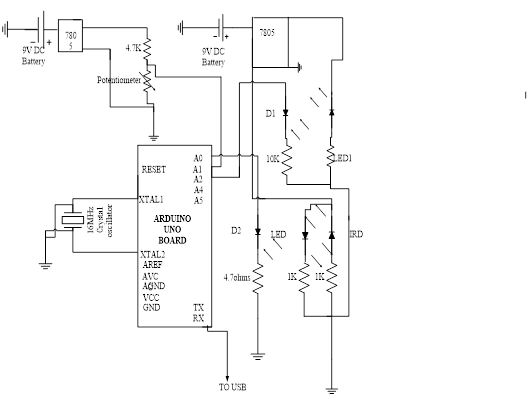 | Figure 4. Circuit diagram for a BAN artefact |
From the software point of view, a source code was developed for Arduino Uno microcontroller using open source software called Arduino environment version 1.6.3, downloaded from an Arduino website [16]. A program was developed with the following sections or methods:a. Declaration of input pins.b. Initialising of values such as averages, totals and index.c. Setup method() where the following was executed:i. Assigning of inputs pins.ii. Switching off unused analogue inputs by introducing pull-ups.iii. Initialising of serial communication.d. Temperature, Oxygen saturation and heartbeat methods()The methods included the following:i. Initialising of indexes.ii. Mapping or inverting of analogue inputs for temperature method.ii. Smoothing of analogue inputs to prevent jitter.iv. Calculating the average of smoothed inputs.v. Displaying the output on serial monitor.e. Void loop method()i. Recurrent calling of methods in the source code.
2.3. Calibration of the Program
The developed source code was then calibrated using corresponding clinical values of oxygen saturation, temperature and heartbeat of a patient as illustrated below:
2.3.1. Temperature
The following procedure was used to determine the coefficient of temperature:i. A Patient’s body temperature T1 degrees was taken using a clinical thermometer;ii. A Patient’s body temperature was then measured using a BAN artefact’s temperature sensor to get a corresponding value T2 in volts ;iii. If x is the coefficient of temperature, then the equation relating the two values obtained in i and ii above becomes T1 = T2x;iv. Making x the subject of the formula resulted in; | (1) |
2.3.2. Heartbeat
Similarly for heartbeat:i. A Patient’s body heartbeat HB1 in beats per minute (b/min) was measured using a clinical instrument;ii. A Patient’s heartbeat was then measured using a BAN artefact’s heartbeat sensor to get a corresponding value HB2 in volts;iii. If y is the coefficient of heartbeat, then the equation relating the two values obtained in i and ii above becomes HB1 = HB2y;iv. Making y the subject of the formula resulted in;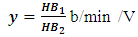 | (2) |
2.3.3. Oxygen saturation
Finally, for oxygen saturation:i. A Patient’s body oxygen saturation SpO21 as a percentage was given a value based on the age and weight of the patient;ii. A Patient’s oxygen saturation was then measured using a BAN artefact’s oxygen saturation sensor to get a corresponding value SpO22 in volts;iii. If z is considered the coefficient of heartbeat, then the equation relating the two values obtained in i and ii above becomes SpO21 = SpO22z;iv. Making z the subject of the formula resulted in;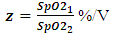 | (3) |
The coefficients derived were used to calibrate an Arduino Uno microcontroller for the developed BAN artefact. The software program uploaded to the microcontroller was developed based on the requirements identified in the conceptual framework. Figure 5 below summarizes the flowchart for calibration of the BSN model.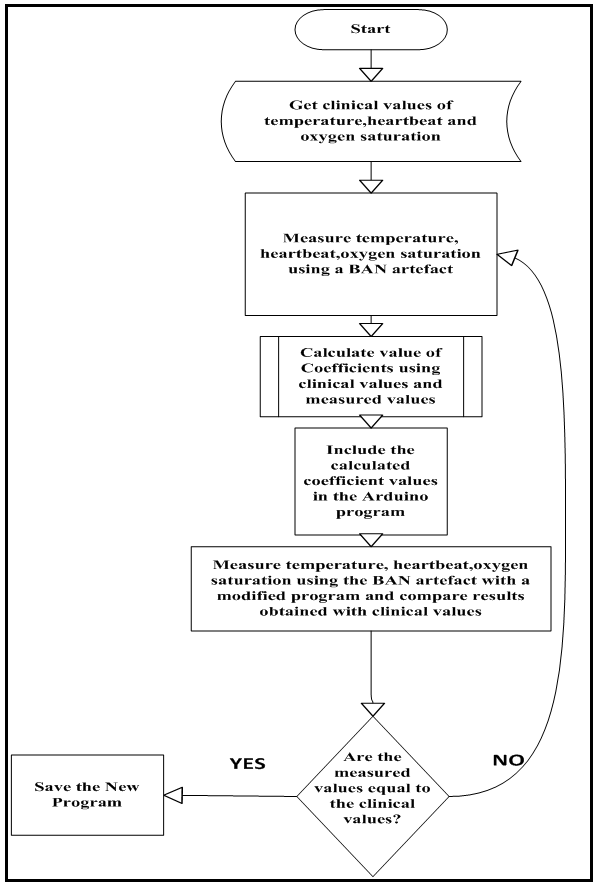 | Figure 5. Flowchart for calibrating a BAN artefact |
2.4. Implementation of the BSN Model
The implementation of the model included software development and hardware implementation to achieve the requirements.
2.4.1. Hardware Implementation
The hardware model prototype was developed by integration of a number of materials. Key components of the model were temperature sensor, oxygen saturation sensor, pulse rate sensor, processing unit, power supply unit and a USB cable for interfacing with a computer.
2.4.2. Software Development
This stage involved development of an executable program through programming and deployment from requirements, with the real code being written and compiled into an operational application. The program developed was able to perform analogue to digital conversion of physical parameters. Figure 6 shows the flowchart for internal software processing to realise the serial digital values of the three physical parameters.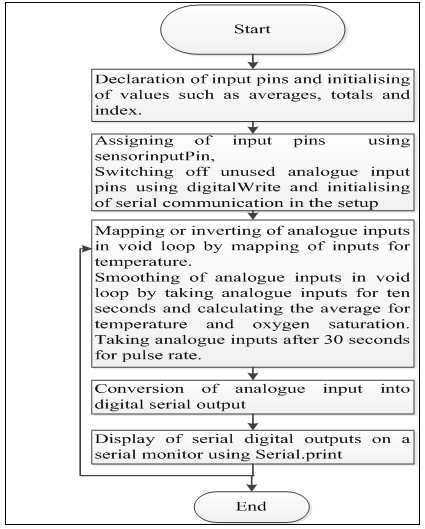 | Figure 6. Program for the model |
2.5. Observation and Evaluation of the Artefact
This included experimental verification and validation of the model. Verification included evaluation of the model software and hardware to determine whether individual results of temperature, oxygen saturation and pulse rate obtained from the artefact were same as those obtained using clinical instruments. This type of evaluation was chosen in order to determine how capable the artefact was in producing correct results. In other words, it was aimed at determining the reliability of the artefact. Apart from reliability, validity test evaluation of results was also conducted by invoking a Void-loop method. Repetition of same results showed that the BAN artefact was able to produce valid results. Figure 7 shows an example of a void-loop method used.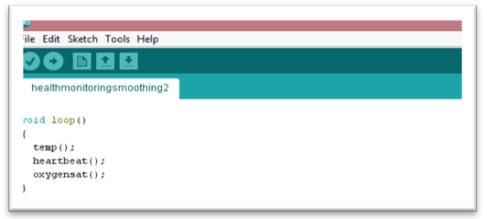 | Figure 7. Void-loop method |
2.6. Experimental Validation
The artefact was set up as shown in Figure 8 below. 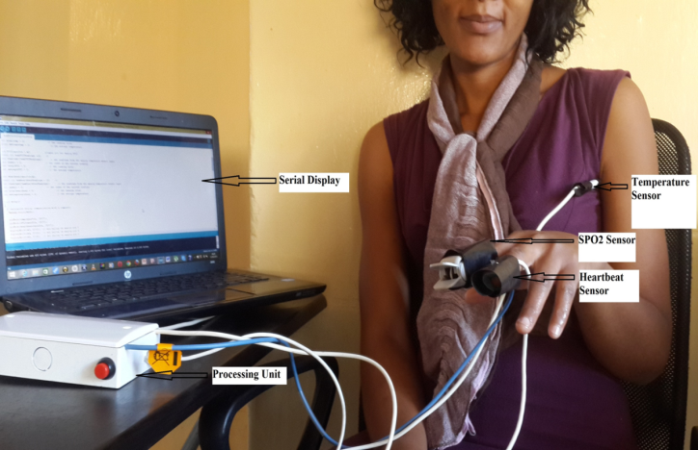 | Figure 8. Model setup during evaluation |
Physical parameters of five patients who were randomly sampled were measured with their consent using a BAN artefact, and the readings obtained from the artefact were compared to the clinical values. Figure 9 shows the system flowchart.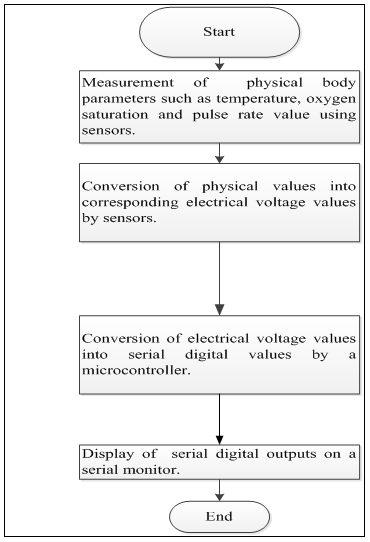 | Figure 9. System flowchart |
3. Findings
3.1. Hardware Design and Implementation
Figure 8 shows hardware integration of various components to come up with a BAN model. Key component of the developed model included a temperature sensor, oxygen saturation sensor, a pulse sensor, and a processing unit consisting of an Arduino Uno microcontroller and a power supply. The artefact developed was able to measure three physical parameters. The pulse rate sensor and oxygen saturation sensor were shielded from external light by wrapping a black insulation tape as shown in figure 10 below.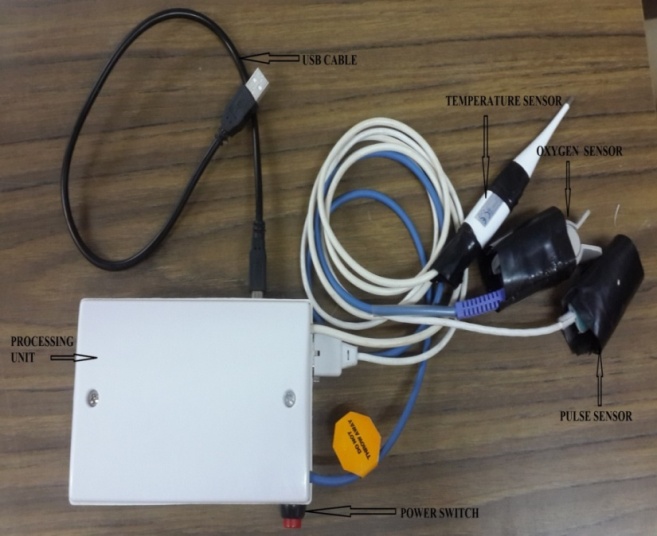 | Figure 10. Hardware integration for a BAN model |
3.2. Software Developed
The source code developed consists of four methods namely: setup method, void loop method, temperature method, oxygen saturation (SpO2) method and heartbeat method. A setup method is where initialising of serial communication and variables used in the program was done. A temperature method constitutes a code for processing of voltage value of temperature from the temperature sensor into serial digital values. Oxygen saturation method consists of a code for processing of analogue voltage values of oxygen saturation obtained from the pulse oximeter sensor into serial digital values. Further, a heartbeat method has a code for processing of voltage values of pulse rate from the temperature sensor into serial digital values. And finally, a void-loop is an iterative method that continuously repeats temperature, oxygen saturation and heartbeat processing methods and displays continuous results on the digital serial display on a laptop.
3.3. Evaluation of the BSN Artefact
In design science research, demonstration that the artefact developed meets the functionalities and requirements established in the conceptual framework is necessary during the design and development phase [9]. Physical parameters of five patients were measured with their consent using the designed BAN artefact. Sensors converted physical parameters to voltage values which were fed to analogue pins of a programed microcontroller. The programed microcontroller then converted analogue voltages into serial digital values and displayed results on a serial monitor. Figure 11 and Figure 12 below show clinical values for heartbeat and temperature obtained using clinical instruments from a patient at Zambia Air Force (ZAF) Lusaka medical Centre, while Figure 13 shows the corresponding programmed BAN artefact (model) results for one person.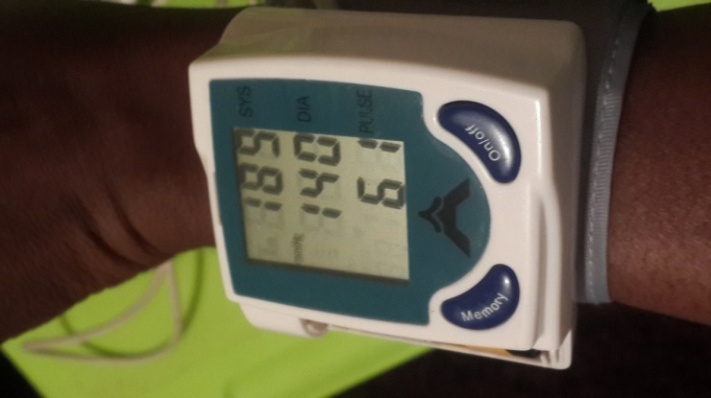 | Figure 11. Clinical heartbeat measurement |
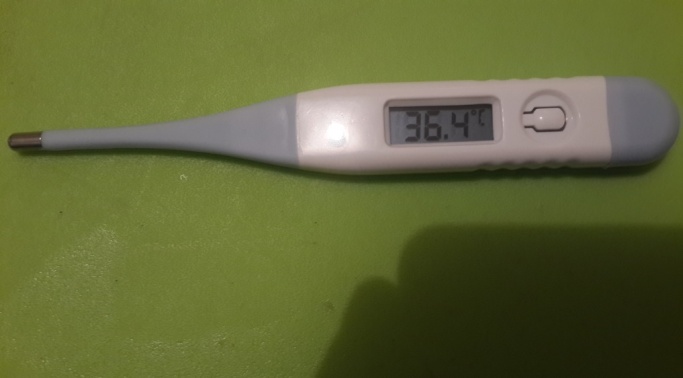 | Figure 12. Clinical temperature measurement |
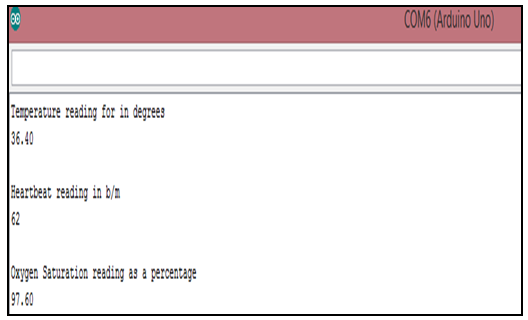 | Figure 13. Corresponding measurements from the BAN artefact |
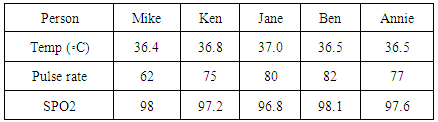
Physical parameters were measured from five different patients and the results obtained are shown in Table 1. Table 1. Physical Parameters from Five Individuals using BAN Artefact
 |
| |
|
3.4. Determination of Reliability and Validity of the BAN Artefact
The results in Table 1 above were plotted against those from the BAN artefact to determine reliability of the artefact results.
3.4.1. Determination of Reliability of the Model
In order to determine how reliable the BAN artefact was in producing correct results of temperature, heartbeat and oxygen saturation measurements. Results from measurement of physical parameters were plotted as shown in Figure 14, Figure 15 and Figure 16 below. 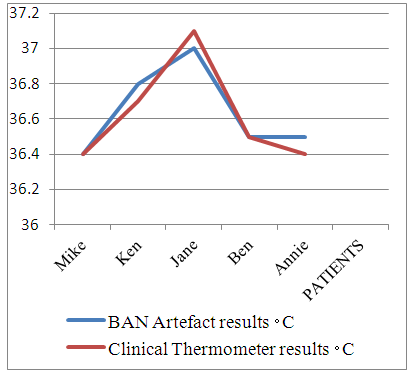 | Figure 14. Comparison of artefact temperature values to clinical values |
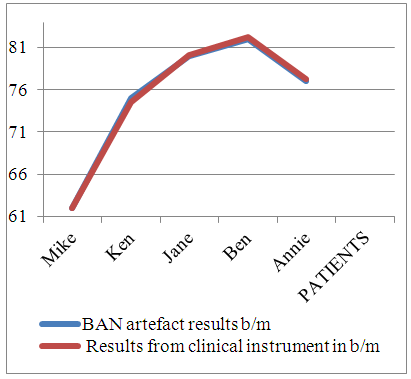 | Figure 15. Comparison of heartbeat Model values to clinical values |
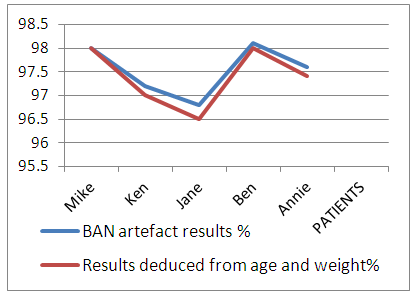 | Figure 16. Comparison of artefact oxygen saturation values to values deduced from literature |
The accuracy of measured values using the BAN artefact demonstrated the capability of success and continued effectiveness of the model or artefact designed. Oxygen saturation results were determined based on findings from literature reviewed, World health organization, pulse oximetry training manual [15] observes that that oxygen saturation values of an individual are determined by age, blood volume of a patient, beats per minute and most importantly, the concentration of hemoglobin in the blood.
3.4.2. Determination of Validity of the Artefact
Validity is a process of determining that the developed prototype is applicable in the proposed context and can demonstrate some valid results in addressing the problem [10]. a. Determination of validity of temperature resultsTo determine the ability of the artefact to produce correct temperature results. Measurement of temperature was performed on a patient using the programmed BAN artefact and results obtained were shown on a serial monitor as demonstrated in Figure 17 below. 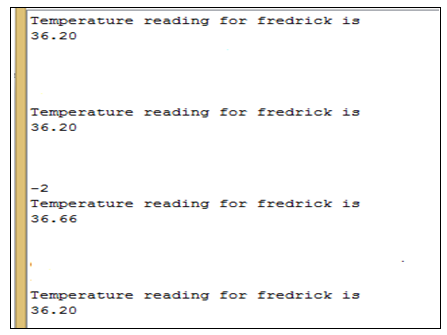 | Figure 17. Determination of validity of temperature results |
From the results obtained, it was determined that the artefact was able to reproduce continuously, repeated serial digital values of temperature. Consequently, it was concluded that the results produced by the model were valid.b. Determination of validity of Oxygen saturation resultsIn order to decide the capacity of the artefact to produce correct oxygen saturation results, Oxygen saturation measurements of a patient were taken using the programmed BAN artefact, and results obtained were shown on serial monitor as demonstrated in Figure 18.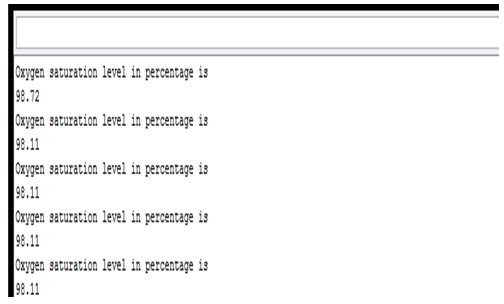 | Figure 18. Determination of validity of oxygen saturation results |
From the results obtained, it was determined that the artefact was able to reproduce continuously, repeated serial digital values of oxygen saturation. It was therefore concluded that the results produced by the model were valid. c. Determination of validity of heartbeat resultsTo determine the validity of the artefact to produce correct heartbeat results, a program in Appendix D was loaded onto a microcontroller for the BAN artefact. Measurements of heartbeat were obtained from a patient using the programmed BAN artefact and the results were obtained on a serial monitor as shown in Figure 19 below. 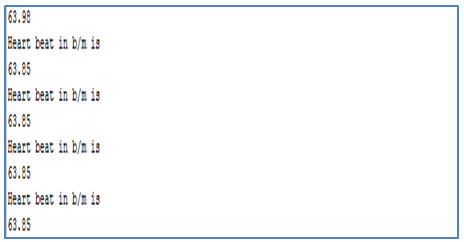 | Figure 19. Determination of validity of heartbeat results |
From the results obtained, it was determined that the artefact was able to reproduce continuously, repeated serial digital values of heartbeat. Therefore, it was determined that the results produced by the model were valid.
3.5. Cost of the Model
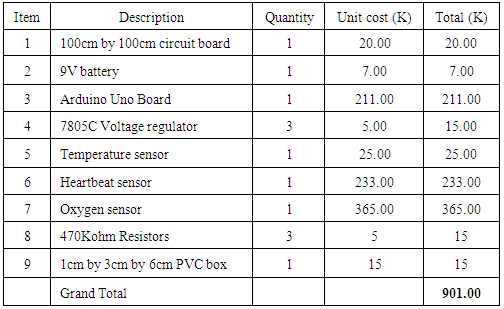
The designed BAN model weighed 250g. The cost of implementing the low cost model with three sensors is shown in Table 2 below. Table 2. Cost of Implementing a BAN Artefact
 |
| |
|
4. Discussion
The first microcontroller proposed for the study was the programmable interface microcontroller PIC16F877A with Proteus 8 professional as a simulation software and Micro C Pro for PIC software for programming. Though it is recommended for academic projects, it is not easy to interface with components as it would need additional components for interfacing especially with serial communication shields. Furthermore, the software for simulation is proprietary, not easy to program and costs a minimum of K5000 for a starter kit.Therefore, an Arduino Uno microcontroller was proposed with associated miniature sensors. The main advantages of this microcontroller are that it is readily available at low cost, it has libraries for standard programs, it is easy to program, the package is small and it is an open source hardware with an open source free software compared to the PIC16F877A. In addition, it interfaces well with any miniature, affordable and robust sensors. The model was tested in the Electrical and Electronics Laboratory in the School of Engineering at the University of Zambia.
4.1. Software Program
The proposed program developed was used in the model to convert analogue inputs from sensors into serial digital outputs. Sampling of the output line voltage from the three sensor circuits was done using the analogue to digital converter on Arduino Uno microcontroller. Software signal processing and display on a serial monitor was achieved by means of an open source software version 1.6.3. The function analogue-read in the program returned a value between 0 and 1023, signifying a voltage level on any analogue input pin to which the sensor was connected. The analogue read function took a quick 100us to execute and return the converted value. However, there was some level of jitter in the input analogue voltage despite smoothing [16] the input and using analogue input stabilising period of 10 seconds. The model was able to capture voltage values and output serial digital output values that were displayed on the serial monitor.
4.2. Evaluation of the Model
From the results obtained by comparison of clinical values to those of the artefact, it was determined that the artefact was reliable as its accuracy was at least 99 percent, owing to jitter in the input analogue parameters. Furthermore, repeatability of the same results by the model from an individual showed that the model results were valid.
4.3. Cost of Implementing a BAN Artefact
As part of the objectives, a low cost BAN artefact for a health monitoring system was developed. The one off cost of implementing the system was K901.00. This one off cost could result in reduction in running health and logistical expenses when doing regular check-ups by patients. Furthermore, it would translate in reduction in hospital equipment and medical manpower expenses as there would be reduction in the strain on manpower and hospital infrastructure due to regular check-ups.
4.4. Literature Reviewed
The literature reviewed highlighted a number of issues to support improvement to the existing research. It was determined that firstly; the types of sensors and the microcontroller chosen, and secondly the software deployed in development of a program affect the complexity and cost of the architecture of a BAN platform. It is therefore vital to consider the type of sensor used; whether wired or wireless, frontend or backend in order to reduce on the power requirements of the BAN artefact. Furthermore, it is vital to determine the type of microcontroller employed in the processing unit; whether open source or proprietary, in order to reduce on cost and complexity of the BAN artefact designed.
5. Conclusions and Recommendations
5.1. Conclusions
From the literature reviewed and subsequent analysis, it was determined that a number of BAN architectures existed and that the types of components employed in design of the BAN artefact determined the complexity of the type of model achieved. This empirical study developed a low cost BAN artefact for a remote health monitoring system using an open source Arduino Uno microcontroller to perform analogue to digital conversion of three physical parameters namely temperature, oxygen saturation and pulse rate using low cost miniature sensors. The serial digital outputs were then displayed on a serial monitor. This meant that they can be communicated to a remote site via any form of wireless network. The ability to monitor patients remotely can improve the healthcare service delivery resulting in benefits for both the patients and the healthcare givers. Physical cases at the hospitals would only be limited to those that are serious and require immediate physical presence of a physician.Furthermore, literature reviewed showed that there is proprietary and open source software for development of a source code depending on the type of microcontroller used. In this study, a program was developed using an open source Arduino software version 1.6.3 and uploaded to an Arduino Uno Microcontroller in the processing unit of the developed BAN artefact. This program successfully performed analogue to digital conversion of corresponding voltage values from temperature sensor, pulse rate sensor and oxygen saturation sensor. The solution proposed in this study is cost effective and of great economic benefit to the health sector. The high cost of healthcare service delivery could be greatly reduced in developing countries by removing regular check-ups of physical parameters by patients and allow only serious cases to be physically attended to at medical facilities.
5.2. Recommendations
In view of the findings of the study, the following recommendations were made: a. The number of physical parameters measured can be increased to six by modifying the software program;b. In future research, Jitter in analogue inputs could be eliminated by improving the processing circuit on the input to the microcontroller.
ACKNOWLEDGEMENTS
I would like to acknowledge the guidance of my supervisor, Dr S. Tembo for his relentless supervision and constant reminders during the course of my thesis. I would also like to acknowledge Med-cross clinic and Zambia Air-Force Lusaka sick quarters for their support in allowing me conduct my findings at their premises.
References
| [1] | Republic of Zambia, (2010) Zambia Central Statistics, retrieved from http://www.zamstats.gov.zm/census/cen.html |
| [2] | Ministry of Health of the Republic of Zambia, (2010) National Health Strategic Plan 2011-2015: Towards attainment of health related Millennium Development Goals and other National Health Priorities in a clean, caring and competent environment, retrieved from http://www.moh.gov.zm/docs/nhsp.pdf. |
| [3] | Republic of Zambia (2012) National Health Policy: A Nation of Healthy and Productive People, retrieved from http://mlazambia.org/library/listings/national-health-policy-2012. |
| [4] | World Health Organisation. Regional office for Europe (2014), Prevention and control of non-communicable diseases in the European Region a progress report. Copenhagen: European Regional office, UN City. |
| [5] | J. Singh and M. Shelar, (2013) Wireless Patient Health Monitoring System, International Journal of Computer Applications, 62, 1-5. |
| [6] | R. Chandra, A. Rathee, P. Verma and A. Chougule, (2014), GSM Based Health Monitoring System, International Journal of Industrial Electronics and Electrical Engineering, 2, 79-82. |
| [7] | S.K. Subudhi and S. Sivanandam, (2014) Intelligent Wireless Patient Monitoring and Tracking System, International Journal of Interdisciplinary and Multidisciplinary Studies, 1, 97-104. |
| [8] | A.V. Kale, S.A. Patil, S.D. Gawade and S.Y. Jadhav, (2015) GSM Based Heart Rate and Temperature Monitoring System, International Journal of Engineering Research and Technology, 4, 118-121. |
| [9] | T.J. Ellis and Y. Levy, (2010) A Guide for Novice Researchers: Design and Development Research Methods, Proceedings of Informing Science & IT Education Conference (InSITE), casino, Southern Italy, June 19-24, 2010, Eli Cohen, Ed. Washington, D.C., IEEE Computer Society Press, 108-118. |
| [10] | A.V. Halteren, R. Bults, K. Wac, N. Dokovsky, G. koprinkov, I. Widya, D. Konstantas, and V. Jones, (2004) Wireless Body Area Networks for Healthcare: the MobiHealth Project, Studies in Health Technology and Informatics, 108, 121 – 126. |
| [11] | J. Ko, C. Lu, B. Mani, J. A. Stankovic, J.A , M.B. Srivastava, Andreas Terzis, and Matt Welsh, (2010) Wireless Sensor Networks for Healthcare, Proceedings of the IEEE | Vol. 98, No. 11, November. |
| [12] | A. Milenković, C. Otto and E. Jovanov, (2006) Wireless Sensor Networks for Personal Health Monitoring: Issues and an Implementation, retrieved from http://www.ece.tufts.edu/ee/194HHW/papers/milenkovic_compcomm06.pdf. |
| [13] | S. Kumar and S.Sivanandam1, (2014) Intelligent Wireless Patient Monitoring and Tracking System, International Journal of Interdisciplinary and Multidisciplinary Studies, Vol 1, No.3, pp 97-104. |
| [14] | A. Vasilakos, H. Cao, M. Chen, S. Gonzalez, V.C. Leung and X. Liang, (2011) Body area networks: A survey, IEEE Communications Letters, vol. 16, No. 2, pp.171–193. |
| [15] | World Health Organization, (2011) Pulse oximetry training manual, Geneva: WHO Press. |
| [16] | Arduino, (2015) Arduino Uno. [Online] Available from: https://www.arduino.cc/en/Main/arduinoBoardUno. [Accessed: 2nd January, 2015]. |
| [17] | World Health Organisation (2014), Non communicable Diseases: Country Profiles 2014, retrieved from http://apps.who.int/iris/bitstream/10665/128038/1/9789241507509_eng.pdf. |
| [18] | T. Puoanei,, L. Tsolekilei, D. Sandersi W. Parker,(2008) School of Public Health, University of the Western Cape: South African Medical Research Council, pp. 73-88. |
| [19] | The World Bank, (2011) The Growing Danger of Non-Communicable Diseases, Acting Now to Reverse Course, 1818 H Street, N.W. Washington, DC 20433, retrieved from: http://siteresources.worldbank.org/HEALTHNUTRITIONANDPOPULTION/Resources/Peer-Reviewed-Publications/WBDeepeningCrisis.pdf. |

 Abstract
 Reference
 Full-Text PDF
 Full-text HTML