-
Paper Information
- Paper Submission
-
Journal Information
- About This Journal
- Editorial Board
- Current Issue
- Archive
- Author Guidelines
- Contact Us
International Journal of Prevention and Treatment
p-ISSN: 2167-728X e-ISSN: 2167-7298
2015; 4(4): 59-65
doi:10.5923/j.ijpt.20150404.01

Modulation of α1 and β2 Microglobulins, and Albumin-Globulin Ratio in HIV Sero-Positive Subjects on Antiretroviral Drugs at Nnewi, Nigeria - A Case Controlled Study
 Abstract
 Reference
 Full-Text PDF
 Full-text HTML
Uchenna Modestus Ezugwu1, Gabriel Ejike Igbokwe2, Ogechukwu Jude Okoye3, Chimezie Joseph Awalu1, Onyebuchi Desmond Chikezie1
1Department of Medical Laboratory Science, Chemical pathology Unit College of Health Sciences and Technology, Nnamdi Azikiwe University, Nnewi Campus, Nigeria
2Department of Applied Biochemistry, Nnamdi Azikiwe University, Awka, Nigeria
3Medical Laboratory Science Department, Babcock University, Ilishan-Remo, Nigeria
Correspondence to: Uchenna Modestus Ezugwu, Department of Medical Laboratory Science, Chemical pathology Unit College of Health Sciences and Technology, Nnamdi Azikiwe University, Nnewi Campus, Nigeria.
| Email: |  |
Copyright © 2015 Scientific & Academic Publishing. All Rights Reserved.
This work is licensed under the Creative Commons Attribution International License (CC BY).
http://creativecommons.org/licenses/by/4.0/

Human immunodeficiency virus (HIV) is associated with immune system activation and chronic inflammation. This study aimed to evaluate the effect of HIV infection on Albumin and Globulin fractions as a possible marker of inflammation in HIV infected subjects. This is a case controlled study involving one hundred (100) HIV sero-positive subjects made up of male and female aged 20-50years which consist of 50 sero-positive subjects on antiretroviral therapy (ART) for a minimum of 6 months and 50 sero-positive subjects not on ART yet all of which attend HIV clinic at Nnamdi Azikiwe University University Teaching Hospital (NAUTH), and 50 apparently healthy, age sex matched HIV sero-negative as control subjects. CD4+ T- cell count was estimated by Cyflow SLGreen. Alpha1microglobulin (α1M) and Beta2 microglobulin (β2M) were estimated by enzyme linked immunosorbent assay (ELISA). Albumin and total protein were estimated by colometric method, while globulin and albumin/globulin ratio were determined by calculation. The data obtained were subjected to statistical analysis using SPSS software application (version 21.0) and the results expressed as mean ± standard deviation. The serum levels of both αIM and β2M in ART group (29.5±18.22mg/l and 10.84±5.33µg/ml) and Non-ART (32.2±41.6mg/l and 15.45±10.8 µg/ml) were significantly higher compared to the control group (8.0±1.78mg/l and 6.89±2.31 µg/ml) (p<0.05). There was a significant difference (p<0.05) in albumin level in the ART group (39.0±7.43g/l) compared to Non-ART group (35.58±7.62g/l). Furthermore, Albumin was lowest in the Non-ART group (35.58±7.62g/l) and highest in the control (40.4±4.67g/l) while total protein was lowest in the control group (66.38±6.89g/l) and highest in the Non-ART group (82.34±13.63g/l) and when compared between the groups was statistically significant (p<0.05). Globulin was highest in the Non-ART group (46.80±12.60g/l) and lowest in the control group (25.90±3.10g/l), Albumin/globulin ratio was lowest in the Non-ART group (0.70±0.30) and highest in the control group (1.50±0.20) and when compared between the groups was statistically significant (p<0.05). Positive association was observed between α1M (r=0.303 p = 0.033) and Albumin (r = 0.333, p = 0.018) with CD4+ T cell in Non-ART group. In conclusion, the significant changes in the biochemical parameters measured suggest a redistribution in Albumin and globulin fractions in ART and Non-ART group especially the lowest Albumin/globulin ratio observed in the non-ART subjects indicate an active disease progression as against a regressive disease state in ART subjects. Hence, A/G ratio can be used as a prognostic marker for HIV infection”.
Keywords: Alpha1 microglobulin, Beta2 microglobulin, Albumin, Globulin, Albumin-Globulin ratio, HIV
Cite this paper: Uchenna Modestus Ezugwu, Gabriel Ejike Igbokwe, Ogechukwu Jude Okoye, Chimezie Joseph Awalu, Onyebuchi Desmond Chikezie, Modulation of α1 and β2 Microglobulins, and Albumin-Globulin Ratio in HIV Sero-Positive Subjects on Antiretroviral Drugs at Nnewi, Nigeria - A Case Controlled Study, International Journal of Prevention and Treatment, Vol. 4 No. 4, 2015, pp. 59-65. doi: 10.5923/j.ijpt.20150404.01.
1. Introduction
- Human immunodeficiency virus (HIV) is a lentivirus that causes acquired immunodeficiency syndrome (AIDS), [1] [2], a condition in humans in which progressive failure of the immune system allows life-threatening opportunistic infections and cancers to thrive. HIV is associated with chronic inflammation [3] and are characterized by profound immune deficiency, early stages are marked by ongoing immune activation [4]. Antiretroviral therapy (ART) refers to the use of pharmacologic agents that have specific inhibitory effects on HIV replication. The use of effective ART has resulted in tremendous improvement in morbidity and mortality in HIV-positive patients. Antiretroviral therapy (ART) remains the most successful therapy against AIDS till date. Unexpected inflammatory disorders, known as immune restoration inflammatory syndrome, can sometimes accompany the beginning of ART due to increased inflammation during immune reconstitution in immunocompromised HIV-infected patients [5]. HIV infected individuals who are not on antiretroviral therapy and can also indicate the extent of a patient’s response to HIV treatment [6]. The serum albumin level is considered one of the prognostic marker, as it has been shown that a low level of serum albumin, after seroconversion is associated with faster HIV disease progression [7].Reduced levels of serum albumin, even within the reference ranges are associated with increased mortality in a number of populations, including healthy individuals and those with a variety of acute and chronic conditions [8]. This inverse relationship between serum albumin levels and mortality appears to be continuous over a broad range of serum albumin values. For each 25 g/l decrement in serum albumin concentration the odds of death have been reported to increase by 24–56% [8]. The association predicts overall and cause-specific mortality. The serum albumin concentration therefore, appears to be a sensitive predictor of preclinical disease and disease severity. The protective effect of higher levels of serum albumin persist after adjustment for other known risk factors, pre-existing illness and the exclusion of early mortality. However, little data exists that address the utility of serum albumin as a prognostic marker in HIV-infected individuals. Globulins are formed in the liver, immunoglobulins are produced by the reticuloendothelial system, the lymph nodules and plasma cells. An increase in total protein may be caused by dehydration and a decrease from overloading with water. The disease progression arises from an increase in total globulin most often the gamma-globulin, the albumin remaining normal or being reduced to a lesser extent. Increased globulin concentration usually occurs in the gamma- globulin fraction (or immunglobulins) and there is a corresponding increase in the total protein concentration, the most common causes of hypergammaglobulinemia are chronic infections such as HIV Infection, liver diseases, and lymphoma. This study aimed to evaluate the effect of HIV infection on Albumin and Globulin fractions as a possible marker of inflammation in HIV infected subjects.
2. Materials and Methods
- Subjects RecruitmentParticipants were recruited at the Voluntary Counseling and Testing (VCT) unit and HIV Clinic of Nnamdi Azikiwe University Teaching Hospital (NAUTH) Nnewi, South-Eastern Nigeria. At the VCT, participants were counseled on HIV infection, health implication and management of HIV positive patients. One hundred and fifty (150) subjects were recruited for the study which includes fifty (50) HIV seropositive subjects already on ART treatment for a minimum of 12 months (Lamivudine (150mg), Zidovudine (150mg) and Nevirapine (200mg), fifty (50) HIV sero-positive subjects not on ART and fifty (50) apparently healthy aged sex matched sero-negative individuals were recruited as control.Sample CollectionSix milliliters of blood sample (6ml) was drawn from the vein by venepuncture with minimum stasis and aliquoted as follows; Three millilitres (3ml) was drawn into vacutainer tubes containing di-potassium salt of Ethylenediaminetetra-acetic acid (K2EDTA) for CD4+T cell Count, then three millilitres (3ml) into plain specimen container, the sample was allowed to clot and centrifuged for 10 minutes at 3500rpm.Serum was separated and kept immediately in a freezer at -20°C untill the time of analysis (estimation of α1m, β2m, Total protein and Albumin).Ethical IssuesInformed consent was obtained from those who participated in the study. The Nnamdi Azikiwe University Teaching Hospital Board of Ethical Committee gave their approval for this study. (Ethical approval number: NAUTH/ CS/66/Vol.6/102) the study design in October, 2014.HIV screening was carried by both immunoassay and immunochromatographic methodsImmunoassay methodHIV screening was performed using Abbot determine HIV-1 and 2 kit. (Abbot Japan Co ltd. Tokyo, Japan). The procedure was as described by the manufacturer. Briefly, 50μl of plasma sample from participants were applied to appropriately labeled sample pads. After 15 minutes of sample application, the results were read. The inherent quality control of the kit validates the results. Two visible red lines occurring in the region labeled control and test represents HIV seropositive reaction while a single red colour in the region of control validates the test kit. Absence of red line in the test region represents HIV seronegative reaction.Immunochromatographic method.HIV screening by Immunochromatographic method using HIV 1 and 2 STAT-PAK assay kit. (Chembio diagnostic system, INC New York, USA). This method utilizes immobilized antigen for the detection of antibodies to HIV 1 and 2 in the human plasma. The procedure was as described by the manufacturer of the kit. In brief, 50μl of plasma sample was dispensed into appropriately labeled sample wells, then three drops of running buffer was added drop-wise into the appropriately labeled sample wells. The results of the test were read at 10 minutes after the addition of the running buffer. This method had inherent quality control that validates the results. The presence of two pink lines in the region of test sample and control indicates HIV seropositive reaction while a single pink line at the control region indicates HIV seronegative reaction. HIV seropositive results using these two methods were used to confirm participants presenting with HIV infection.Determination of CD4+T-cells count by Cyflow (Germany)About 50 μl of whole blood in EDTA anticoagulant was dispensed into a partec test tube and 10 ml of CD4 PE antibody was added. The reaction mixture was mixed and incubated in the dark for 10–15 min. After the incubation, 800 μl of the already prepared diluted buffer was added to each reaction tube and vortexed. The partec tubes containing these reactions were plugged in position in the Cyflow SL Green (Partec, Germany), which has already been connected to flow max software, CD4 count template data file and CD4 count instrument. The test was run on the Cyflow for 90 sec. The results were displayed as histogram and printed. The CD4+ T-cell count was read off the histogram correcting for the dilution factor.Estimation of Alpha-1 MicroglobulinThe procedure was as described by the manufacturer of the kit (ABCAM laboratories Ltd., UK) using ELISA machine AWARNESS TECHNOLOGY MODEL NO:STATFAT 2000100.Alpha 1 Microglobulin specific antibody had been precoated onto 96-well plates and blocked. Standards or test samples were added to the wells and subsequently an alpha 1 Microglobulin specific biotinylated detection antibody is added and then followed by washing with wash buffer. Streptavidin-Peroxidase Conjugate is added and unbound conjugates were washed away with wash buffer. 3,3’,5,5’-tetramethylbenzidine (TMB) is then used to visualize Streptavidin-Peroxidase enzymatic reaction. TMB is catalyzed by Streptavidin-Peroxidase to produce a blue colour product that changes into yellow after adding acidic stop solution. The density of yellow coloration is directly proportional to the amount of alpha 1 Microglobulin captured in plate.Estimation of Alpha-2 MicroglobulinThis was as described by the manufacturer of the kit (ABCAM laboratories Ltd., UK) using ELISA machine AWARNESS TECHNOLOGY MODEL NO:STATFAT 2000100.This assay employs an affinity tag labeled capture antibody and a reporter conjugated detector antibody which immunocapture the sample analyte in solution. This entire complex (capture antibody, analyte and detector antibody were immobilized via immunoaffinity of an anti-tag antibody coating the well. Then, sample or standards were added to the well followed by the antibody mix. After incubation, the wells were washed to remove unbound material. Tetra methylbenzidine (TMB) substrate was added and during incubation is catalyzed by horseradish peroxidase (HRP), generating blue colouration. This reaction was stopped by addition of stop solution completing the colour change from blue to yellow. The density of yellow coloration is directly proportional to the amount of beta 2 Microglobulin captured in plate.Estimation of Serum Total Protein by biuret Method [9]. The procedure used was as described by the manufacturer of the kit (Randox Laboratories Limited UK). Briefly, different test tubes were set up for patient’s serum (Test), Control, Standard and Blank. Then 1ml (1000µl) of biuret reagent was dispensed into different test tubes. After which 0.02ml (20µl) of patient’s serum (Test), control sample and standard was dispensed into their respective test tube. They were mixed immediately and incubated for 30minutes at room temperature. The absorbance of the patient’s serum, control and the standard were measured using spectrophotometer at 540nm wavelength against reagent blank.Determination of serum albumin by Bromocresol Green (BCG): [10]. The procedure used was as described by the manufacturer of the kit (Randox Laboratories Limited UK). Briefly, 10 μl of serum from each participant was added to appropriately labeled test tubes containing 3ml of BCG. The reaction mixture was allowed to stand for 5 minutes at room temperature. For the standard albumin and blank reagent test reactions, similar procedure as explained for sample test was followed except addition of serum sample. The absorbance of samples and standard was read using spectrophotometer at 620 nm wavelength against reagent blank and the concentration of serum albumin in each sample was calculated.Estimation of serum globulin was determined by: mathematic method i.e. the concentration of total serum protein minus serum albumin give the concentrations of serum globulin [11]. Estimation of albumin / globulin ratio was determined by: Albumin concentration divided by Globulin concentration [12].Statistical AnalysisThe data obtained were statistically analyzed using SPSS Version 21.0 statistical package. Analysis of variance (ANOVA) was used to compare the differences in the parameters measured between the three groups, the variables were expressed as mean (± SD). The pearson’s correlation coefficient was used to assess the level of association between two variables. Significant level were considered at p <0.05.
3. Results
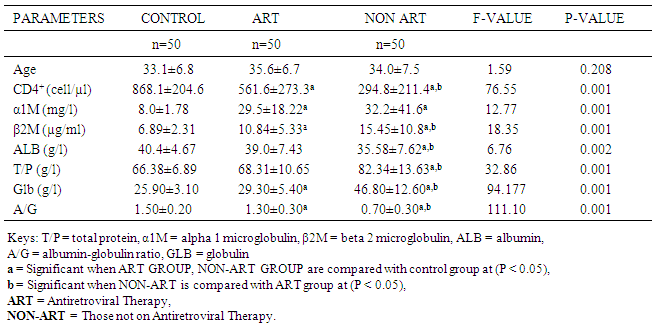
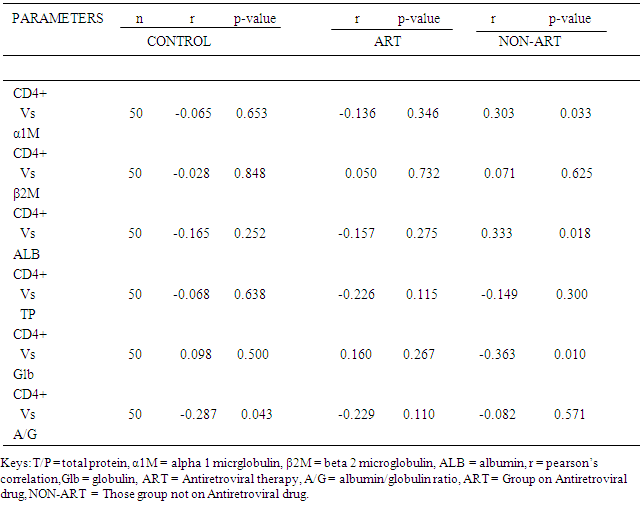
- Table 1 shows comparison of mean level of Age, CD4+ T-Cell, α1M, β2M, ALB, GLB, A/G ratio and TP in control group, ART group and Non ART group (mean ± SD).The results showed that the CD4+ T-Cell count in the control was significantly higher (P<0.05) compared to the ART group and Non-ART group. The CD4+ T-Cells count in ART group was also significantly higher (P < 0.05) compared to Non-ART group. The results also showed that the serum level of both α1M and β2M in both ART group and Non-ART group was significantly higher (P < 0.05) compared to control. There was also a significant difference (P<0.05) in β2M level between Non-ART group and ART group, but there was no significant difference in α1M level between ART group and Non-ART. furthermore, serum Albumin and total protein showed an inverse pattern while Albumin was lowest in the Non-ART group and highest in the control, total protein was lowest in the control group and highest in the Non-ART group and when compared between the groups was statistically significant (p < 0.05). Similarly, serum globulin and Albumin/globulin ratio showed an inverse pattern while globulin was highest in the Non-ART group and lowest in the control group, Albumin/globulin ratio was lowest in the Non-ART group and highest in the control group and when compared between the groups was significant (p < 0.05).There was no correlation between CD4+ T-Cell and αIM, β2M, ALB, GLB,TP in Control group and ART group, but there was a positive association (r = 0.303., P = 0.033) between CD4+ T-Cell and α1M in Non-ART and between (r = 0.33; P = 0.018) CD4+ T-Cell and ALB in Non-ART group. A negative association exist between (r = -0.363; P = 0.010) CD4+ T-Cell and Globulins in the Non-ART group and between (r =-0.287; P=0.043) CD4+ T-Cell and A/G ratio in the control groups. Correlation between various globulins yielded no meaningful association.
|
|
4. Discussion
- Human immune deficiency virus infection is characterized by inflammation, defect in cellular immunity and cellular immune activation with a depression ratio of helper T- lymphocyte to suppressor T-lymphocyte [13]. Beta-2 microglobulin (β2M) is a component of major histocompartibility complex (MHC) class I molecules, which is produced predominately by B lymphocyte, but upon immune system activation both T and B lymphocytes actively release β2M into the circulation [14]. Hence, B2M in serum can aid in the clinical assessments of activation of cellular immune system. Alpha1- microglobulin (α1M) on the other hand is actively produced and secreted by T and B lymphocytes [15] and by the liver [16]. The results of this work has shown that CD4+ T-Cell count in the controls was significantly higher (P<0.05) compared to the ART group and Non-ART group. This could be attributed to the depletion of the CD4+ T-Cell count by the HIV virus in the seropositive subjects, this is in line with work done by [17], [18] [19], all observed low level of CD4+ T-cell count in HIV infected patients in Nigeria. This study revealed also that the serum level of β2M in ART group and Non-ART was significantly higher (p<0.05) compared with control group, however the value of β2M was found to be higher in Non-ART subjects compared with ART subjects which means its elevation in HIV seropositive subject, this could be as a result of inflammation and cellular immune activation. [20] reported a high serum level of β2M in HIV subjects and [21] observed elevated β2M in homosexual men with AIDS. [22] also demonstrated elevated β2M level in HIV seropositive patients with AIDS. A similar trend were observed by [23] [14].This work also revealed increased β2M level in Hiv seropositive group. This is consistent with work of [24], [25], and [26] where they documented high serum level of β2M in HIV seropositive subjects and further demonstrated the prognostic value of β2M in the clinical course of HIV infection. The β2M level of Non-ART group showed a significant difference (P<0.05) when compared with ART group which means that β2M continue to rise as the disease progresses to AIDS, this concurs with the work of [22], they reported that β2M is a powerful predictor to monitor progression of HIV seropositive subject to AIDS.On the other hand, there was a significant increase (p<0.05) in the serum level of α1M in both ART group and Non-ART group compared to control. But there was no significant difference between the value of α1M in ART and Non-ART subjects when compared. There was a positive association (r=0.303; P = 0.033) between the CD4+ T-cell and α1M in Non-ART group. This could be adduced to uncontrolled inflammation in Non-ART group. These rise in serum levels of α1M in both ART group and Non-ART group compared to control and the positive association between CD4+ T-cell and α1M in Non-ART groups suggest that α1M can be used to monitor the level of inflammation and cellular immune activation associated with disease progression in HIV seropositive subjects. [27], [28] reported increased level of α1M in renal disorder, however, no work has been cited on α1M level in HIV seropositive subjects. This study has shown reduction in serum albumin in HIV positive subjects compared to control, which could be attributed to inadequate nutrient intake and metabolic alteration. This agrees with work done by [29] and [30] documented a decrease in serum albumin in HIV subjects and [31] in their studies observed that HIV infected women had a significantly lower mean serum albumin compared with uninfected subjects. There was a significant difference (p<0.05) between the Albumin in ART group compared with Non-ART. This could be due to inadequate nutrient intake, metabolic alteration, and drug nutrient interactions. This is in line with research done by [6] in which the albumin level in post treatment HIV group was higher compared to pretreatment Albumin level in Non-ART group. There was also a significant positive correlation (r= +0.333, p=0.018) between the CD4+ T-cell and albumin in Non–ART groups. Furthermore, this study has shown that measurement of serum albumin level is a less expensive investigation and can be used to monitor response to treatment because of the significant difference (P<0.05) between the albumin level in ART group when compared with non-ART group and also because of the positive correlation between the CD4+ T-cell count and albumin level in Non-ART group.Total protein and globulin were significantly higher (p<0.05) in Non-ART and ART group when compared to control, this could also be due to metabolic alteration and possibly from the increased globulin fraction. This support the work done by [32] which documented significant higher serum level of total protein when compared to control. There was also increase in globulin fraction which is essentially a compensatory mechanism for decreased albumin synthesis as seen in the HIV subjects, on the hand other the increased in globulin fraction in the HIV subjects may be attributed to humoral immune responses in the HIV subjects which is more vigorous in Non-ART group, this present work supports that of [20] and [33] where they reported high level of globulin fraction in HIV subjects compared to controls. This study have shown that abnormally high globulin fractions in the HIV subjects is associated with effective control of HIV disease progression and that humoral responses may have indirect effects on viral replication. Similarly the globulin fraction level in ART group was significantly lower (p < 0.05) when compared with Non-ART, this could be due to reduction in viral replication by the drugs resulting in the improvement of health. A similar finding of reduced level of globulin fraction after initiation of antiretroviral therapy was documented [34]. The elevated globulin fraction is a characteristic of chronic inflammatory condition generally created by viral infection. Furthermore there was a significant negative correlation (r=-0.363, p=0.010) between the CD4+ T-cell count and the globulins in the Non-ART group. The albumin/globulin ratio in HIV subjects was lowest in the Non-ART group when compared with the ratio of albumin/globulin obtained from HIV-infected subjects on ART and the controls. However, there was also a significant difference between the ratio of albumin/globulin obtained from ART and Non-ART subjects when compared, this alteration suggest possible loss of albumin function in HIV subjects especially the Non-ART and could contribute to HIV complications. [35] documented decreased level of Albumin/globulin ratio in HIV subjects. The A/G-ratio is commonly used as an index of the distribution of albumin and globulin fractions.
5. Conclusions
- The significant changes in the biochemical parameters measured suggest a redistribution in Albumin and globulin fractions in ART and Non-ART group especially the lowest Albumin/globulin ratio observed in the non-ART subjects indicate an active disease progression as against a regressive disease state in ART subjects. Hence, A/G ratio can be used as a prognostic marker for HIV infection”.