-
Paper Information
- Paper Submission
-
Journal Information
- About This Journal
- Editorial Board
- Current Issue
- Archive
- Author Guidelines
- Contact Us
International Journal of Probability and Statistics
p-ISSN: 2168-4871 e-ISSN: 2168-4863
2021; 10(3): 63-73
doi:10.5923/j.ijps.20211003.01
Received: Nov. 10, 2021; Accepted: Nov. 29, 2021; Published: Dec. 15, 2021

Graphical Optimization of Mixture-Process Experiment: An Application to Diabetes Mellitus Herbal Treatment
 Abstract
 Reference
 Full-Text PDF
 Full-text HTML
Gladys Gakenia Njoroge
Department of Physical Sciences, Chuka University, Chuka, Kenya
Correspondence to: Gladys Gakenia Njoroge, Department of Physical Sciences, Chuka University, Chuka, Kenya.
| Email: |  |
Copyright © 2021 The Author(s). Published by Scientific & Academic Publishing.
This work is licensed under the Creative Commons Attribution International License (CC BY).
http://creativecommons.org/licenses/by/4.0/

Many of the herbal medicines involving mixtures have process variables and assessing the effect of the mixture and process simultaneously is economical. Little application of designs of mixture-process experiments has been made on herbal medicine especially where optimization of both the mixture and process is concerned. This study set out to: carry out a mixture-process experiment using the most optimal split-plot design on herbal medicine for diabetes mellitus control using alloxan-induced diabetic albino wistar rats; and determine a model that provides a good fit to the experimental data and analyse it. To achieve the aims of the study, the most efficient optimal split-plot design was employed to obtain optimal mixture proportions of three herbal drugs and their extraction conditions on change of blood glucose level of alloxan-induced diabetic albino wistar rats. Secondly, a 28-term model was fitted to the experimental data, model adequacy tested and model reduction done accordingly. The final fitting model was used to carry out graphical optimization to obtain optimal mixture components and extraction conditions of the herbal formula. The general finding was that the single herbs were more effective than the complete mixtures with Cinnamomum verum being the most effective single herb. The extraction conditions of the herbs have an effect on the way the herbs, whether singly or in a mixture affect the response. Further, the optimal predicted response was 10.848mmol/l change in blood glucose level produced by a mixture blend of 491.5mg of Cinnamomum verum and 385.5mg of Gymnema sylvestre extracted at 25°C and a time of 15 minutes. These findings imply that mixing of herbs should only be done if it is experimentally proven that the mixture works better than the single herbs. The optimal extraction conditions for the herbs should be experimentally established for maximum effect. This further implies that any policies being formulated in order to regulate the standards and practise of herbal medicine should be based on research.
Keywords: Graphical optimization, Split-plot design, Mixture, Process, Diabetes mellitus
Cite this paper: Gladys Gakenia Njoroge, Graphical Optimization of Mixture-Process Experiment: An Application to Diabetes Mellitus Herbal Treatment, International Journal of Probability and Statistics , Vol. 10 No. 3, 2021, pp. 63-73. doi: 10.5923/j.ijps.20211003.01.
Article Outline
1. Introduction
- In many fields such as food, chemical, clinical science, pharmaceutical and the process industries, a response of interest is usually influenced by several variables and the objective is to optimize this response. Response Surface Methodology (RSM) is defined as a collection of Mathematical and Statistical techniques that are useful for the modelling and analysis of problems in which a response of interest is influenced by several variables and the objective is to optimize this response [17]. The practical application of RSM requires developing an approximating model for the true response surface [19]. Mixture designs are special cases of response surface designs with prediction and optimization as the main goals [21]. The measured response in mixture experiments is assumed to depend only on the relative proportions of the ingredients in the mixture and not on the amount of the mixture [9]. The mixture experiment serves two main purposes: modelling the blending surface with some form of Mathematical equation and finding the “finest mixture” in regard to a well-defined response variable and an optimality criterion on it. The unrestricted design region for mixture proportions is a simplex, which is a regularly sided figure of dimension
 with
with  vertices for
  factors. The exploration of a response surface over the simplex region involves: selecting of an appropriate model to approximate the surface over the region of interest, testing of the adequacy of the model in representing the response surface, developing an appropriate design for collecting observations, fitting the model to the data and testing the model’s adequacy of fit [8]. There are many practical situations in which the response of interest may be influenced by both the mixture components and experimental conditions. These experimental conditions are referred to as the process variables and they are not part of the mixture components. However, their levels when changed could affect the blending properties of the components [9]. A combination of the mixture design (for the mixture ingredients) and a process design for the process factors leads to a mixture-process experiment. After the data has been obtained using the combined mixture-process experimental designs, polynomial models are then fitted to the data and the appropriate tests for adequacy of fit are carried out. A typical strategy for designing experiments in chemical process industry involves two steps; first, that of fine tuning the formulation via a mixture design and then a second step of optimizing the process with factorial design and response surface methods. When the experiment is designed with the two steps being handled separately however, the interactions between the mixture component variables and those of the process factors cannot be revealed. There is therefore need to have a comprehensive experiment that combines the two in one “crossed” design. The main objectives of a mixture-process experiment are: to determine a model that provides a good fit to the mixture-process data so that the contours of the fitted response surface represent the behaviour of the response to changes in the mixture and process terms and to be able to use the model to interpret the relationship between the mixture components and the process factors. A commonly used design that combines the mixture components and the process factors is the split-plot design [23]. Two levels of randomization exist in the mixture-process variables within the split plot design (SPD) structure leading to two types of errors; the whole plot and the subplot errors. [7] and [31] recommended restricted maximum likelihood (REML) method for estimating the variance component in SPDs. The generalised linear mixed model, which accommodates the two levels of randomization, is advocated for split-plot designs [11], [20].According to [29] and [27] over 90% of the diabetes patients are diagnosed with Type 2 Diabetes Mellitus, T2DM. Either the body cells become insulin resistant or the beta cells in the pancreas do not produce enough insulin or both. The insulin secretion in the pancreas decreases with gradual beta cell failure, making T2DM a progressive disease that makes the patients to get gradually worse [18]. To reduce blood glucose levels, the patients are usually treated with a special diet and physical exercises [16]. Eventually, oral medication and/or insulin injections may be required. The main contributing factors to T2DM include: obesity, lack of physical activity, genetic predisposition (family history), age (onset of puberty is associated with increased insulin resistance), medication causing hyperglycaemia or conditions associated with insulin resistance such as polycystic ovary syndrome [26]. The early warning signs of T2DM include: frequent urination (polyuria), increased thirst (polydipsia), increased appetite (polyphagia), unexpected weight loss, extreme fatigue and blurred vision. If left undiagnosed or poorly managed, T2DM can lead to complications such as stroke, coronary artery disease (CAD), kidney failure, limb amputations and blindness [1], [27]. According to [32] herbal medicine includes; herbs, herbal materials, herbal preparations and finished herbal products that contain as active ingredients, parts of plants, other materials or combinations thereof. A large number of rural populations especially in the developing countries depend on herbal medicine as their main source of primary health care. In both developing and developed countries, there has been increase in public interest and acceptance in natural therapies [22]. Compared to conventional medicines, herbal medicine cost less, are more often used to treat chronic diseases, are more readily available and the occurrence of undesirable side effects seem to be less frequent [6]. Medicinal plants, especially in Africa and Asia have great potentials to alleviate different array of ailments [22]. A number of medicinal plants have been researched on and found to have potential to control and treat diabetes mellitus [1], [14], [18], [22].Experiments have been carried out in laboratories to test the potency of these herbal remedies; a number of these experiments were reviewed. [28] evaluated the effects of methanolic extracts of the bulbs of Garlic, Persian shallot and leaves of sage on the antioxidant enzymes in alloxan induced diabetic Wistar rats. The three extracts were tested separately and their activity compared with diabetic control rats. They used male rats weighing 200-250g. The herbs were extracted using 80% methanol. They concluded that the three extracts were beneficial in the control of diabetes by displaying noticeable antioxidant and hypolipidemic properties. [4] experimented on the protective effect of Commiphora wightii in metabolic activity of STZ induced diabetes in rats. The extraction of the C. wightii was done using ethyl acetate solvent at room temperature. They used male albino Wistar rats of weight 250-300g. They concluded that the extract could be considered as a protective herbal drug for diabetes. [10] on the other hand, carried out an experiment to investigate the hepato-protective properties of combined extracts of Moringa oleifera and Vernoniaamygdalina in STZ induced diabetic albino Wistar rats. Rats of both sexes weighing between 120 and 180g wereused in the experiment. Equal portions of each extract were combined and used in one of the test groups. The herbs were extracted using 80% ethanol at room temperature. The combined extract significantly reversed diabetes in the rats by lowering the Blood Glucose Level (BGL) similarly to glibenclamide and insulin. They however did not check on the synergism of the two extracts nor compared the effect of the combined extract to the single extracts.Extraction is a crucial first step in the analysis of medicinal plants and proper actions need to be taken to ensure that potential active constituents of the plant extract are not lost, destroyed or distorted during the preparation of the extract [24]. The basic parameters influencing the quality of an extract are: the part of the plant used as the starting material, the solvent used for extraction and the extraction procedure employed, [12]. Time and temperature of extraction are important factors in determining the metabolite composition of an extract [13]. Various methods of extraction exist and they usually depend on a number of factors such as: the length of the extraction period, the solvent being used, the pH of the solvent, the temperature of the solvent, particle size of the plant tissues and the solvent to sample ratio [13]. It is important to establish the time required for the extraction since on one hand, insufficient time of extraction means incomplete extraction while on the other hand; over extended extraction time implies unwanted constituents of the plant may also be extracted [5]. The type of solvent used for extraction depends on whether the targeted compounds are polar or non-polar. The polar constituents are extracted using the polar solvents like water and the non-polar constituents are extracted using the non-polar solvents such as hexane [24]. The temperature of the solvent depends on the stability of the constituent compounds towards heat. The thermo-labile constituents are distorted or destroyed at high temperatures and therefore relatively low temperatures should be used, while the thermo-stable constituents can be extracted at high temperatures [3].
2. Materials and Methods
2.1. The Experimental Materials
- A mixture-process experiment was set up in a split-plot design. Alloxan-induced diabetic albino wistar rats were used for the test.
2.1.1. The Herbal Drug Components and Dose Calculation
- The experiment involved three herbal drug components in form of a mixture. The herbal drug components were; Gymnema sylvestre, Cinnamomum verum and Azadirachta indica. The three were identified by [22] to be the most effective in reducing the blood glucose levels among the six used in the screening experiment. The process variables of interest were temperature and time of extraction of the herbal drug components whose effect on change of Blood Glucose Level (BGL) was measured. The solvent used for the extraction of the herbal drug components was water. Clinical trial guidelines were employed in working out the volume of the dosage, while taking into account the dose rate, the weight of the animal, and the concentration of the crude herbal drug [25]. The corresponding equation was
 | (1) |
 | (2) |
 | (3) |

2.1.2. Experimental Animals and Induction of Diabetes
- The animals used in this experiment were albino Wistar rats which were obtained from the Department of Zoological Sciences laboratory of Kenyatta University. The rats selected for the study were 6-7 weeks old with a body weight of between 100g and 140g. Equal number of female and male albino Wistar rats were used. They were fed with standard rodent diet and water ad libitum and were housed in a room with a 12h light and 12h dark cycle at
 .To induce diabetes, the rats were fasted for 16 hours beforehand. Subsequently, they were given a single dose of intra-peritoneal injection of 150mg/kg body weight. This dose was composed of 5% alloxan monohydrate dissolved in freshly prepared citrate buffer (0.1M, pH 4.5). Three days after induction, they were tested for diabetes. To check the blood sugar level, blood sample was obtained by the tail clip method. The BGL test involved placing a drop of blood on a blood glucose test strip, GlucoPlusTM and then inserting the strip into a clinical GlucoPlusTM blood glucose meter. Measurements of the glucometer reading was in minimolar per litre (mmol/l), or mg/dl, where
  Fasting Plasma Glucose (FPG) test was done after 12 hours of fasting. Fasting plasma glucose values ≥ 7.0 mmol/l (126mg/dl) was considered as provisional diagnosis of diabetes. To confirm diabetes, a 2-hour postload glucose ≥ 11.1 mmol/l (200mg/dl) test was taken [2].
2.2. Experimental Design and Data Analysis
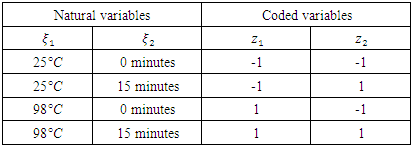
- A combined mixture-process experiment was employed with the aim of simultaneously predicting the optimal mixture proportions and process conditions for the three herbs that would give the highest change in BGL for the alloxan induced albino wistar rats. There were two possible approaches for this experiment: completely randomised approach or a split-plot approach. When there is presence of hand to change factors like temperature and time, a split-plot approach is preferred [15], [17]. Therefore, the experiment was set up in a split-plot design. The split-plot design was composed of two combined designs, a 22 factorial design for the process variables and a simplex-centroid design for the mixture components. I-optimal split-plot design was employed in this experiment since it has the capacity for better prediction properties and also gives more precise measurements of the coefficients of the model parameters as demonstrated by [23]. The three mixture components were denoted as x1 (Cinnamomum verum), x2 (Azadirachta indica), x3 (Gymnema sylvestre) and set up in a simplex-centroid design with the following proportions;
 | (4) |
 , was coded as
  and time for extraction of the herbal drug
  , was coded as
  . The 22 factorial arrangement in the two process variables had the levels of the coded variables denoted as
  and
and  laid out as:
 | (5) |
|
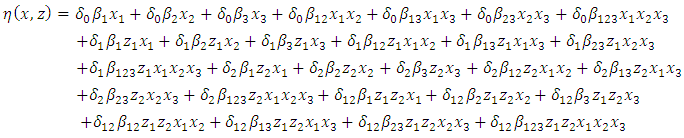
 | (6) |
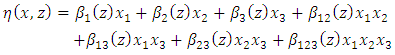
 with interactions was of the form
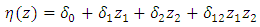 | (7) |
 | (8) |
 | (9) |
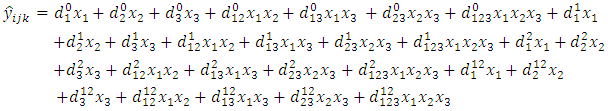 | (10) |
 , is a modified version of
  adjusted to the number of predictors in the model. In addition, its value only increases if the new term(s) or removed term(s) improves the model more than would be expected by chance. If the model did not fit the data, then model reduction was performed by removing any individual terms that were not statistically significant according to the t-statistics tests. This process continued until a final model that appropriately fitted the experimental data was obtained. Upon obtaining the final reduced model that was fitting the experimental data, graphical optimization procedure was employed to get an optimal predicted response as well as the corresponding predictor values of the mixture proportions for the herbal components and the extraction conditions. This was achieved using Design-Expert® version 10.
2.3. The Mixture-Process Experiment
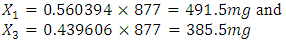
- The total amount of herbal mixture used in this experiment was 877mg for 20ml of water. Thus, the amount used for the different blends was: pure blends (single herb) was 877mg, binary blends (two herbs mixed in equal proportions) was 438.5mg per herb and the tertiary blends (three herbs mixed in equal proportions) was 292.4mg each. The temperature of water and the time taken to carry out the extraction was dependent on the whole plot in consideration. At zero time of extraction, filtration was done immediately the water was added to the solid and the filtrate was left to cool. The 15-minute extraction time at either the 25°C or the 98°C was maintained by use of an electric water bath. All the animals used in this test were induced and confirmed to be diabetic as outlined in section (2.1.2). The total number of rats used in this test were 142; 71 were males and 71 were females. Each group of rats used was composed of equal number of male and female rats. The rats used in this experiment weighed between 100 and 140gm. The design had 38 points; 28 of which were model based, to estimate the 28 model parameters in equation (10). There were five additional points for testing the fitness of the model to the experimental data and another additional five points were replicate points to enable the calculation of the standard error.
2.4. The Experiment Procedure
- First, the albino wistar rats were induced with diabetes and confirmatory test taken three days after as explained in section (2.1.2). They were then fasted over-night but allowed to take water ad libitum. Secondly, fasting plasma glucose for each test rat was taken the following morning and recorded. Thirdly, the body weight of each rat was taken. The weight was used in calculating the volume of treatment to be administered on each of the test rat. Fourthly, glucose solution of 2 gm/kg body weight dissolved in 1.4 ml of water was then given to each test rat orally through Gavages’ method. This glucose solution was meant to raise the blood glucose level of the test rats. The changes in the blood glucose level could then be monitored over time. A peak of the blood glucose level was observed at about the 45th minute. Fifthly, the BGL for each test rat was taken at this 45th minute and recorded as t = 45. Immediately, treatment was administered orally through Gavages’ method, as a solution, to each test rat corresponding to its weight. At the 120th minute of oral glucose consumption the second BGL was taken and recorded as t = 120. The response of interest was the change in blood glucose level that occurred in the 1 hour and 15 minutes after the herbal drug treatment had been administered [21].
3. Results and Discussion
3.1. Results of the Mixture-Process Experiment
- The combined mixture-process experimental results were as presented in table (2).
|

3.2. Discussion of the Results of the Mixture–Process Experiment
- The mixture-process experiment results given in table (2) indicate that the seven mixture blends generated varying effects on the blood glucose level under the different extraction conditions. This implied that the extraction conditions had an effect on the active compounds in the herbs and that either the temperature of the solvent or the time of extraction or both improved the properties of the given mixture blend or made it worse.In the first whole-plot (low temperature and low time), it was observed that under this condition the single herbs produced their highest change in blood glucose levels than under any other extraction conditions. Increased temperature or time did not improve their effect it rather lowered it. This may imply that more time of extraction could have led to extraction of other constituents that may antagonise the active constituents towards controlling the blood glucose level. As regards the effect of high temperature, these components may be thermo-labile and therefore high temperature may be either destroying or distorting the active ingredients toward blood glucose control as pointed out by [3] and also [24]. It could also have been as a result of extraction of other constituents that are extracted at higher temperature, that interfere negatively with the important constituents for blood glucose control as suggested by [5].Another observation from table (2) was that under low level of temperature and time of extraction, both the binary and tertiary mixture blends generally had low values of change in blood glucose level which improved with increased time and temperature of extraction. Low temperature or time of extraction may lead to incomplete extraction of the active constituents for blood glucose control and therefore result in smaller changes in BGL as was observed by [5]. It was important to note from these results that the highest average change in BGL over all the replicates was produced by the mixture blend of cinnamon and Gymnema at high level of time but low level of temperature. Notably, this value goes down when temperature is increased. The observation implies that a mixture of the two components require a longer time of extraction though the single components were better off with low time.
3.3. Modelling and Analysis of the Mixture-Process Experiment Data
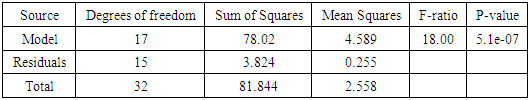
|
|
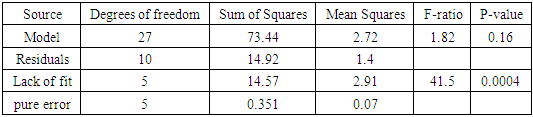
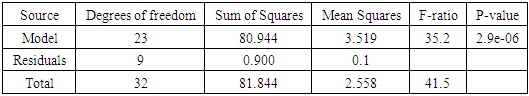
 level relative to noise. This P-value implied that there was a 16% chance that an F-value of 1.82 could occur due to noise. In addition, the lack of fit p-value of 0.0004 was significant. This p-value implied that only a 0.04% chance that a lack of fit F-value this large could occur due to noise. These results gave significant evidence to show that the model (10) was not fit for the mixture-process experimental data. To further measure the model adequacy, the adequate precision value for the model (10) was obtained as 5.869 which is greater than 4 and which indicated an adequate signal.
  value was obtained for this model. This implied that 83.12% of the change in BGL was accounted for by the model, this was relatively a good value to validate the relationship between the response and the explanatory variables.
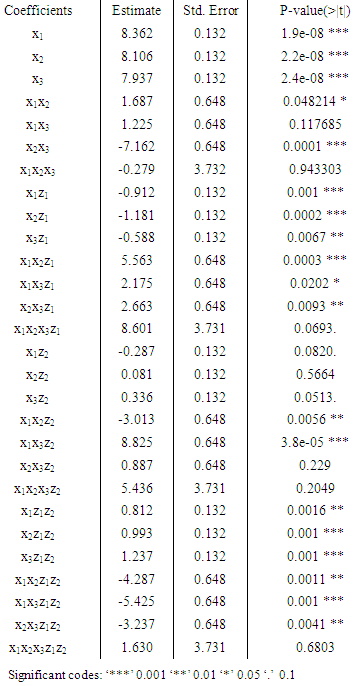
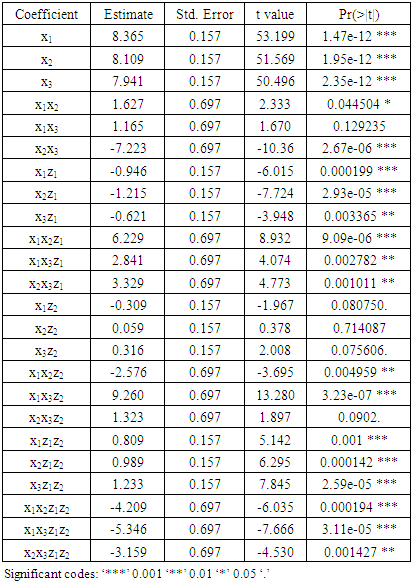
  value was calculated as 0.3753. This value was a bit low and required improvement through model reduction.The conclusion that was drawn from the various tests carried out on the 28-term model was that the model was not fit for the data. As observed on the test of significance of the parameter estimates for the 28-term model, a number of model terms were not statistically significant and this could have been the cause of the model lack of fitness to the experimental data. There was therefore need to reduce this model to a point where it fits the data appropriately.To navigate the reduction of the model (10), the first step involved the elimination of the four cubic terms since they were not statistically significant at α = 0.05 level. This left behind a 24 term model composed of a cross of quadratic mixture model with the linear with interaction model (2FI) of the process variables. R statistical environment was used to estimate the 24 model terms, obtain their t-statistics and p-values as shown in table (5).
|
|
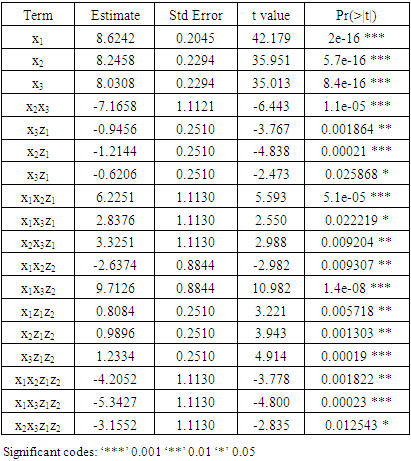
 value for this model was 0.989, implying that 98.9% of the change in BGL was accounted for by the model. This was relatively a very good value to validate the relationship between the response and the explanatory variables. The
  value of 0.961, was obtained, which was a big improvement from the
  of the 28-term model.The 24-term model was significant at α = 0.001 level. However, the results of table (5) showed that 18 of the model parameters were statistically significant but the remaining 6 were not statistically significant at α = 0.05 level. Therefore, further reduction of the model was necessary. The remaining model had 18 model terms.
|
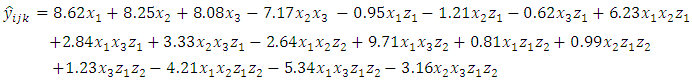 | (11) |
 value of 0.996 was obtained. This value of
  implies that over 99% of the changes in the BGL were explained by the herbal treatments as prepared under the stated processing conditions.
|
 seems to be the single most effective herbal drug in controlling blood glucose level. It is then followed by neem
  and finally, Gymnema
  . The three however seem to have an antagonistic blending effect with high temperature
  The blending effect of the pure blends with the time of extraction was not significant as shown in table (3) and hence dropped from model (11). Further, the three pure blends have a synergistic blending effect with the two processing conditions, temperature and time combined, though this effect cannot match that shown at the low levels of these processing conditions. As has been the observation all along the analysis, the mixture blend of cinnamon and Gymnema at equal proportion under high level of time produced the highest change in blood glucose level. To obtain the optimal predicted response and the corresponding predictor values using the 18-term model, a graphical optimization approach was carried out using Design-Expert® version 10 and produced an overlay plot below.
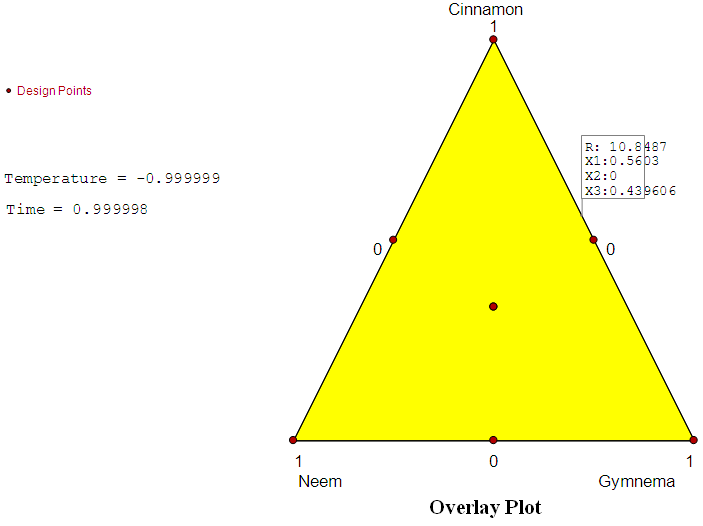 | Figure 1. Graphical representation of the optimization results |
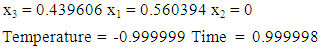 | (12) |
 The
The  factorial processing factors were transformed from coded to original values using the formula
 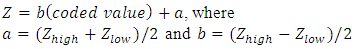 For temperature:
  and
and  Thus
Thus  which corresponds to code 0.
 Therefore,
  This is approximately 25°C.For time:
  and
and 
 Thus
Thus  This is approximately 15 minutes.The optimal predicted change in blood glucose level from model (11) according to the overlay plot (figure 1) was 10.8487mmol/l from the predictor values in (12).
4. Summary, Conclusions and Recommendations
4.1. Summary
- The I-optimal split-plot design was employed in the mixture-process experiment on herbal medicine for diabetes mellitus control. The mixture-process experiment results indicated that the seven mixture blends generated varying effects on the blood glucose level under the different extraction conditions. The single herbs produced their highest change in blood glucose levels under the low levels of temperature and time than under any other extraction conditions. Increased temperature or time did not improve their effect it rather lowered it. Under low level of temperature and time of extraction, both the binary and tertiary mixture blends generally had low values of change in blood glucose level which improved with increased time and temperature of extraction. The highest average change in blood glucose level was produced by the mixture blend of cinnamon and Gymnema at high level of time but low level of temperature. This value however, went down when temperature was also increased. It was also observed that change in blood glucose level for replicates at the same design point was varying. The analysed results obtained using R statistical software agreed with those calculated using [8], [9] methods. The original model, special cubic mixture model crossed with linear with interaction (2FI) process model was not significant. It was found not to be a good fit to the experimental data. Nevertheless, it had an adequate signal to allow its use to navigate the design space. A number of the model terms had zero blending effect and were progressively dropped out from the original model. First, the tertiary mixture blend with its interaction terms with temperature, time of extraction and combined temperature and time were dropped from the original 28-term model since they were not significant at α = 0.05 level. A 24-term model resulted which was statistically significant though some six more terms in it had zero blending effect. The final reduced, model had 18 terms, each of which had nonzero blending effect at α = 0.05 and was therefore retained in the model. In all the three models, the assumption of normality was satisfied but the fitting was best in the 18-term model. The
 value in each model was high enough to validate the relationship between the response and the explanatory variables. The
  value increased progressively from the original model to the 18-term model as terms that were not statistically significant were dropped. The contour plots for the special cubic models gave patterns of prediction that well agreed with the numerical analysis. The biggest change in blood glucose level found to be from binary blends of cinnamon and Gymnema. Through graphical optimization, the optimal predicted response using the fitting 18-term model was found to be 10.848mmol/l. The predictor variables in their original units were obtained as 491.5mg of cinnamon, 385.5mg of Gymnema, a temperature of 25°C and time of 15 minutes.
4.2. Conclusions and Recommendations
- From the results obtained from the research study, the following conclusions and recommendations were made: Herbal medicine can be used to control diabetes mellitus since they are as effective as conventional medicine is, as the study has revealed. However, if at all different herbs are to be mixed to form a herbal formula for use in the treatment then the researcher recommends tests to be carried out to establish; which components could synergistically blend together, the optimal proportions of the established blends and the optimal extraction conditions. The Kenya Health Bill 2015 part VIII relates to the traditional and complementary medicine. Section 43 proposes the setting up of minimum standards of practice for African traditional and alternative medicine while section 45 recommends the establishment of a regulatory body to regulate the practise and also develop policies of standardization of these medicines. To this end, the researcher recommends that the minimum standards, practise and policies should be based on proved research on both the herbal components and the appropriate extraction conditions.Cinnamon was the single most effective herbal drug in controlling the blood glucose level of the diabetic rats among the six herbs tested. Thus, the researcher recommends its use as a single herb for control of diabetes mellitus if the same results are confirmed in human tests. The most effective mixture blend, among the once studied, in controlling BGL in diabetic rats was that of cinnamon mixed with Gymnema at 491.5mg and 385.5mg respectively and the extraction conditions be 25°C and 15 minutes. The researcher recommends this mixture blend to be tested further using human beings to establish whether it would be as effective with humans as it was with the albino wistar rats.
ACKNOWLEDGEMENTS
- I highly appreciate the technical and material support I received from the department of Zoology of Kenyatta University. I acknowledge the general support rendered to me by the department of Physical Sciences, Chuka University.