| [1] | Ali, M.M.; Mikhail, N.N.; Haq, M.S. (1978). A class of bivariate distributions including the bivariate logistic. J. Multivar. Anal, 8, 405–412. |
| [2] | Alizadeh, M., Jamal, F., Yousof, H. M., Khanahmadi, M. and Hamedani, G. G. (2020a). Flexible Weibull generated family of distributions: characterizations, mathematical properties and applications. University Politehnica of Bucharest Scientific Bulletin-Series A-Applied Mathematics and Physics, 82(1), 145-150. |
| [3] | Alizadeh, M., Yousof, H. M., Jahanshahi, S. M. A., Najibi, S. M. and Hamedani, G. G. (2020b). The transmuted odd log-logistic-G family of distributions. Journal of Statistics and Management Systems, 23(4), 1-27. |
| [4] | Altun, E., Yousof, H. M. and Hamedani, G. G. (2018). A new log-location regression model with influence diagnostics and residual analysis. Facta Universitatis, Series: Mathematics and Informatics, 33(3), 417-449. |
| [5] | Altun, E., Yousof, H. M. and Hamedani, G. G. (2021). The Gudermannian generated family of distributions with characterizations, regression models and applications, Studia Scientiarum Mathematicarum Hungarica, forthcoming. |
| [6] | Aryal, G. R. and Yousof, H. M. (2017). The exponentiated generalized-G Poisson family of distributions. Economic Quality Control, 32(1), 1-17. |
| [7] | Balakrishnan, N.; Lai, C.D. (2009). Continuous Bivariate Distributions; Springer Science & Business Media: Berlin/Heidelberg, Germany. |
| [8] | Brito, E., Cordeiro, G. M., Yousof, H. M., Alizadeh, M. and Silva, G. O. (2017). Topp-Leone Odd Log-Logistic Family of Distributions, Journal of Statistical Computation and Simulation, 87(15), 3040–3058. |
| [9] | Chesneau, C. and Yousof, H. M. (2021). On a special generalized mixture class of probabilistic models. Journal of Nonlinear Modeling and Analysis, 3(1), 71-92. |
| [10] | Cordeiro, G. M., Ortega, E. M. and Popovic, B. V. (2015). The gamma-Lomax distribution. Journal of Statistical computation and Simulation, 85(2), 305-319. |
| [11] | Cordeiro, G. M., Yousof, H. M., Ramires, T. G. and Ortega, E. M. M. (2018). The Burr XII system of densities: properties, regression model and applications. Journal of Statistical Computation and Simulation, 88(3), 432-456. |
| [12] | El-Morshedy, M., Alshammari, F. S., Hamed, Y. S., Eliwa, M. S., Yousof, H. M. (2021). A New Family of Continuous Probability Distributions. Entropy, 23, 194. https://doi.org/10.3390/e23020194. |
| [13] | Eugene, N., Lee, C. and Famoye, F. (2002). Beta-normal distribution and its applications. Commun. Stat. Theory Methods, 31, 497-512. |
| [14] | Falgore, J. Y. (2020). The Zubair-inverse lomax distribution with applications. Asian Journal of Probability and Statistics, 1-14. |
| [15] | Farlie, D.J.G. (1960). The performance of some correlation coefficients for a general bivariate distribution. Biometrika, 47, 307–323. |
| [16] | Gumbel, E.J. (1960). Bivariate exponential distributions. J. Am. Stat. Assoc., 55, 698–707. |
| [17] | Gumbel, E.J. (1961). Bivariate logistic distributions. J. Am. Stat. Assoc., 56, 335–349. |
| [18] | Gupta, R. C., Gupta, P. L. and Gupta, R. D. (1998). Modeling failure time data by Lehman alternatives. Communications in Statistics-Theory and methods, 27(4), 887-904. |
| [19] | Hamedani, G. G. Rasekhi, M., Najib, S. M., Yousof, H. M. and Alizadeh, M., (2019). Type II general exponential class of distributions. Pak. J. Stat. Oper. Res., XV (2), 503-523. |
| [20] | Hamedani, G. G. Yousof, H. M., Rasekhi, M., Alizadeh, M., Najibi, S. M. (2017). Type I general exponential class of distributions. Pak. J. Stat. Oper. Res., XIV (1), 39-55. |
| [21] | Hamedani, G. G., Altun, E, Korkmaz, M. C., Yousof, H. M. and Butt, N. S. (2018). A new extended G family of continuous distributions with mathematical properties, characterizations and regression modeling. Pak. J. Stat. Oper. Res., 14(3), 737-758. |
| [22] | Johnson, N.L.; Kotz, S. (1975). On some generalized Farlie-Gumbel-Morgenstern distributions. Commun. Stat. Theory, 4, 415–427. |
| [23] | Johnson, N.L.; Kotz, S. (1977). On some generalized Farlie-Gumbel-Morgenstern distributions-II: Regression, correlation and further generalizations. Commun. Stat. Theory, 6, 485–496. |
| [24] | Karamikabir, H., Afshari, M., Yousof, H. M., Alizadeh, M. and Hamedani, G. (2020). The Weibull Topp-Leone Generated Family of Distributions: Statistical Properties and Applications. Journal of The Iranian Statistical Society, 19(1), 121-161. |
| [25] | Korkmaz, M. C. Yousof, H. M. and Hamedani G. G. (2018a). The exponential Lindley odd log-logistic G family: properties, characterizations and applications. Journal of Statistical Theory and Applications, 17(3), 554 - 571. |
| [26] | Korkmaz, M. Ç., Altun, E., Yousof, H. M. and Hamedani, G. G. (2020). The Hjorth's IDB Generator of Distributions: Properties, Characterizations, Regression Modeling and Applications. Journal of Statistical Theory and Applications, 19(1), 59-74. |
| [27] | Korkmaz, M. C., Yousof, H. M., Hamedani G. G. and Ali, M. M. (2018b). The Marshall–Olkin generalized G Poisson family of distributions, Pakistan Journal of Statistics, 34(3), 251-267. |
| [28] | Lemonte, A. J. and Cordeiro, G. M. (2013). An extended Lomax distribution. Statistics, 47(4), 800-816. |
| [29] | Lomax, K.S. (1954). Business failures: Another example of the analysis of failure data, Journal of the American Statistical Association, 49, 847-852. |
| [30] | Mansour, M., Yousof, H. M., Shehata, W. A. M. and Ibrahim, M. (2020). A new two parameter Burr XII distribution: properties, copula, different estimation methods and modeling acute bone cancer data, Journal of Nonlinear Science and Applications, 13, 223–238. |
| [31] | Marshall, A. W. and Olkin, I. (1997). A new method for adding a parameter to a family of distributions with application to the Exponential and Weibull families. Biometrika, 84, 641-652. |
| [32] | Marzouk, W., Jamal, F. and Ahmed, A. E. (2019). The Generalized Odd Lomax Generated Family of Distributions with Applications. Gazi University Journal of Science, 32(2), 737-755. |
| [33] | Merovci, F., Alizadeh, M., Yousof, H. M. and Hamedani G. G. (2017). The exponentiated transmuted-G family of distributions: theory and applications, Communications in Statistics-Theory and Methods, 46(21), 10800-10822. |
| [34] | Merovci, F., Yousof, H. M. and Hamedani, G. G. (2020). The Poisson Topp Leone Generator of Distributions for Lifetime Data: Theory, Characterizations and Applications. Pakistan Journal of Statistics and Operation Research, 16(2), 343-355. |
| [35] | Mead, M. E. (2016). On five-parameter Lomax distribution: properties and applications. Pakistan Journal of Statistics and Operation Research, 185-199. |
| [36] | Morgenstern, D. (1956). Einfache beispiele zweidimensionaler verteilungen. Mitteilingsbl. Math. Stat., 8, 234–235. |
| [37] | Murthy, D.N.P.; Xie, M.; Jiang, R. (2004). Weibull Models; John Wiley & Sons: Hoboken, NJ, USA. |
| [38] | Nascimento, A. D. C., Silva, K. F., Cordeiro, G. M., Alizadeh, M. and Yousof, H. M. (2019). The odd Nadarajah-Haghighi family of distributions: properties and applications. Studia Scientiarum Mathematicarum Hungarica, 56(2), 1-26. |
| [39] | Nelsen, R.B. (2007). An Introduction to Copulas; Springer Science & Business Media: Berlin/Heidelberg, Germany. |
| [40] | Nofal, Z. M., Afify, A. Z., Yousof, H. M. and Cordeiro, G. M. (2017). The generalized transmuted-G family of distributions. Communications in Statistics-Theory and Method, 46, 4119-4136. |
| [41] | Oguntunde, P. E., Khaleel, M. A., Ahmed, M. T., Adejumo, A. O. and Odetunmibi, O. A. (2017). A new generalization of the Lomax distribution with increasing, decreasing, and constant failure rate. Modelling and Simulation in Engineering, 2017. |
| [42] | Pougaza, D.B.; Djafari, M.A. (2010). Maximum entropies copulas. In Proceedings of the 30th international workshop on Bayesian inference and maximum Entropy methods in Science and Engineering, Chamonix, France, 4–9 July 2010; pp. 329–336. |
| [43] | Rezaei, S., B. B. Sadr, M. Alizadeh, and S. Nadarajah. (2017). Topp-Leone generated family of distributions: Properties and applications. Communications in Statistics: Theory and Methods 46 (6), 2893–2909. |
| [44] | Yousof, H. M., Afify, A. Z., Alizadeh, M., Butt, N. S., Hamedani, G. G. and Ali, M. M. (2015). The transmuted exponentiated generalized-G family of distributions, Pak. J. Stat. Oper. Res., 11, 441-464. |
| [45] | Yousof, H. M., Afify, A. Z., Hamedani, G. G. and Aryal, G. (2017a). The Burr X generator of distributions for lifetime data. Journal of Statistical Theory and Applications, 16, 288–305. |
| [46] | Yousof, H. M., Alizadeh, M., Jahanshahi, S. M. A., Ramires, T. G., Ghosh, I. and Hamedani, G. G. (2017b). The transmuted Topp-Leone G family of distributions: theory, characterizations and applications. Journal of Data Science, 15(4), 723-740. |
| [47] | Yousof, H. M., Altun, E., Ramires, T. G., Alizadeh, M. and Rasekhi, M. (2018). A new family of distributions with properties, regression models and applications, Journal of Statistics and Management Systems, 21(1), 163-188. |
| [48] | Yousof, H. M., Mansoor, M. Alizadeh, M., Afify, A. Z., Ghosh, I. and Afify, A. Z. (2020). The Weibull-G Poisson family for analyzing lifetime data. Pak. J. Stat. Oper. Res., 16 (1), 131-148. |

 Abstract
 Reference
 Full-Text PDF
 Full-text HTML


 refers to the parameters vector of the new family and
  refers to the parameters vector of any base-line model. For
  , the TLG-G family reduces to the one-parameter Topp Leone G (TL-G) family. Suppose that
  be an independent and identically random variables (iid RVs) with common CDF follows the TLG-G family and
  be RV with probability mass function
 defining
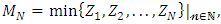 then
then

 and
and  . Then depending on the continuous marginals
  and
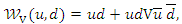
and  the Clayton copula can be expressed as
  where
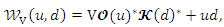
where Let
Let  and
and Then, the BQPTLG-G type distribution can be obtained from
  . A straightforward multivariate extension via Clayton copula can be derived.
  and
and 
 as follows
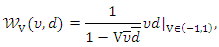
 where the continuous marginal function
  ,
,  and
and  where
where  , which under the grounded minimum condition and
  and
and  under the grounded maximum condition. Clearly, the grounded minimum (maximum) conditions are valid for any copula. Setting
  and
and  . Then, we have
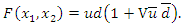 Then, the joint PDF can be expressed as
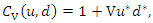 where
where or
or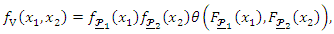 where the two function
  and
and  are PDFs corresponding to the joint CDFs
  and
and 
 with
with  and
and  where
where  and
and  are two continuous functions where
  . Then, let
 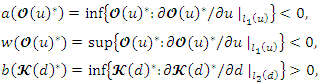 and
and Then, for
  we have
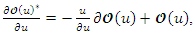 where
where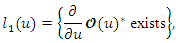 and
and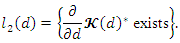 The following four types can be derived and considered:Type I:The new bivariate version via modified FGMC type I can written as
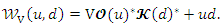 Type II: Consider
  and
and  which satisfy the above conditions where
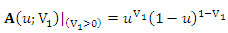 and
and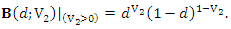 Then, the corresponding bivariate version (modified FGMC Type II) can be derived from
 Type III: Let
 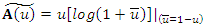 and
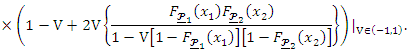
and  . Then, the associated CDF of the BQPTLG-G-FGM (modified FGMC type III) as
 Type IV: Using the quantile concept, the CDF of the BQPTLG-G-FGM (modified FGMC type IV) model can be obtained using
 where
where  and
and  .
. the corresponding joint PDF of the Archimedean Ali-Mikhail-Haq copula can be express as
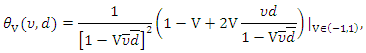 then for any
 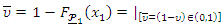 and
and 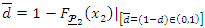 we have
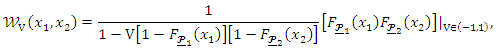 and
and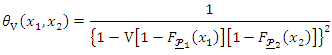
 where
where Then,
Then,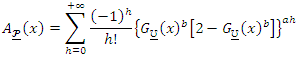 Compiling the expansion of
  in to (5), we have
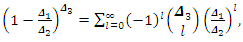
 and
and  real non-integer. Using (7), the QPTLG-G class in (6) can be written as
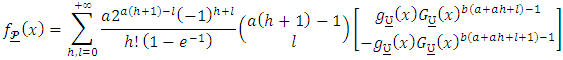 Which can be summarized as
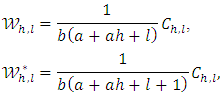 and
and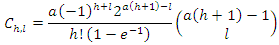 and
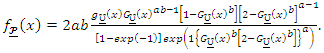
and 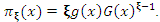 Equation (8) reveals that the density of the QPTLG-G family can then be expressed as a linear representation of exp-G PDFs. Also, the CDF of the QPTLG-G family can also be expressed as a mixture of exp-G CDFs. By integrating (8), we have
 is the CDF of the exp-G family with power parameter
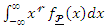
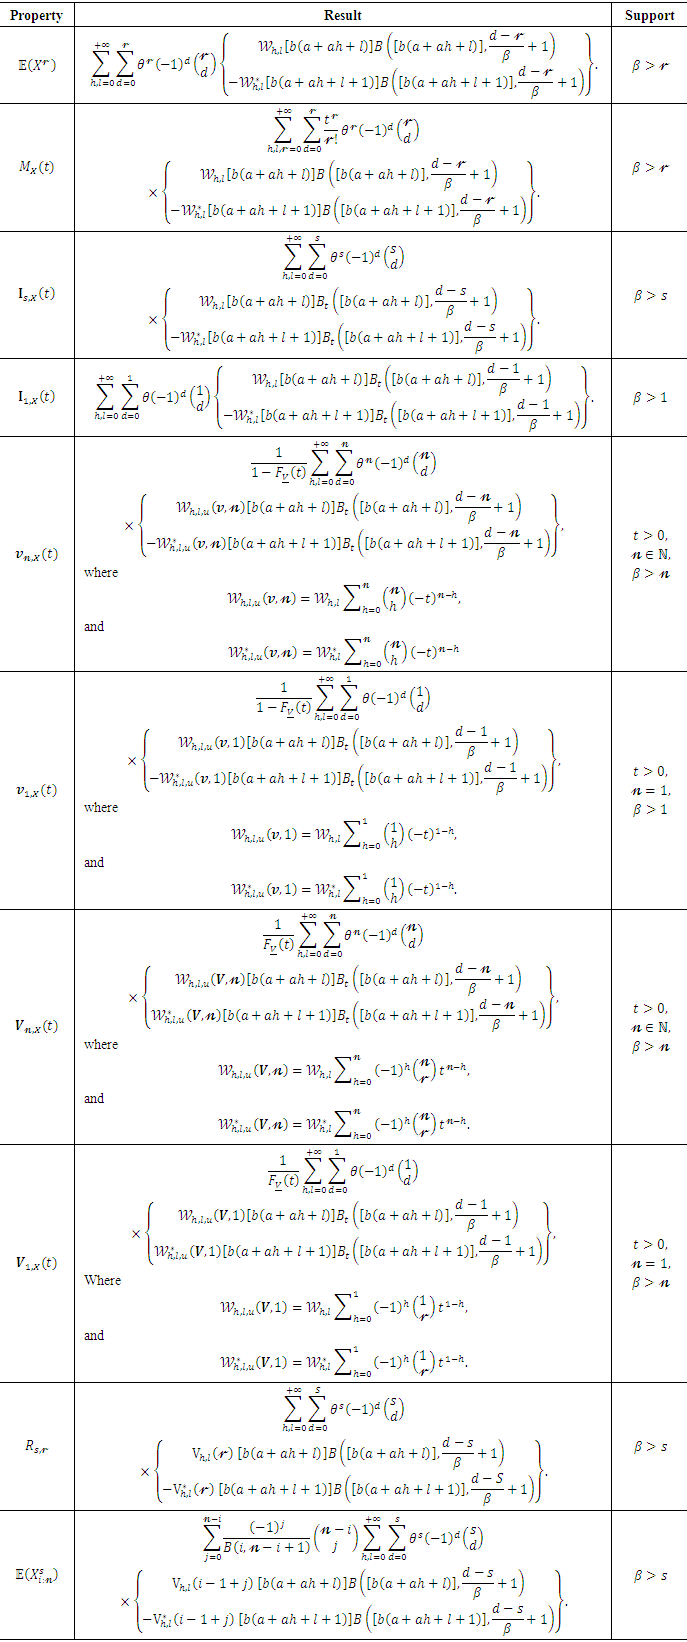
 ordinary moment of
  where
where  follows QPTLG-G family with parameters
  is given by
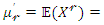
 . Then we obtain
 denotes the density of the exp-G model with power parameter
  The expected value
  can be derived from when
  in (10). The integrations in
  and
and  can be computed numerically for most parent distributions. The
  central moment of
  , variance
  skewness
  kurtosis
  and dispersion index
  measures can be derived using well-known relationships. The
  incomplete moment, say
  of
of  can be expressed from (9) as
  . Then
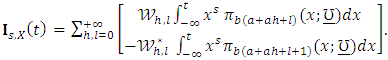
 are given by
 and
and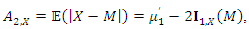 respectively, where
  is the median,
  is obtained from (4) and
  is the first incomplete moment given by (11) with
  as
as  where
where  is the first incomplete moment of the exp-G distribution. The moment generating function
  of
of  can be derived as
 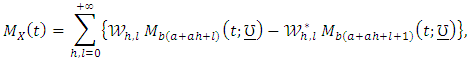 where
where  is the moment generating function of
 moment of the residual life, say
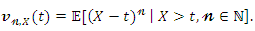 Then, the
  moment of the residual life of
  can be given as
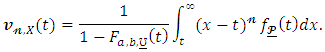 Therefore, using (8) we have
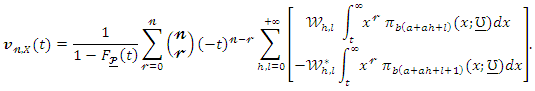 The life expectation can then be defined by
 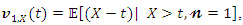 which represents the expected additional life length for a unit which is alive at age
  The MRL of
  can be obtained by setting
  in the last equation.
  moment of the reversed residual life, say
 The
The  moment of the reversed residual life of
  can be given as
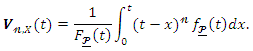 Then, the
  moment of the reversed residual life of
  becomes
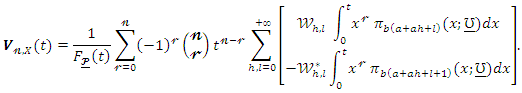 The mean inactivity time (MIT) is given by
 and it refers to the waiting time elapsed since the failure of an item on condition that this failure had occurred in
  .
. PWM of
  following the QPTLG-G family, say
  is formally defined by
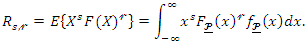 Using equations (4) and (5), we can write
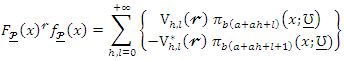 where
where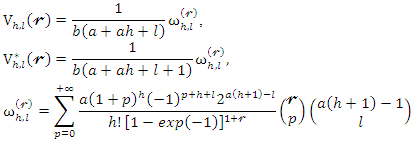 and
and  is defined above. Then, the
  th PWM of
  can be expressed as
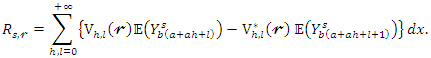
 be a random sample from the QPTLG-G family of distributions and let
 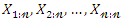 be the corresponding order statistics. The PDF of
  order statistic, say
  can be written as
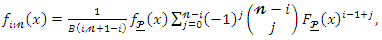
 is the beta function. Substituting (4) and (5) in equation (12) and using a power series expansion, we get
 where
where and
and Then, the PDF of
  can be written as
 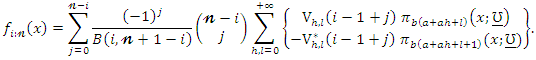 Then, the density function of the QPTLG-G order statistics is a mixture of exp-G PDFs. Based on the last result, we note that the main properties of
  follow from those properties of
  and
and  . For example, the
  moments of
  can be expressed as
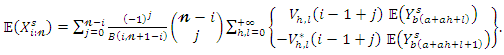
 where
where 
 be a random variable having the exp-L distribution with power parameter
  Then the CDF of the exp-L model can be expressed as
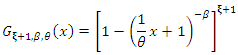 Then, the
  ordinary moment of
  is given by
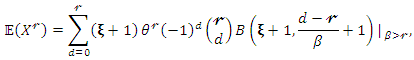 where
where 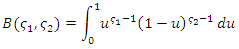 is the complete beta function. Theorem 2:Let
  be a random variable having the exp-L distribution with power parameter
  Then, the
  incomplete moment of
  is given by
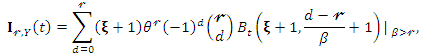 where
where 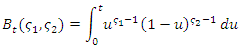 is the incomplete beta function.
 be a random sample from the QPTLG-G distribution with parameters
  . For determining the maximum likelihood estimators (MLEs) of
  we have the log-likelihood function
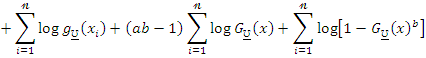
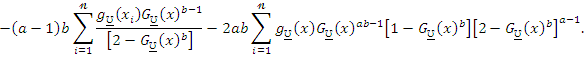
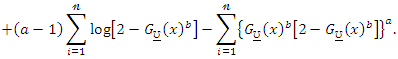 The components of the score vector are

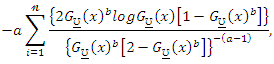 and
and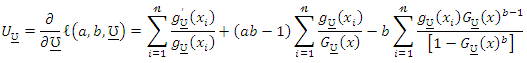
 Setting the nonlinear system of equations
  and
and  and solving them simultaneously yields the MLE. To solve these equations, it is usually more convenient to use nonlinear optimization methods such as the quasi-Newton algorithm to numerically maximize