-
Paper Information
- Paper Submission
-
Journal Information
- About This Journal
- Editorial Board
- Current Issue
- Archive
- Author Guidelines
- Contact Us
International Journal of Probability and Statistics
p-ISSN: 2168-4871 e-ISSN: 2168-4863
2020; 9(3): 45-53
doi:10.5923/j.ijps.20200903.01
Received: Feb. 1, 2020; Accepted: Mar. 15, 2020; Published: Sep. 26, 2020

Mode of Transportation Choices in Bangladesh: An Application of Multinomial Logistic Model
 Abstract
 Reference
 Full-Text PDF
 Full-text HTML
Muhammad Alamgir Islam, Md. Shahidul Hoque
Assistant Professor, Department of Statistics, University of Chittagong, Chattogram, Bangladesh
Correspondence to: Muhammad Alamgir Islam, Assistant Professor, Department of Statistics, University of Chittagong, Chattogram, Bangladesh.
| Email: |  |
Copyright © 2020 The Author(s). Published by Scientific & Academic Publishing.
This work is licensed under the Creative Commons Attribution International License (CC BY).
http://creativecommons.org/licenses/by/4.0/

This paper provides an outline of the main features of the transport sector in Bangladesh and the challenges going forward. This study presents the process of derivation and estimation of a multinomial logistic model and its application to the modes of transportation choice problem. The transport sector of Bangladesh consists of a variety of modes. In this study we have considered four modes of transportation such as Plane, Train, Car and Public transport. For derivation of multinomial logistic model for mode of transportation choices, we have considered the factor that is likely to influence choosing transportation modes as a response variable and considered five factors such as, gender, level of education, type of occupation, family economic status and division of the respondents as determinants of the mode of transportation choice. In this study information is collected from a randomly selected sample of 950 persons from each of five major divisions through well-defined questionnaire. However, after scrutiny, 602 respondents with consistent and valid information have been finally used for analysis. The parameters of our postulated multinomial logistic models have been estimated by using maximum likelihood method, likelihood ratio test and Wald test have been employed for testing the formulated hypothesis. From this study it has been found that the likelihood of male respondents would choose plane as mood of transportation 0.029 times more than female respondents.
Keywords: Mode of transportations, Multinomial logistic model, Maximum likelihood procedure, Wald test, LR Test
Cite this paper: Muhammad Alamgir Islam, Md. Shahidul Hoque, Mode of Transportation Choices in Bangladesh: An Application of Multinomial Logistic Model, International Journal of Probability and Statistics , Vol. 9 No. 3, 2020, pp. 45-53. doi: 10.5923/j.ijps.20200903.01.
Article Outline
1. Introduction
- Transport in Bangladesh is an important part of the nation's economy. Since the liberation of the country, the development of infrastructure within the country has progressed at a rapid pace, and today there is a wide variety of modes of transport by road, railway, air and water are widely used in carrying both passengers and cargo. ”Transportation can have significant effects on mobility, economic development, environmental quality, government finance and the quality of life. Wise planning is needed to help create high quality transportation facilities and services at a reasonable cost with minimal environmental impact and to enhance economic activity” [1].
1.1. Bangladesh Transport Sector Review
1.1.1. Road Transport
- Road transport in Bangladesh is a private sector affair operating predominantly in domestic routes. Rates are among the cheapest in the world. Express and nonstop services are available to principal towns from Gabtoli, Saidabad and Mohakhali bus terminals in Dhaka. The Bangladesh Road Transport Corporation (BRTC) also maintains a countrywide network of bus services. Recently they have introduced Dhaka - Calcutta - Dhaka direct daily bus services via Benapole, Jessore.
1.1.2. Rail Transport
- Railway acts as an important method of mass transport in Bangladesh. Many districts of the country are connected via railways. Bangladesh Railway was mostly inherited from the British-established Assam Bengal Railway system after the partition of India in 1947. Bangladesh Railway's headquarters are located in the southern port city of Chattogram. About 32% of the total area of Bangladesh is effectively covered by the railways. As of 2005, the total length of railway is 2,706 kilometers (1,681 mi). [5] Of that, 923 km (574 mi) are broad gauge (1,676 mm) tracks (mostly in the western region), and the remaining 1,822 km (1,132 mi) are meter gauge tracks (mostly in the central and eastern regions). The Bangladesh Railway provides an efficient service to places of interest such as Chattogram, Sylhet, Khulna, Mymensingh, Bogura, Rajshahi, Dinajpur starting from Dhaka. The inter-city Express Service is available to and from important cities at cheap fares.
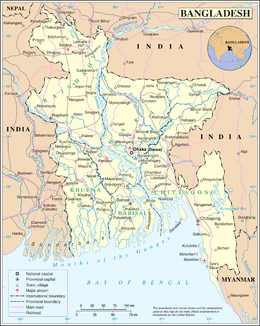 | Figure 1. Bangladesh transport sector |
1.1.3. Air Transport
- Air transport is mainly characterized by safety, high speed and high level of customerservice, but its availability is limited. Air transport is also considerably expensive. For these reasons, air transport is particularly suitable for transport of objects of high values for long distances. Biman Bangladesh Airlines is the national airlines of Bangladesh which commenced operation in 1972. There are currently three international airports in Bangladesh: Shahjalal International Airport in Dhaka, Shah Amanat International Airport in Chattogram and Osmani International Airport in Sylhet. All three international airports have direct connections to a number of destinations in the Middle East while Hazrat Shahjalal International Airport has services to the wider Asian region and Europe. In addition to the international airports there are also five domestic airports in Barisal, Cox's Bazar, Jessore, Rajshahi and Saidpur with almost all services from these airports either bound for or originating from Dhaka.
1.2. Literature Review
- Discrete choice models can be used to analyze and predict a decision maker’s choice of one alternative from a finite set of mutually exclusive and collectively exhaustive alternatives. Such models have numerous applications since many behavioral responses are discrete or qualitative in nature; that is, they correspond to choices of one or another of a set of alternatives [1,2].Extended studies have been conducted previously on the mode of transportations choice. Socio-economic and demographic variables were found to be most significant in many of them. Wei Loon Chee et al. (2013) [2] intends to study the factors that are related to the choice of mode of transport, particularly in Penang, the second most densely populated state in Malaysia. Their aims was to provide a better understanding of the determinants of mode choice behavior of road users in Penang and allow for policy makers to formulate a more effective public transport policy in the future.Alvinsyahetal (2005) [6] study concluded males have a stronger preference to drive and are less likely to shift to public transport. Morikawa et al. (2003) [7] also found that male travelers prefer using cars or motorcycles more than women in the case of Japanese cities, except for Nagoya. Nurdden, Rahmat and Ismail (2007) [8] also revealed women are more likely to use public transport in Malaysia. Jian Chen et al. (2017) [3] mode choice model for public transport, which integrates structural equation model (SEM) and discrete choice model (DCM) with categorized latent variables, was presented in this paper. Apart from identifying those important latent variables that affect mode choice for public transport, the objective of this study was also to develop an improved disaggregative model that better explains travel behavior of those decision-makers in choosing public transport.Rahim et al. (2013) [4] have found that battery driven auto-rickshaw has increased the income, social status, comfort and has decreased the unemployment problems. This study calculated the amount of energy consumed by the battery driven auto-rickshaw and it was near about 10 kilo-watt per charging.Tejaswi G. et al. (2015) [9] have explained on factors influencing mode choice behavior in metropolitan city, Hyderabad. Multinomial logistic regression model was used for evaluation of influencing factors in mode choice behavior.From the literature it can be said that very few empirical studies have done on mode of transportation choice. The present study is designed for derivation and estimation of a multinomial logistic model and its application to the modes of transportation choice problem.
1.3. Objectives of the Study
- The core objectives of this study are as follows:(1) To derive a mathematical model using multinomial logistic regression for the mode of transportation choices,(2) To identify the various factors that influences a respondent to choose his/her mode of transportation and(3) To find the likelihood of choosing different types of mode of transportation under different types of socio-economic and demographic backgrounds.
2. Data and Methodology
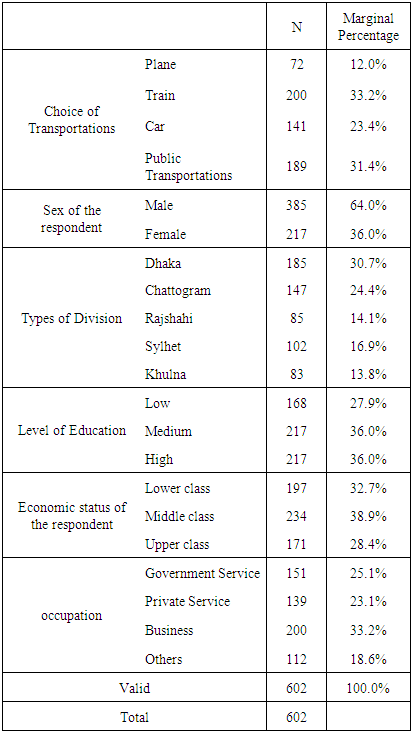
- Primary data is used in this study. There are five major division is covered by the survey. The divisions are Dhaka, Chattogram, Rajshahi, Sylhet and Khulna. Here, sampling units are the individuals of the five divisions. We have randomly selected 950 persons as a sample from five different divisionsbased on the convenience sampling method through a well-designed questionnaire. However, after scrutiny, only 602 valid questionnaires have been selected as the final sample of the study. The final data comprise with the 30.7% from Dhaka, 24.4% from Chattogram, 14.1% from Rajshahi, 16.9% from Sylhet and 13.8% from Khulna division. The parameters of our postulated multinomial logistic models have been estimated by using maximum likelihood method and likelihood ratio test and Wald test have been employed for testing the formulated hypothesis.
3. Derivation of Multinomial Logistic Model (MNL)
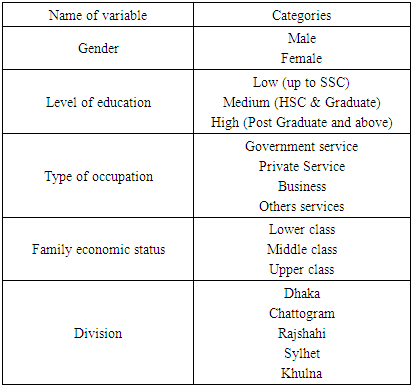
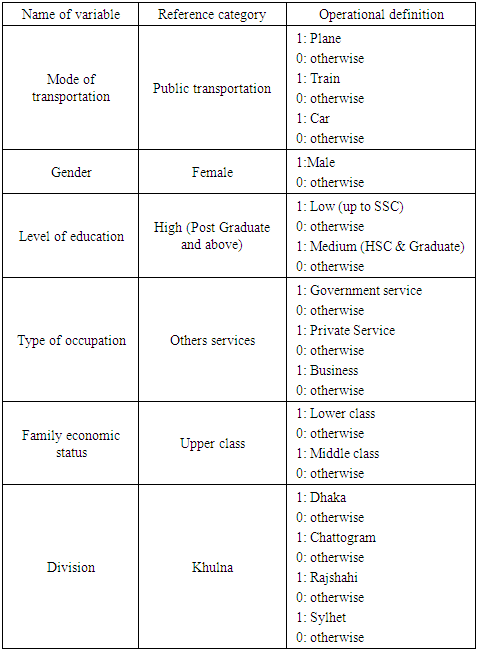
- Multinomial logisticmodel [11] used to model a relationship between polytomous response variables and a set of regressor variables. The term multinomial includes a broadsense and variety of models [10]. The Multinomial logistic is a known methodto evaluate the effect of explanatory variables on a category of dependent variables. Thus for derivation of multinomial logistic model for mode of transportation choices, we have considered the factor that is likely to influence choosing transportation modes as a response variable and considered five factors such as, gender, level of education, type of occupation, family economic status and division of the respondents as determinants of the mode of transportation choice as regressor variables. By considering these variables multinomial logistic regression is developed using SPSS software. The variables are then categorized as below.
3.1. Study Variables
- In this we have considered modes of transportation as a response variable.
3.1.1. Categories of Response Variables
- Following four categories of transportation mode are considered:1) Plane2) Train3) Car and4) Public transportation
3.1.2. Regressor Variables
- There are several factors that might influence the choices, which are known as regressor variables. Here we have considered only five such factors.1) Gender2) Level of education3) Type of occupation4) Family economic status and5) Division
3.1.3. Categories of Regressor Variables
3.2. Postulated Model
- The postulated multinomial logistic model of mode of transportation choices are given below:Equation-I
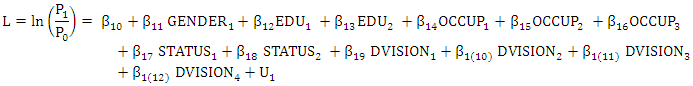 Equation-II
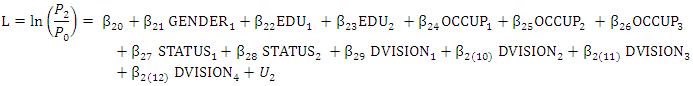 And Equation-III
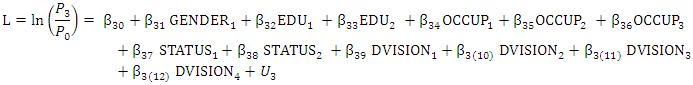
|
4. Estimation and Test of Postulated Model
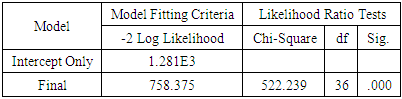
- Here the estimation of the parameters of the multinomial logistic model has been carried out by using maximum likelihood procedure, likelihood ratio test and Wald test have been employed for testing the formulated hypothesis. By using SPSS program we get the following model fitting information.
4.1. Likelihood Ratio Test
- Hypothesis:H0: There is no significant difference among the effects of selected variables.
|
|
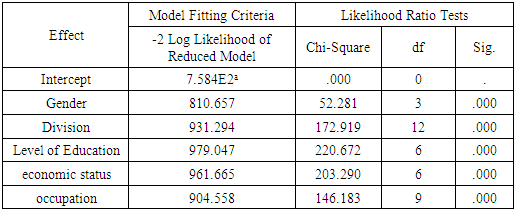
4.2. Comments
- On the basis of likelihood ratio test, it has been observed that all the parameters are statistically highly significant. However, Wald test indicates that there are some parameters are significant, namely: GENDER1, DIVISION1, EDU1, EDU2, STATUS2 and OCCUP1, OCCUP2, OCCUP3 in the first equation (Plane vs. Public Transportation); GENDER1, DIVISION1, DIVISION3, DIVISION4, EDU1, STATUS1 and OCCUP1, OCCUP2, OCCUP3 in the second equation (Train vs. Public Transportation) and GENDER1, DIVISION1, DIVISION3, EDU1, EDU2 and OCCUP2, OCCUP3 in the third equation (Car vs. Public Transportation). Considered at 5% level of significance.
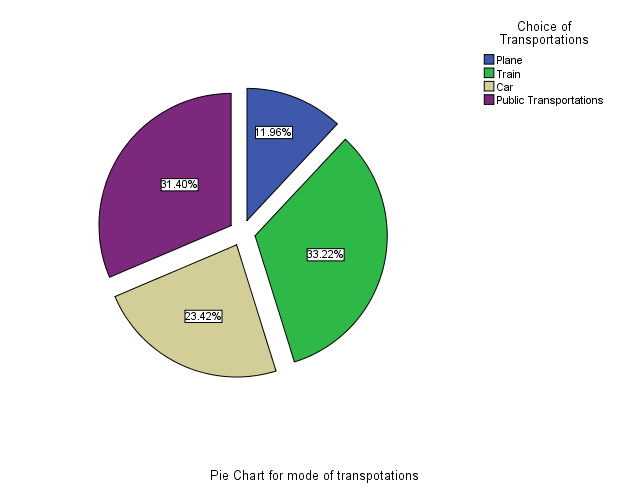 | Figure 2. Pie Chart for mode of transportations choices |
|
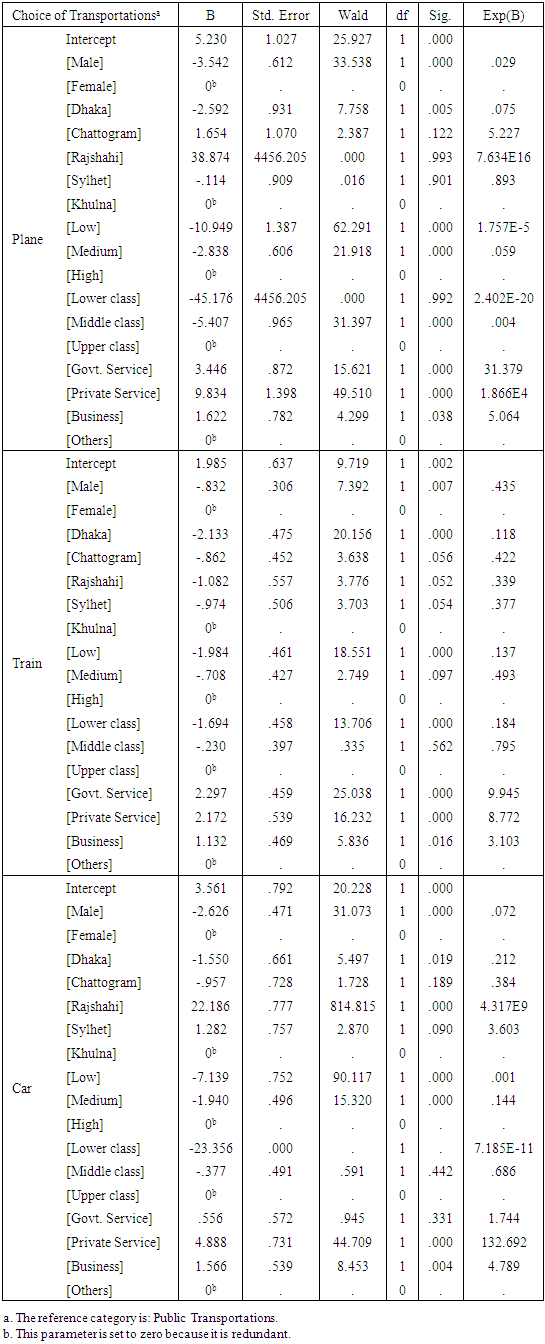
4.3. Estimated Model
- Equation-I
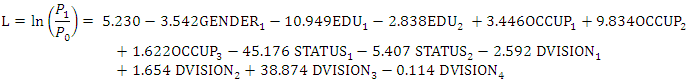 Equation -II
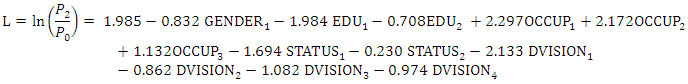 And Equation -III
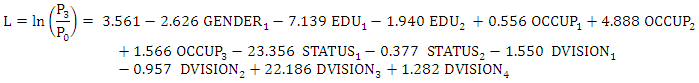
5. Interpretation on Estimated Model
- The fitted model can be interpreted as follows:
5.1. Interpretation of the Intercepts
- For those respondents who are female, level of education is high, do others service, have upper family status and come from Khulna division all the selected regressors will have no effect.
|
5.2. Interpretation of the Slope Coefficients
- Interpretation on the slope coefficients of our estimated model based on table-4, can be made in terms of odds ratio as follows:For Equation-IFor the coefficient of GENDER1, we have Exp (B) = 0.029, this recommend that respondents who are male, would choose plane as mood of transportation likely 0.029 times more than respondents who are female.For the coefficient of EDU2, we have Exp(B) = 0.059, this propose that respondents whose level of education is medium, would choose plane as mood of transportation likely 0.059 times more than respondents whose level of education is high.For the coefficient of OCCUP1, we have Exp(B) = 31.379, this suggest that respondents who have government service would choose plane as mood of transportation likely 31.379 times more than respondents have other services.For the coefficient of OCCUP2, we have Exp(B) = 1.866E4, this recommend that respondents who have private service would choose plane as mood of transportation likely 1.866E4 times more than respondents have other services.For the coefficient of OCCUP3, we have Exp(B) = 5.064, this suggest that respondents who have business would choose plane as mood of transportation likely 5.064 times more than respondents have other services.For the coefficient of STATUS2, we have Exp(B) = 0.004, this recommend that respondents who come from middle class family, would chooseplane as mood of transportation likely 0.004 times more than respondents who come from upper class family.For the coefficient of DVISION1 we have Exp(B) = 0.075, this propose that respondents who come from Dhaka division, would choose plane as mood of transportation likely 0.075 times more than respondents who come from Khulna division and so on.For Equation-IIFor the coefficient of GENDER1, we have Exp (B) = 0.435, this propose that respondents who are male, would choose train as mood of transportation likely 0.435 times more than respondents who are female.For the coefficient of EDU1, we have Exp(B) = 0.137, this suggest that respondents whose level of education is low, would choose train as mood of transportation likely 0.137 times more than respondents whose level of education is high.For the coefficient of OCCUP1, we have Exp(B) = 9.945, this recommend that respondents who have government service would choose train as mood of transportation likely 9.945 times more than respondents have other services.For the coefficient of OCCUP2, we have Exp(B) = 8.772, this suggest that respondents who have private service would choose train as mood of transportation likely 8.772 times more than respondents have other services.For the coefficient of STATUS1, we have Exp(B) = 0.184, this propose that respondents who come from lower class family, would choose train as mood of transportation likely 0.184 times more than respondents who come from upper class family.For the coefficient of DVISION1, we have Exp(B) = 0.118, this suggest that respondents who come Dhaka division, would choose train as mood of transportation likely 0.118 times more than respondents who come from Khulna division and so on.For Equation-IIIFor the coefficient of GENDER1, we have Exp (B) = 0.072, this recommend that respondents who are male, would choose car as mood of transportation likely 0.072 times more than respondents who are female.For the coefficient of EDU1, we have Exp(B) = 0.001, this propose that respondents whose level of education is low, would choose car as mood of transportation likely 0.001 times more than respondents whose level of education is high.For the coefficient of EDU2, we have Exp(B) = 0.144, this suggest that respondents whose level of education is medium, would choose car as mood of transportation likely 0.144 times more than respondents whose level of education is high.For the coefficient of OCCUP2, we have Exp(B) = 132.692, this recommend that respondents who have private service would choose car as mood of transportation likely 132.692 times more than respondent who have other services.For the coefficient of DVISION3 we have Exp(B) = 4.317E9, this suggest that respondents who come Rajshahi division, would choose train as mood of transportation likely 4.317E9 times more than respondents who come from Khulna division and so on.
6. Conclusions
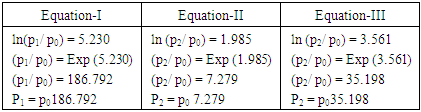
- The summary of sample data shown in Table-3, it may conclude that respondents would choose 12% plane, 33.2% train, 23.45 car and 31,4% public transportation as a mode of transportation in Bangladesh. Therefore most of the respondents prefer train as mode of transportation. On the basis of table-5 and table-6, it has been observed that all the parameters are statistically highly significant. However, Wald test indicates that there are some parameters are significant. From the table-5 it has been found that the respondents who are female, level of education is high, do others service, have upper family status and come from Khulna division have the likelihood of choosing plane as transportation mode is 186.792 times than the public transportation in equation-I, would choose train as transportation mood is 7.729 times higher than the public transportation in equation-II and would choose car as transportation mood is 35.198 times more than the public transportation in equation-III. Therefore we may conclude that this type of respondents would like better plane as a mode of transportation.The outcomes of this study have useful policy implications with regard to promising the use of public transport in Bangladesh.