-
Paper Information
- Paper Submission
-
Journal Information
- About This Journal
- Editorial Board
- Current Issue
- Archive
- Author Guidelines
- Contact Us
International Journal of Probability and Statistics
p-ISSN: 2168-4871 e-ISSN: 2168-4863
2020; 9(2): 33-41
doi:10.5923/j.ijps.20200902.02
Received: June 20, 2020; Accepted: July 27, 2020; Published: August 15, 2020

Managing Risk of Spreading "COVID-19" in Egypt: Modelling Using a Discrete Marshall–Olkin Generalized Exponential Distribution
 Abstract
 Reference
 Full-Text PDF
 Full-text HTML
Ehab M. Almetwally 1, Hisham M. Almongy 2, Hany A. Saleh 3
1Statistics, Delta University of Science and Technology, Egypt
2Applied Statistics, Faculty of Commerce, Mansoura University, Egypt
3Insurance and Actuarial Science, Faculty of Commerce, Mansoura University, Egypt
Correspondence to: Ehab M. Almetwally , Statistics, Delta University of Science and Technology, Egypt.
| Email: |  |
Copyright © 2020 The Author(s). Published by Scientific & Academic Publishing.
This work is licensed under the Creative Commons Attribution International License (CC BY).
http://creativecommons.org/licenses/by/4.0/

This research aims at modeling the risks of COVID-19 spread in Egypt, by specifying an optimal statistical model to analyse the daily count of COVID-19 new cases. A new three-parameter discrete distributions has been developed namely, the Discrete Marshall–Olkin Generalized Exponential (DMOGEx) distribution. Probability mass function, hazard rate and some statistical properties of reliability are discussed. Parameter estimation of the Based on the maximum likelihood estimation (MLE) method is discussed for the DMOGEx distribution. Numerical study was done using daily count of new cases in Egypt, empirical results were interpreted in detail and expectation probabilities for daily new cases were discussed. Monte Carlo Simulation has been performed to evaluate the restricted sample properties of the proposed distribution.
Keywords: COVID-19, Risk Management, Hazard Rate, Discrete Distributions, Survival Discretization, Maximum Likelihood Estimation, Marshall–Olkin Generalized Exponential
Cite this paper: Ehab M. Almetwally , Hisham M. Almongy , Hany A. Saleh , Managing Risk of Spreading "COVID-19" in Egypt: Modelling Using a Discrete Marshall–Olkin Generalized Exponential Distribution, International Journal of Probability and Statistics , Vol. 9 No. 2, 2020, pp. 33-41. doi: 10.5923/j.ijps.20200902.02.
Article Outline
1. Introduction
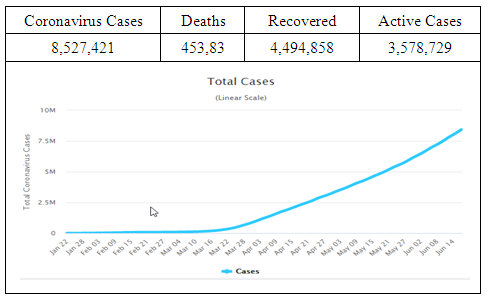
- During December 2019, Corona-Virus "COVID-19" started in Wuhan, China (Hongyan et al. 2020). On March 11, 2020 the world health organization (WHO) described COVID-19 as a pandemic. Therefore, countries around the world have increased their risk and disasters measures trying to decrease the spread rate of the COVID-19. On June 17, 2020 the following were the main indicators globally:
 In terms of Egypt, on June 17, 2020 the following were the main indicators:
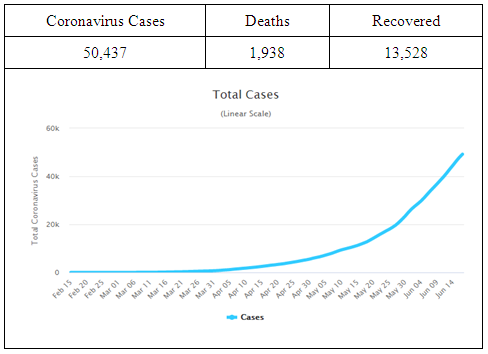 Source: https://www.worldometers.info/coronavirus/COVID-19's risk parameters are as follows (https://covid19.who.int/), (Saleh et al. 2020):- The number of infected people resulting from contact with one case (Virus transmission rate” Ro”). That is, the average number of people to which a single infected person will transmit the virus. The initial estimations of Ro are between 1.5 and 3.5. Ro < 1 means coronavirus will gradually disappear.- Death rate among people with coronavirus (Fatality rate). According to epidemiologists, as a virus can be mutate, Fatality rate can be changed.- The extent to which the infection can be transmitted from an infected person without symptoms of corona virus infection “Incubation Period”. That is, “symptoms of Coronavirus” how long it takes to appear. Estimated ranges for symptoms of COVID-19 to be appear from 2 days up to 14, during which the patient may not display any symptom but the virus is contagious.To model daily deaths in Egypt due to COVID-19 during the period from March 8 to April 30, 2020, a natural discrete Lindley distribution has been introduced by Al-Babtain et al. (2020). Hasab et al. (2020) used the Susceptible Infected Recovered (SIR) epidemic dynamics of COVID-19 pandemic to model the novel Coronavirus epidemic in Egypt. El-Morshedy et al. (2020) studied a new discrete distribution, called discrete generalized Lindley, to analyze the counts of the daily coronavirus cases in Both Hong Kong Iran. Autoregressive time series model based on the two-piece scale mixture normal distribution has been used by Maleki et al. (2020) to forecast the recovered and confirmed COVID-19 cases. Moreover, the daily new COVID-19 cases in China have been predicted by Nesteruk (2020) and Batista (2020b) by using the mathematical model, called susceptible, infected and recovered (SIR). Batista (2020a) used logistic growth regression model is used for the estimation of the final size and its peak time of the coronavirus epidemic.The question may come to mind of any researcher: why do we need discrete distributions? Since In count data analysis, we see the most of the existing continuous distributions do not set suitable results for modeling the COVID-19 cases. The cause for this as we know that counts of deaths or daily new cases show excessive dispersion. Discrete Rayleigh (DR) which is introduced by Roy (2004).In order to insure members of the Egyptian society from the risk arising from the spread of COVID-19 in Egypt, this study aims to model the daily new cases and deaths of the COVID-19 employing a new statistical tool. To achieve this aim: Firstly, we represent a review for discrete models as Poisson, geometric, negative binomial, discrete Weibull (DW) which is introduced by Nakagawa and Osaki (1975), discrete Buur (DB) which is introduced by Krishna and Pundir (2009), discrete Lindley (DL) which is introduced by Gómez-Déniz and Calderín-Ojeda (2011), discrete generalized exponential (DGEx) which is introduced by Nekoukhou et al. (2013) natural discrete Lindley (NDL) which is introduced by Al-Babtain et al. (2020) and discrete Gompertz Exponential (DGzEx) which is introduced by El- Morshedy et al. (2020). Secondly, we introduce a new flexible discrete models can be donated as discrete Marshall-Olkin generalized exponential (DMOGEx) distribution.An aspect of the importance of research is the necessity of mathematical and statistical modeling of the extent and spread of the COVID-19 that measures the progress of medical solutions for drugs and vaccines in reducing the risk of virus spread. The authors suggest in future research that there will be new and different applications in this critical area such as censored sample and competing risk model. For more details of these application see Balakrishnan and Cramer (2014) and more example see Almetwaly and Almongy (2018), Almetwally et al. (2019), Hassany et al. (2020) and Zhao et al. (2020).The rest of the paper is organized as follows. In Section 2, the discrete model description. Some reviews for discrete models are established in Section 3. In Section 4, we introduce a new flexible discrete model with some plots for its probability mass function (PMF) and hazard rate (hr). In Section 5, the method of maximum likelihood is used to estimate the parameter. Section 6 applies a bias reduction method to the derived MLE estimator. Daily new cases of COVID-19 in the case of Egypt is used to validate the use of models in fitting lifetime count data are presented in Section 7. Finally, conclusions are provided in Section 8.
2. Discrete Model Description
- In the statistics literature, sundry method are available to obtain a discrete analog for a continuous distribution. The most commonly used technique to generate discrete distribution is called a survival discretization method. It requires that the random variable under consideration is non‐negative and continuous and both the cumulative distribution function (CDF) and the survival function exists. The PMF of discrete distribution is defined in Roy (2003) as
 | (1) |
 where
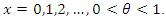
where 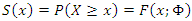 , where
  is a CDF of continuous distribution and
  is a parameter vector. The random variable X is said to have the discrete distribution if its CDF is given by
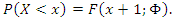 | (2) |
 The reversed failure rate of discrete distribution is given as
3. Review for Discrete Models
- In this section, some discrete distributions which has been developed in the literature are discussed.
3.1. Discrete Burr Distribution
- The PMF of the discrete Burr (DB) distribution which has been defined by Krishna and Pundir (2009) is given as follows

 and the CDF of the discrete Burr distribution is
 The hazard rate (hr) of the discrete Burr distribution is
 Figure 1 presents some possible shapes for the PMF of the DB distribution. Figure 2 show some possible shapes for the hr of the DB distribution.
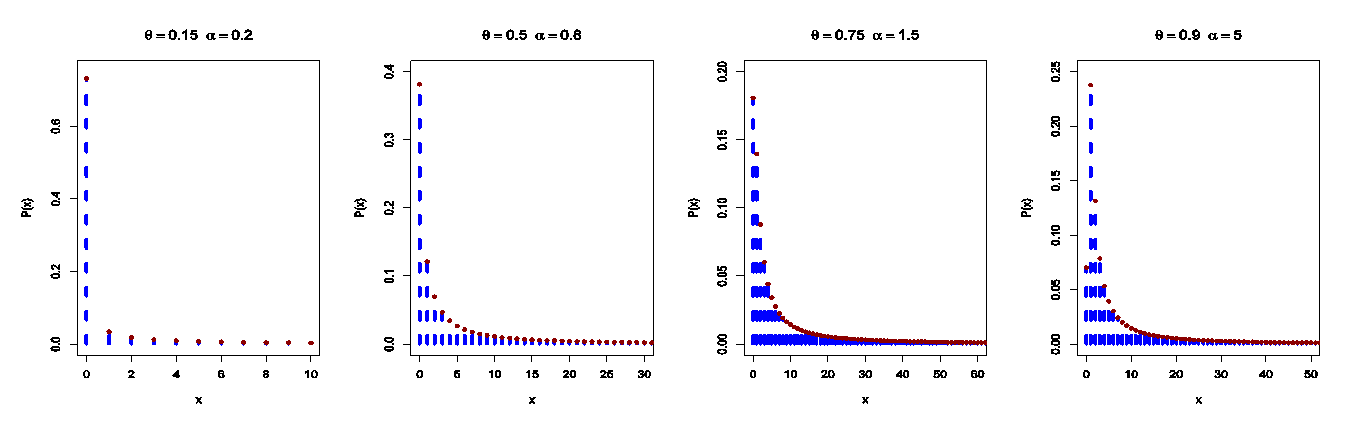 | Figure 1. The PMF plots of the DB distribution |
 | Figure 2. The hr plots of the DB distribution |
3.2. Discrete Lindley Distribution
- The PMF of the discrete Lindley (DL) distribution that has been defined by Gómez-Déniz and Calderín-Ojeda (2011) is given as follows
 The CDF of the discrete Lindley distribution is
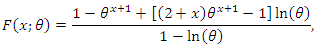 The hazard rate of the discrete Lindley distribution is
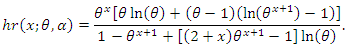 Figure 3 provides some possible shapes for the PMF of the DL distribution, while Figure 4 show some possible shapes for the hr of the DL distribution.
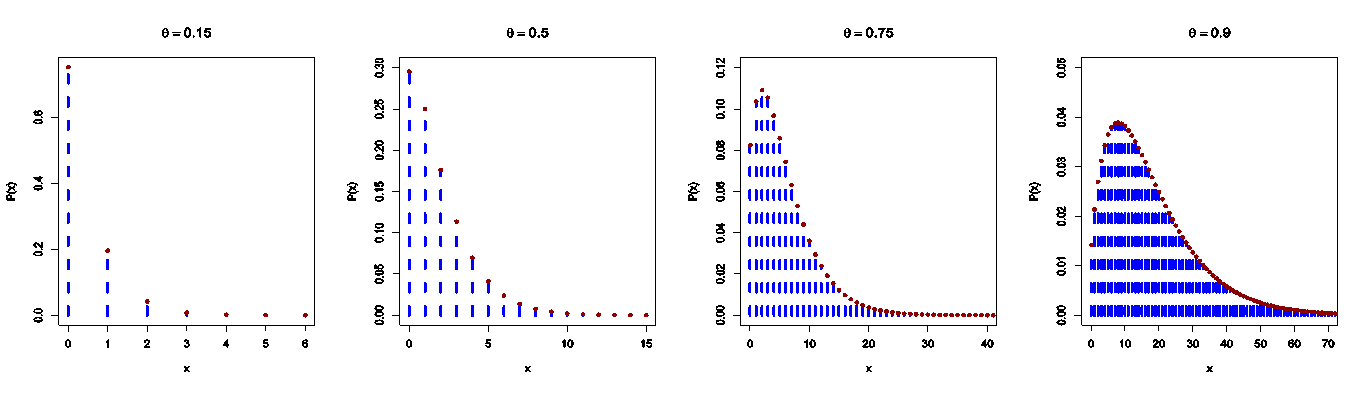 | Figure 3. The PMF plots of the DL distribution |
 | Figure 4. The hr plots of the DL distribution |
3.3. Discrete Generalized Exponential Distribution
- The PMF of the DGEx distribution defined by Nekoukhou et al. (2013) is as follows

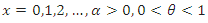 , when
 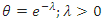 , the CDF of the DGEx distribution is
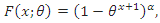 The hazard rate of the DGEx distribution is
 The figures of PMF and hr of DGEx distribution is drawn in Nekoukhou et al. (2013).
4. New Flexible Discrete Model
- In this Section, we introduce a new flexible discrete model donated [Roy (2003)], can be donated as discrete Marshall-Olkin generalized exponential (DMOGEx) distribution. Parameter estimation of DMOGEx distribution is discussed by using MLE.
4.1. The DMOGE Distribution
- Ristić and Kundu (2015) introduced the continues Marshall-Olkin Generalized exponential (MOGEx) distribution with continues CDF and survival function respectively given by
 and
and Using the survival discretization method Equation (1) and survival function of MOGEx distribution, we define the PMF of the DMOGEx distribution as
 | (3) |
 with
with  we get
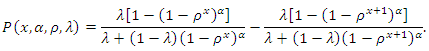 Figure 5 shows the PMF plots for different values of the model parameters. It can be seen from figure 5 that the PMF of the DMOGEx distribution is unimodal and right-skewed.
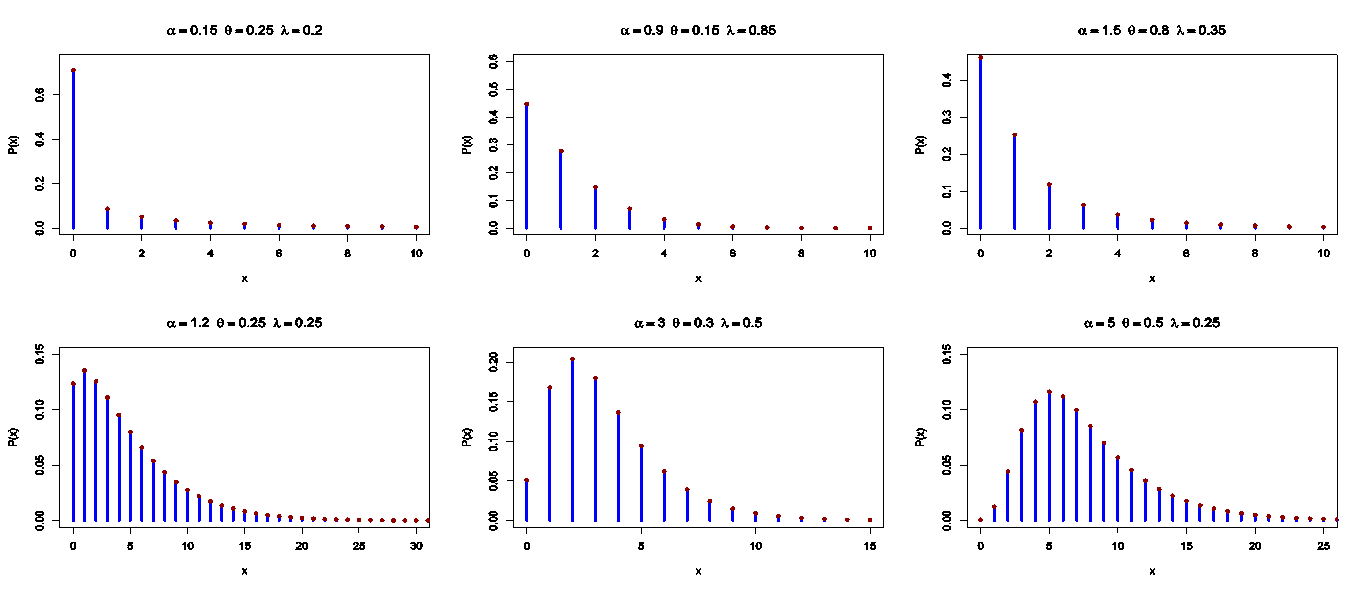 | Figure 5. The PMF plots of the DMOGEx distribution |
 | (4) |
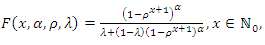
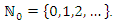 Moreover, the survival function of the DMOGEx distribution is given by
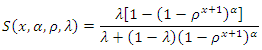 and the hr function of the DMOGEx distribution is given by
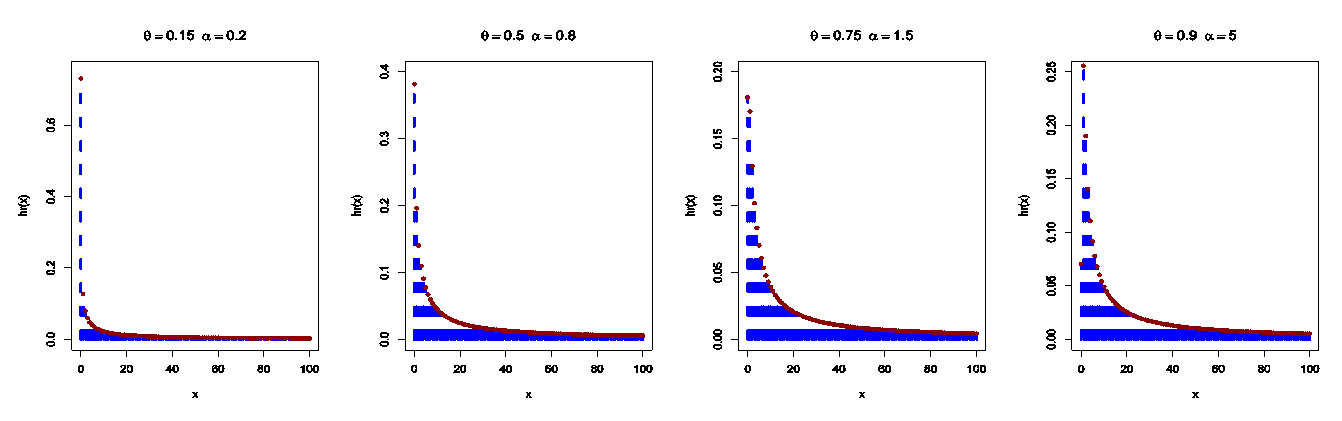
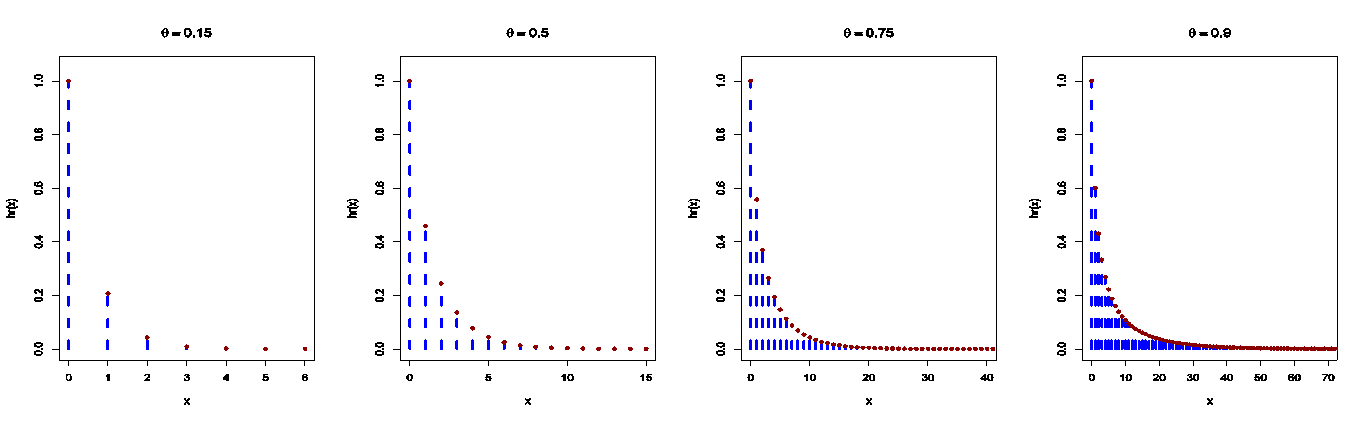
 Figure 6 shows the hr function plots of the DMOGEx distribution. It is noted that the shape of the hr function is either increasing or decreasing depending on the parameters values.
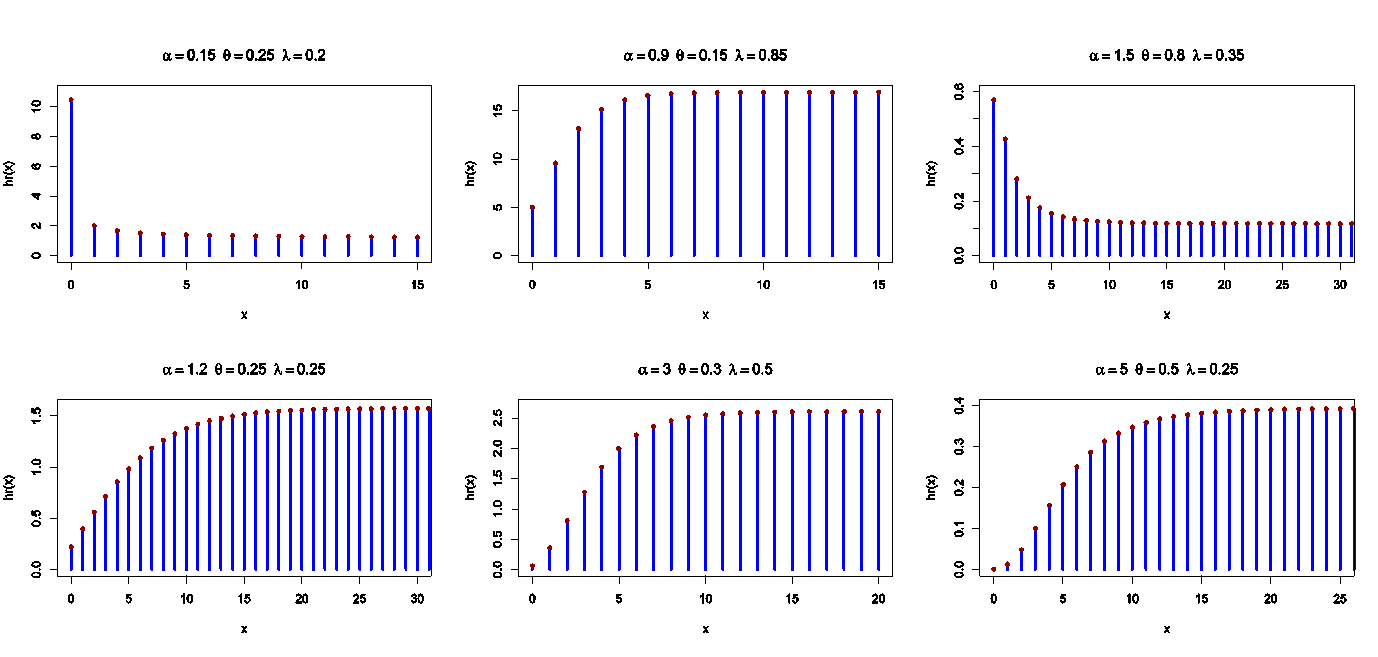 | Figure 6. The hr plots of the DMOGEx distribution |
4.2. Parameter Estimation
- The unknown parameters of the DMOGEx distribution are obtained by the maximum likelihood estimation (MLE) method. According Al-Babtain et al. (2020) and El- Morshedy et al. (2020), this method is based on the maximization of the log-likelihood for a given data set, assume that
 is a random sample of size n from a DMOGEx
  distribution. The log-likelihood function becomes
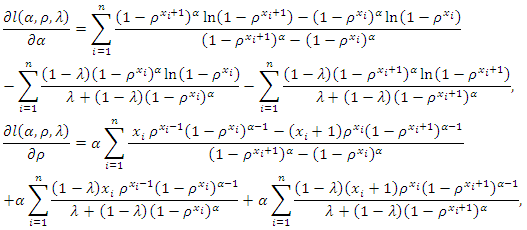
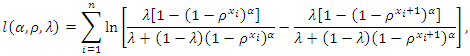 and the log-likelihood function can be rewritten as following
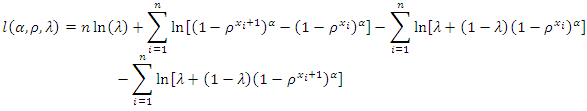 | (5) |
 and
and 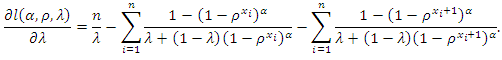 The estimate of the parameter by using MLE, which can be obtained by a numerical analysis such as the Newton–Raphson algorithm.
5. Simulation Study
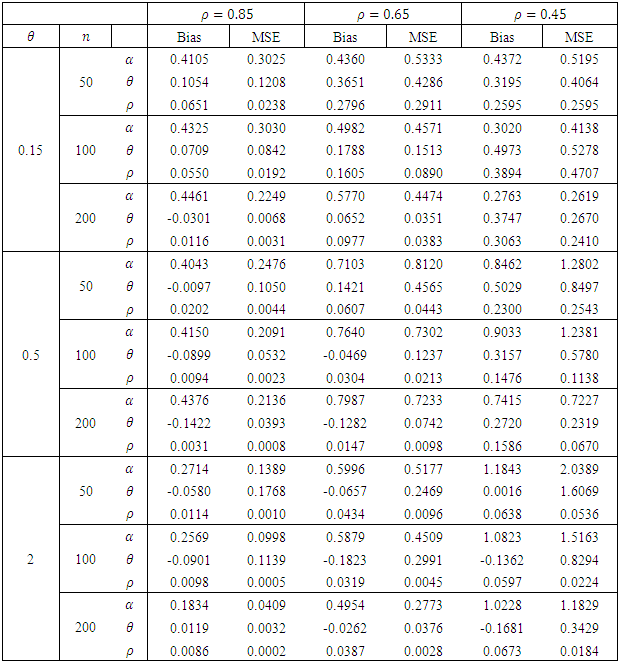
- A simulation study is conducted to compare and evaluate the behaviour of the estimators with respect to their bias and mean square error (MSE). We generate 10,000 random samples of sizes
 and 200 from DMOGEx distribution. Different sets of parameter values are used and the MLE of
  and
and  are computed. Thereafter, the bias and MSE of the estimates of the unknown parameters are computed. Simulated outcomes are listed in Tables 1-2 and the following observations are detected. • The bias and MSE decrease as sample sizes increase for all estimates (see Tables 1-2).• The bias and MSE of MLE for
  estimate is smaller than the corresponding for
  and
and  .• For fixed values of
  and as the values of
  increase, the bias and MSE in approximately most of situations, of estimates are increasing.
|

|

6. Application Analysis
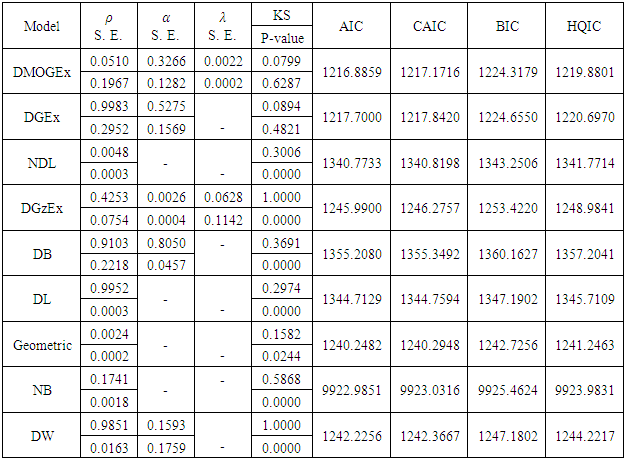
- This data represents the daily new cases of COVID-19 in Egypt. The data is available at https://covid19.who.int/ and contains the daily new cases between 15 March and 10 June 2020. The data are: 17, 16, 40, 30, 14, 46, 29, 9, 33, 39, 76, 14, 39, 41, 40, 33, 47, 54, 69, 86, 120, 85, 103, 149, 128, 110, 139, 95, 145, 126, 125, 160, 155, 168, 171, 188, 112, 189, 157, 169, 433, 0, 227, 463, 260, 226, 269, 358, 0, 298, 272, 736, 387, 0, 393, 495, 924, 346, 0, 685, 398, 0, 399, 491, 510, 535, 1465, 0, 774, 783, 727, 752, 702, 789, 910, 1127, 1289, 1367, 1536, 1399, 1152, 1079, 1152, 1348, 1497, 1467, 1365, 1385.Table 3 provide values of Kolmogorov- Smirnov (KS) statistic along with its P-value, Akaike information criterion (AIC), corrected AIC (CAIC) and Hannan-Quinn information criterion (HQIC) for all models fitted based on COVID-19 data. In addition, these tables contain the MLE and standard errors (SE) of the parameters for the considered models. We compare the fits of the DMOGEx model with DGEx [Nekoukhou et al. (2013)], NDL [Al-Babtain et al. (2020)], DGzEx [El- Morshedy et al. (2020)], DB [Krishna and Pundir (2009)], DL [Gómez-Déniz and Calderín-Ojeda (2011)], Geometric, negative binomial (NB) and DW models in Tables 3. The fitted DMOGEx PMF, CDF, PP-plot and QQ-plot of this data set are displayed in Figure 7, respectively. These figure indicate that the DMOGEx distribution get the lowest values of KS, AIC, CAIC, BIC, HQIC and largest p-value, among all fitted models.
|
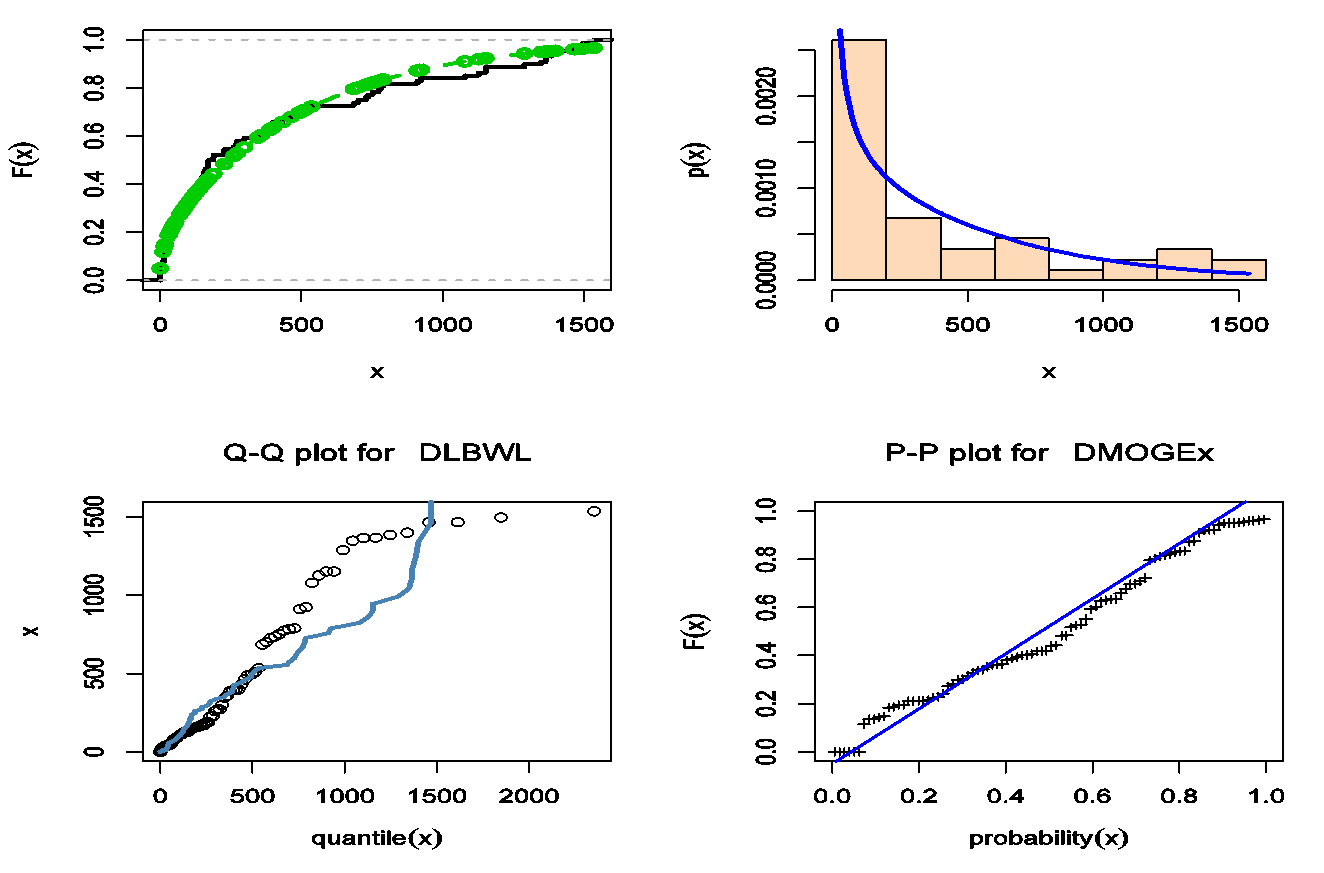 | Figure 7. Estimated PMF, CDF, PP-plot and QQ-plot of DMOGEx for COVID-19 data in Egypt data |
|
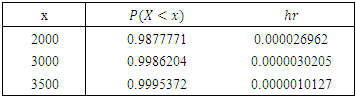
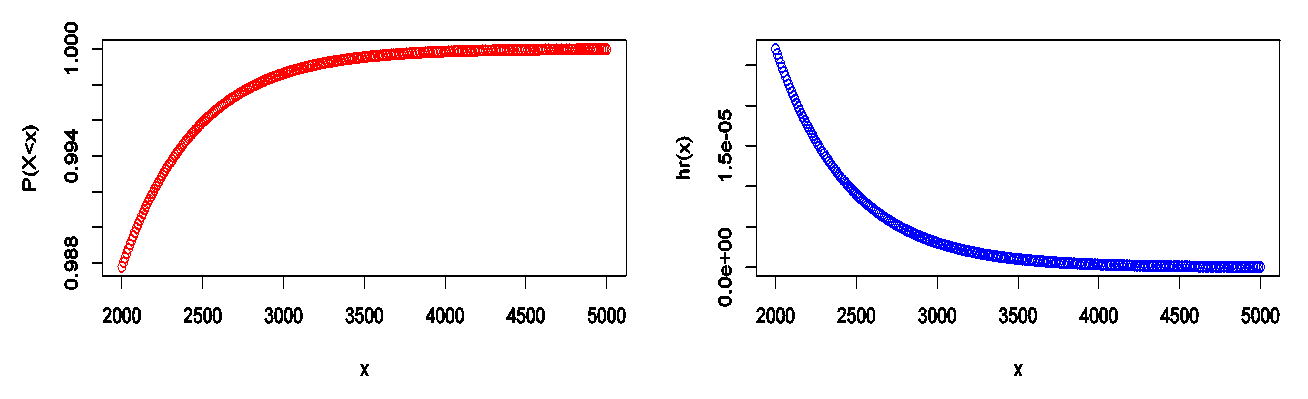 | Figure 8. Prediction of the probabilities and hazard rate for daily new cases in Egypt |
7. Concluding Remarks
- In this article, with the aim of managing the risk of spreading COVID-19 in Egypt, we proposed and studied the discrete Marshall–Olkin generalized exponential distribution. Review of some discrete distribution are provided as discrete Buur, discrete Lindley and discrete generalized exponential distribution. Maximum likelihood estimation method is discussed to estimate parameter of DMOGEx distribution. Monte Carlo Simulations are obtained to evaluate the restricted sample properties of the DMOGEx distribution. We proved empirically that the DMOGEx model reveals its superiority over other competitive models for the analysis of daily new cases of COVID-19 in Egypt.
ACKNOWLEDGEMENTS
- The authors wish to thank the editor, an associate editor, and reviewers for their helpful comments. We also thank Prof Mohamed H. Sabry for his encouragement, guidance, and support.