-
Paper Information
- Paper Submission
-
Journal Information
- About This Journal
- Editorial Board
- Current Issue
- Archive
- Author Guidelines
- Contact Us
International Journal of Probability and Statistics
p-ISSN: 2168-4871 e-ISSN: 2168-4863
2020; 9(1): 7-13
doi:10.5923/j.ijps.20200901.02

The Zero Inflated Negative Binomial - Shanker Distribution and Its Application to HIV Exposed Infant Data
 Abstract
 Reference
 Full-Text PDF
 Full-text HTML
Stella Kibika, Collins Odhiambo, Elphas Okango
Strathmore University, Nairobi, Kenya
Correspondence to: Collins Odhiambo, Strathmore University, Nairobi, Kenya.
| Email: |  |
Copyright © 2020 The Author(s). Published by Scientific & Academic Publishing.
This work is licensed under the Creative Commons Attribution International License (CC BY).
http://creativecommons.org/licenses/by/4.0/

Motivated by HIV exposed infants (HEI) sero-conversion data, we provide an extension of Zero-inflated Negative Binomial (ZINB) distribution to Zero Inflated Negative Binomial - Shanker (ZINB-SH) distribution. In this setting the ZINB-SH, distribution provides an alternative to the Poisson-Shanker distribution in particular, when data exhibits over dispersion brought by excess zeros. The HIV Exposed infant data is characterized by both structured and non-structured zeroes which makes the feature ideal in this context. We describe the properties of ZINB-SH distribution and estimate its parameters. Extensive simulations were conducted and the results in terms of goodness-of-fit, compared to the standard Negative Binomial, Shanker, Zero-Inflated Negative Binomial and Negative Binomial –Shanker distributions. The ZINB-SH distribution is competitive under different settings of simulation and does well as sample size increases. To validate the distribution, we apply real typical HIV-Infant exposed data.
Keywords: Shanker Distribution, Zero Inflated Negative Binomial, Generalized Linear Model, HIV Exposed Infants, Mother-to-Child-Transmission
Cite this paper: Stella Kibika, Collins Odhiambo, Elphas Okango, The Zero Inflated Negative Binomial - Shanker Distribution and Its Application to HIV Exposed Infant Data, International Journal of Probability and Statistics , Vol. 9 No. 1, 2020, pp. 7-13. doi: 10.5923/j.ijps.20200901.02.
Article Outline
1. Introduction
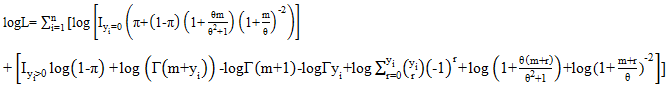
- Zero inflated models have been developed to analyze count data that exhibits many zeros. The skewed nature of the resulting distribution makes it difficult to transform the data to a normal distribution. Count models such as Poisson and negative binomial are preferred. In cases where these models are not able to handle the number of zeros, they are extended to zero-inflated models. The zero inflated Poisson (ZIP) and zero inflated negative binomial (ZINB) are the most popular models and have been used many literature [1,2 and 3]. Hurdle models are an alternative way of modelling zero inflated data and has also been utilized in several literature [4]. The Poisson hurdle model was introduced by John Mullahy [3]. The hurdle models also model the zeros and the non-zero values (zero-truncated) separately. The difference between the zero inflated models and the hurdle models is that the hurdle models do not distinguish between the structured and random zeros. All the zeros are assumed to be structured [3]. Failure to take into account both structure and unstructured zeros may introduce bias into the final results if there exists random zeros in the data [1,2 and 3].In cases where the data exhibits over dispersion, the ZINB is preferred to the Poisson. The zero inflated models introduce a second link function, the logit link, which allows the zeros to be distinguished as either structured or unstructured. There also exists hurdle models that assume all the zeros are structured. It truncates the non-zero part of the data. The hurdle models do not distinguish the zeros and may be applicable when the researcher is sure that all zeros arising from the data are structured for example when all the observations exist in a controlled space. An example would be looking at the occurrences of a disease when the entire population under investigation has been vaccinated for the particular disease. The zero inflated models will outperform hurdle models whenever the zeros in the data arise both structurally and randomly [5].In order to create more flexible models, there are some mixed models such as zero inflated negative binomial-Crack (ZINB-CR) [6], zero inflated negative binomial-Sushila (ZINB-S) [7] and zero inflated negative binomial-Generalized exponential (ZINB-GE) [8] that have been developed. These models have been shown to perform better than the ZINB with fewer parameters. They are all parametric models that involve estimation of parameters.The disadvantage of the extended models is the complexity that is introduced with mixing two distributions. Estimation of parameters becomes more complex and requires algorithms such as the Newton Raphson and Expectation-Maximization (EM) algorithms. To achieve convergence, statistical software is used to make the process easier. There is also no standard procedure to tell when a dataset is exhibiting zero inflation [9].The ZINB model is a model that is used to address the issue of over dispersion in count data with excess zeros. We seek to extend the ZINB probability distribution function (PDF) to allow for greater flexibility by introducing more randomness. Structured zeros occur due to the presence of a group that is not at risk of exhibiting the phenomena under study. Structured zeros are inevitable while unstructured zeros occur by chance. Ridout [4] gives an example of the distinction between the zeros using horticulture data where, in counting disease lesions on plants, a plant may have no lesions either because it is resistant to the disease(structured), or simply because no disease spores have landed on it(unstructured). In this study, the focus will be on mothers who undergo prenatal and postnatal care in facilities that are equipped to prevent transmission (structured) and mothers who do not receive prenatal and postnatal care or visit facilities that are not equipped to prevent transmission (unstructured). Distinguishing structured and unstructured zeros is important here because the two groups have different probabilities of mother to child transmission. The zero inflated models are applied to such kind of data, with more zeros than the probability distribution expects, to account for the excess zeros. Creating more flexible models is important for the bias-variance trade off and creating models that have better predictive ability. The mixed models mentioned in the introduction have been proven to perform better than the original form of ZINB.Majority of sero-conversion among HIV Exposed Infants (HEI) occurs during the pregnancy, delivery and breastfeeding process [16]. The government and World Health Organization have put measures in place for Prevention of Mother to Child Transmission (PMTCT). These interventions have been introduced as a result of the high infant mortality rate recorded due to HIV in the period 1970-1990 where it also emerged that Mother to Child Transmission was a key factor [10]. The interventions put in place have resulted in a decrease in the number of MTCT from 29.7% in 2015 to 11.5% in 2017 with PMTCT coverage of 77% [11]. The difference in the quality of health services offered across the country leads to suboptimal procedures for PMTCT in certain facilities leading to random zeros in data collected for HIV sero-conversion [12].In many studies relying on count data where the counts may exhibit more zeros than the common count models can handle, zero inflated models can be used to model the outcomes. This is useful especially when some of the zeros recorded are not occurring randomly. For example, if an intervention is put in place to prevent a phenomenon from occurring, the data collected will contain zeros occurring randomly and those that are a result of the intervention.The negative binomial distribution is useful since it accounts for over dispersion that may be present in the data. However, it is not able to cater for excess zeros; therefore the ZINB distribution is applied. The ZINB applies weights to the structured and random zeros. It gives a weight π to the structured zeros and (1-π) to the random zeros and other count values greater than zero.Given a random variable y,
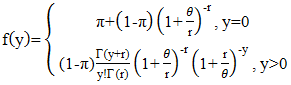 | (1) |
2. Methodology
2.1. Research Design
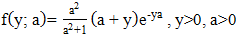
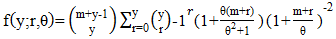
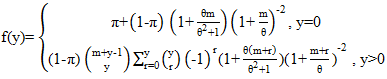
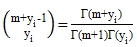
- This study will create a mixture distribution for the ZINB and Shanker distributions. The model will then be applied on a real dataset of HIV exposed infants. The new distribution is made of the negative binomial and Shanker distributions and then adjusted for zero inflation.The negative binomial DistributionThe probability distribution function is given by:
 | (2) |
 | (3) |
 | (4) |
 | (5) |
 | (6) |
 | (7) |
 | (8) |
 | (9) |
 The distribution assumes
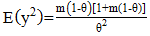
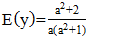
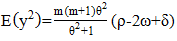
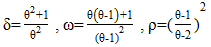
  follows a Shanker (θ) distribution.The following are the properties of the NB-SH as shown by Tlhaloganyang [14]:
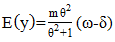 | (10) |
 | (11) |
 | (12) |
 | (13) |
 | (14) |
 | (15) |
 | (16) |
 | (17) |
 | (18) |
 | (19) |
 | (20) |
 | (21) |
 | (22) |
 | (23) |
 | (24) |
2.2. Data
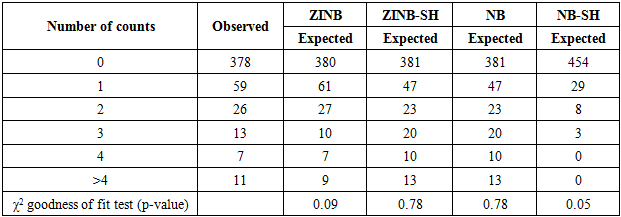
- The data used will be secondary data from publicly available information. It will be from three high burden areas, Kisumu, Nairobi and Mombasa. This data exhibits zero inflation because of the measures that have been put in place to reduce the rate of Mother to Child Transmission (MTCT). This increases the chance of children being born HIV-free and the chance of recording a zero. Due to the intervention, the results will contain structured zeros. All HEI sero-conversion who were registered in the EID programme in Kisumu, Nairobi and Mombasa between January 2014 and December 2018 were included in the study. From study sampling frame, a total of 494 samples were collected from HEI visiting 60 health facilities across the three cities in Kenya and obtained PCR testing together with the results. HEI with missing age or greater than 2 years old were excluded from analysis. Statistical analysisData was transferred from the Microsoft excel windows 12 to R Studio [16] is for analysis. The analysis involves generating new random variables and getting density curves. The density curves will show the manner in which a given distribution fits the data, especially the zeros. We obtain a chi-square goodness of fit test to compare the distributions.Chi-square test for goodness of fit test:
 | (25) |
2.3. Simulations
- Simulation will be achieved by use of common simulation methods such as the acceptance rejection region method to fit a new probability distribution. The method is an iterative method and statistical software which will be used to run the algorithm. The goal will be to generate random numbers following the ZINB-SH
 The results will be used to generate plots to visualize the shape of the distribution. The steps used will be:i. Generate U from the Uniform (0, 1) distribution.ii. Let
  come from the Shanker Distribution (θ).iii. Generate Y from the NB (m, p) distribution.
  iv. Generate U* from the Uniform (0, 1) distribution.v. if
  set X=Y, otherwise X=0
 3. Results
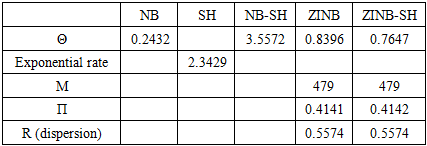
- A simulation was carried out based on four distributions. Negative Binomial (NB), Negative Binomial – Shanker (NB-SH), Zero Inflated Negative Binomial (ZINB) and Zero Inflated Negative Binomial Shanker (ZINB-SH). The simulation is based on the following parameters estimated using maximum likelihood method in R statistical software:
|
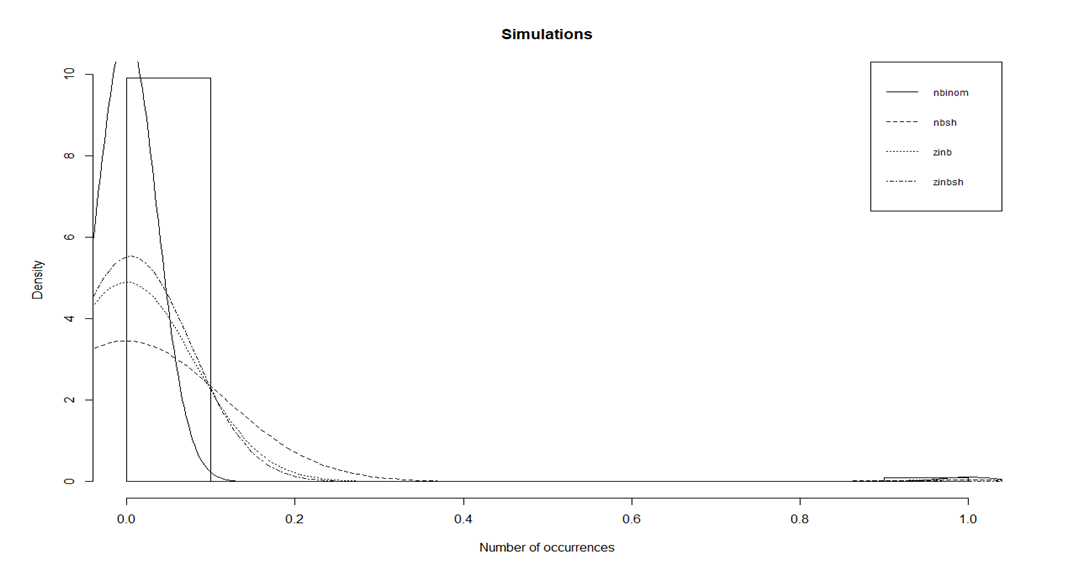 | Figure 1. Density plots from simulations |
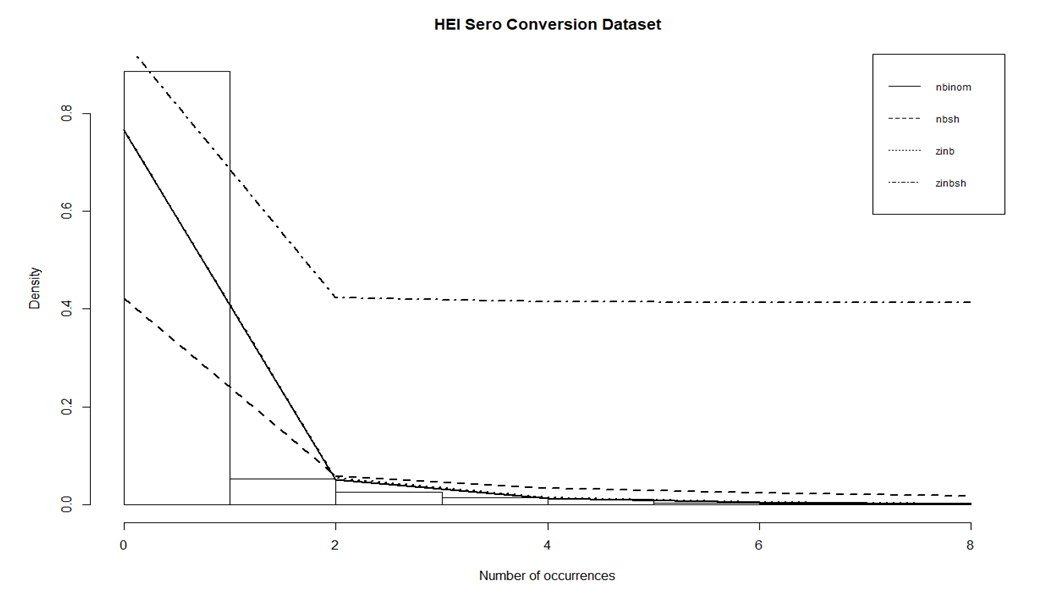 | Figure 2. Density plots from a HEI-Sero conversion data-set |
|
4. Discussion
- Interventions that targets PMTCT remain important HIV management considerations and are intended to mitigate the risk of HIV transmission from HIV infected mothers to their children. Kenya, in particular, has to a large extent, made significant progress in reducing MTCT rate. Literature has shown, for effective reduction in transmission, interventions for HEI begin well before delivery [17]. The HEI care and treatment, focuses on reducing the risk of infection with PreP, monitoring for signs and symptoms of HIV sero-conversion, and adhering to PCR testing schedule and starting treatment immediately. The UNAIDS report describe a 26% decline in incident HIV infections between 2009 and 2015 in the Global Plan priority countries in Sub-Saharan Africa [18,21]. This study is motivated by typical HEI sero-conversion data. In this setting the ZINB-SH, distribution provides an alternative to the Poisson-Shanker distribution in particular, when data exhibits over dispersion brought by excess zeros. The HIV Exposed infant data is characterized by both structured and non-structured zeroes which makes the feature ideal in this context. HEI sero-conversion data is collected routinely by ministry of health (MoH) in Kenya. Naturally, implementation of PMTCT is heterogeneous and results to structure-zero among positive HEI (situation where PMTCT is implemented optimally) and random zero among positive HEI (situation where PMTCT is implemented sub-optimally). Failure to accommodate structured and random zero-inflation may result in false inference [14]. With this backdrop, the conventional zero-inflated distributions that do not consider structured and random zeros in data may give misleading results. Several rigorous and non-rigorous count data analysis approaches with zero inflation have been proposed by different researchers. Nekesa [12] did a comparison of four zero inflated models including the Zero Inflated Poisson (ZIP), Zero Altered Poisson (ZAP), Zero Inflated Negative Binomial (ZINB) and Zero Altered Negative Binomial (ZANB). Nekesa [12] concluded that the ZAP was the best model based on AIC values for the different models. Covariates are used to run a regression based on the four models and HEI is shown to be twice likely to detect HIV compared to initial Polymerase chain reaction (PCR).Here we provide an extension of Zero-inflated Negative Binomial (ZINB) distribution to Zero Inflated Negative Binomial - Shanker (ZINB-SH) distribution. We have described the properties of ZINB-SH distribution and estimate its parameters. Extensive simulations were conducted and the results in terms of goodness-of-fit, compared to the standard Negative Binomial, Zero-Inflated Negative Binomial and Negative Binomial – Shanker distributions. The ZINB-SH distribution is competitive under different settings of simulation and does well as sample size increases. To validate the distribution we apply real typical HIV-Infant exposed data.
4.1. Conclusions
- In this work, the aim was to create a new distribution for zero inflated data and determine whether the new distribution performs better than the standard ZINB. The major difference between the two distributions is that ZINB-SH allows the parameters of the NB to be random and follow a distribution of their own, the parameters for the new distribution are determined using the maximum likelihood method. The new model is used in generating new random variables through simulations. It is also applied to a HEI sero-conversion dataset. In this case the ZINB-SH distribution has been shown to be competitive in performing analysis on zero inflated data. In the context of mixture distributions, a distribution with more parameters being random, with their own distribution, provides greater flexibility. ZINB-SH can be considered as a distribution when fitting models that exhibit excess zeros.
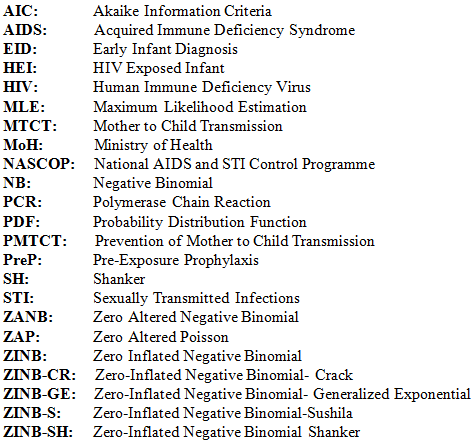
Abbreviation
ACKNOWLEDGEMENTS
- The authors would like to thank the Strathmore Institute of Mathematical Sciences and the faculty who have supported the research by devoting their time and intellectual resources.