Bosson-Amedenu Senyefia, Habib Bipembi, Toffe Gladys
Department of Mathematics and ICT, Holy Child College of Education, Takoradi, Western Region, Ghana
Correspondence to: Bosson-Amedenu Senyefia, Department of Mathematics and ICT, Holy Child College of Education, Takoradi, Western Region, Ghana.
| Email: |  |
Copyright © 2019 The Author(s). Published by Scientific & Academic Publishing.
This work is licensed under the Creative Commons Attribution International License (CC BY).
http://creativecommons.org/licenses/by/4.0/

Abstract
This paper sought to estimate the effect of socioeconomic variables such as education level, type of employment and settlement type on the fertility rate of women in Ghana using the method of cohort Total fertility rate (TFRc) computed through parity progression ratios (PPRs) and the use of survival and categorical analyses to determine the relationship among the categories. The Kaplan Meier statistics showed a significant difference among the six categories. The hazard function plot showed that the women who have low education and women in informal employment have the highest hazard in terms of fertility (they tend to have more children than the other treatment categories) followed by women in rural settlement. However, the survival plot shows that women with high education level and those in formal employment have performed better (they tend to have fewer children) followed by women living in sub-urban settlement. Formal workers were found to have lower fertility rate compared to informal workers (TFRc: 2.1<2.4). Similarly, Sub-urban women were found have lower fertility rate compared to rural women (TFRc: 2.2<2.5). Again, highly educated women were found to have lower fertility rate compared to those who are less educated (TFRc: 1.9 <2.3). Women with higher Education level (senior high level and above) were found to be 0.175 times less likely to have children beyond parity 3 in comparison with those with lower level of education. Women in sub-urban settlement were found to be 0.237 times less likely to have children beyond parity 3 than those in rural settlement. Again, informal sector workers were found to be 7.383 times more likely to have children beyond parity 3 than formal workers. It was recommended for population control education to be targeted at women in rural settlements, those in informal sector as well as women with little or no formal education.
Keywords:
Parity progression ratio (PPR), Total fertility rates, Categorical analysis, Cohort, Kaplan Meier, Survival
Cite this paper: Bosson-Amedenu Senyefia, Habib Bipembi, Toffe Gladys, Parity Progression Estimation and Categorical Analysis of Birth Cohort Data in Ghana: The Case of Birth Data Derived from Health Insurance Data, International Journal of Probability and Statistics , Vol. 8 No. 2, 2019, pp. 23-29. doi: 10.5923/j.ijps.20190802.01.
1. Introduction
One of the most prominent indexes of fertility rate which provides a hint concerning the average parity of women throughout their entire reproductive period is called the cohort Total fertility rate. It has a basic flaw of not being able to account for the proportion of women in the respective population who fail to proceed to the next birth after putting to birth a particular number of children. This information is very key factor in determining the general fertility performance of a population of interest since this can reveal practices that promote family limitation such as assessing the impact of family planning programmes on fertility of developing countries including Ghana. Parity Progression Ratios (PPR) is defined as the proportion of women of a given parity who go on to have another child. PPRs play a major role in the comprehension of the distribution of cohort fertility [1, 2, 3, 4, and 5].The concept of PPR has been applied in the study of differentials in trends in PPRs among women in the north and south part of India. The data was extracted from the National Family Health-Survey III. The study found a decreasing trend of PPRs from older to recent parity cohorts which was in contrast with the trend associated with the north which exhibited a non-significant decline in comparison with the south. The northern and southern parts of India exhibited vast differentials in PPR with respect to each other [5, 6].Multivariate analysis has been applied in the study the effect of socioeconomic variables on TFR and related components as well as on the trend in the total fertility rate and related components. The data was derived from 2003 Demographic and Health surveys in Philippines. The study incorporated a ten year cohort with cohort measures based on earlier reproductive experience of women age 40-49 at the time of each survey for the years 1993, 1998 and 2003. Among the many findings of the study included choice of residence of women and education were significant predictors of fertility [7].Another study was conducted to examine the determinants of parity progressions (cohort fertility) in Norway. The study qualified a woman’s level of education as significant predictors of fertility. Others were resident and religion of women. Highly educated women were found to have lower number of children (parity of 2) where the second child occurred in their late reproductive years [8].
2. Method
The birth data was extracted from National Health Insurance Data over a ten year period at the time of first registration to the scheme. The cohort measures were based on past reproductive experience of women aged 40-49 at the time of collection of data. PPR from j births to 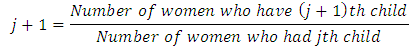 Cohort Total fertility rate
  is computed from the PPRs as follows:
 Binomial logistic regression has dichotomous dependent variable with dependent variables qualifying to either be categorical or continuous with independent variables. Logit model is of the form:
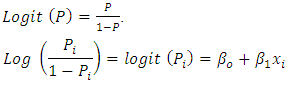 The odds can be written as:
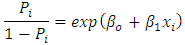 In terms of probability of success (intent to have more children, i.e beyond parity 3) occurring,
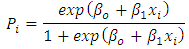 Conversely, the probability of failure will be written as:
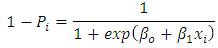 IBM SPSS Statistics Version 25 was used in the analysis.
3. Analysis
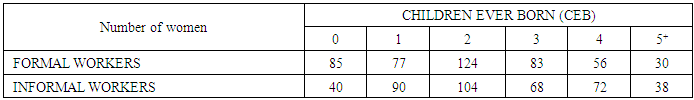
Table 1. CEB Data for Formal and Informal workers of cohort followed from 2007-2017
 |
| |
|
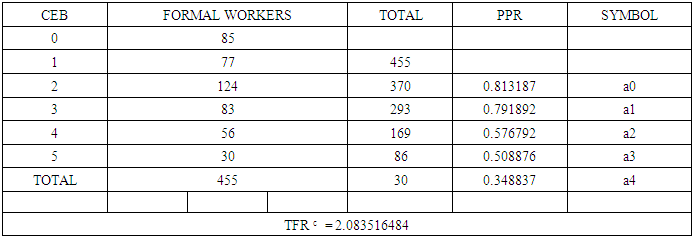
Table 2. Parity Progression Ratio for Formal workers of cohort followed from 2007-2017
 |
| |
|
The fertility rate of women who are formal workers by method of PPR (Total fertility rate cohort, TFRc) was approximately found to be 2.1 per woman. The recognizable stall in fertility was particularly motivated by the decrease pattern in the parity progression ratios in the third and higher ages. The probability of a woman who is a formal worker with zero child going on to have one child was approximately 0.81. Also the probability of a woman who is a formal worker with 1 child and going on to have a second child was approximately 0.79. Again, the probability of a woman who is a formal worker with 2 children going on to have third child was approximately 0.58. In addition, the proportion of a woman who is a formal worker with 3 children and going on to have a fourth child was approximately 0.51. Finally, the proportion of a woman who is a formal worker with 4 children and going on to have a fifth or more children was approximately 0.35.Table 3. Parity Progression Ratio for Informal workers of cohort followed from 2007-2017
 |
| |
|
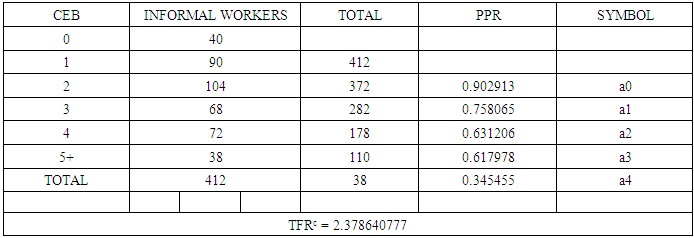
The fertility rate of informal workers by method of PPR (Total fertility rate cohort, TFRc) was approximately found to be 2.4 per woman. The recognizable stall in fertility was particularly motivated by the decrease pattern in the parity progression ratios in the third and higher ages. The fertility rate of formal workers by method of PPR was approximately found to be 2.1 per woman. The recognizable stall in fertility was particularly motivated by the decrease pattern in the parity progression ratios in the third and higher ages. The probability of a woman who is a formal worker with zero child going on to have one child was approximately 0.90. Also the probability of a woman who is a formal worker with 1 child and going on to have a second child was approximately 0.76. Again, the probability of a woman who is a formal worker with 2 children going on to have third child was approximately 0.63. In addition, the proportion of a woman who is a formal worker with 3 children and going on to have a fourth child was approximately 0.62. Finally, the proportion of a woman who is a formal worker with 4 children and going on to have a fifth or more children was approximately 0.35. Results from table 2 and 3 show a fertility range of 2.1 - 2.4 children per woman between formal and informal workers in Ghana.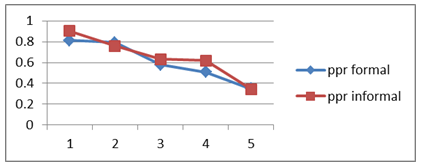 | Figure 1. Graph of Parity Progression Ratios of Informal and formal workers |
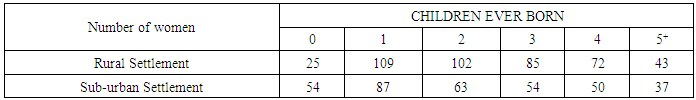
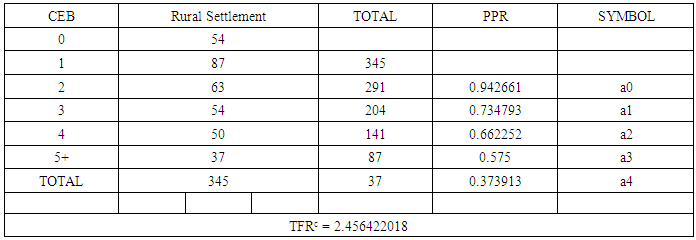
Fertility rates by the method of PPR showed that formal workers have lower parity compared to informal workers (TFRc: 2.1<2.4). Figure 1 shows that parity progression ratios of informal workers were generally greater than that of the informal workers except for the second PPR value. The pattern for informal sector women shows a steeper but linear decline for parities 1 to 3 and 4 to 5+. However, the pattern for formal sector workers show almost a constant trend for parities 1 and 2, then steeper from parities 2 and 3 and further steeper for parities 4 and 5 plus.The fertility rate of women in a rural settlement by method of PPR (Total fertility rate cohort, TFRc) was approximately found to be 2.5per woman. The recognizable stall in fertility was particularly motivated by the decrease pattern in the parity progression ratios in the third and higher ages. The probability of a woman who is in a rural settlement with zero child and going on to have one child was approximately 0.94. Also the probability of a woman who is in a rural settlement with 1 child and going on to have a second child was approximately 0.73. Again, the probability of a woman who is in a rural settlement with 2 children and going on to have third child was approximately 0.67. In addition, the proportion of a woman who is in a rural settlement with 3 children and going on to have a fourth child was approximately 0.58. Finally, the proportion of a woman who is in a rural settlement with 4 children and going on to have a fifth or more children was approximately 0.37.Table 4. CEB Data on Rural Settlement and Sub-urban Settlement of cohort followed from 2007-2018
 |
| |
|
Table 5. Parity Progression Ratio for Rural Settlement (women) of cohort followed from 2007-2018
 |
| |
|
Table 6. Parity Progression Ratio for Sub-urban Settlement (women) of cohort followed from 2007-2018
 |
| |
|
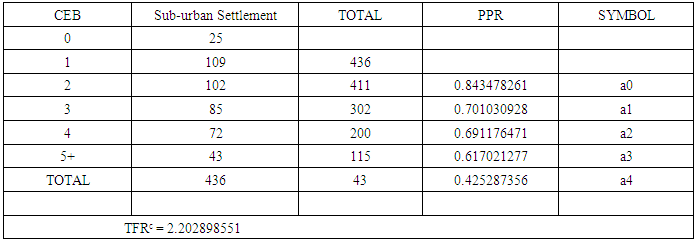
The fertility rate of women in a Sub-urban settlement by method of PPR (Total fertility rate cohort, TFRc) was approximately found to be 2.2per woman. The recognizable stall in fertility was particularly motivated by the decrease pattern in the parity progression ratios in the third and higher ages. The probability of a woman who is in a Sub-urban settlement with zero child and going on to have one child was approximately 0.84. Also the probability of a woman who is in a Sub-urban settlement with 1 child and going on to have a second child was approximately 0.70. Again, the probability of a woman who is in a Sub-urban settlement with 2 children and going on to have third child was approximately 0.69. In addition, the proportion of a woman who is in a Sub-urban settlement with 3 children and going on to have a fourth child was approximately 0.61. Finally, the proportion of a woman who is in a Sub-urban settlement with 4 children and going on to have a fifth or more children was approximately 0.42. Results from table 5 and 6 show a fertility range of 2.2 - 2.5 children per women between rural and semi-urban women in Ghana.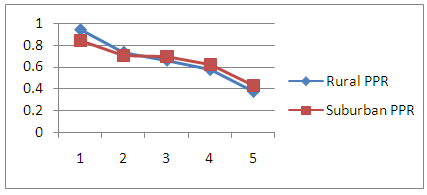 | Figure 2. Graph of Parity Progression Ratios of rural and sub-urban women |
Fertility rates by the method of PPR showed that sub-urban women have lower parity compared to rural women (TFRc: 2.2<2.5). Figure 2 shows that parity progression ratios of rural women were greater than that of the sub-urban women for parities 1 and 2. However, beyond parity 2, parity progression ratios of suburban women was somewhat higher than rural women.Table 7. CEB Data for Lower and Higher education level of cohort followed from 2007-2017
 |
| |
|
Table 8. Parity Progression Ratio for Low Education level (Primary and below) of cohort followed from 2007-2017
 |
| |
|
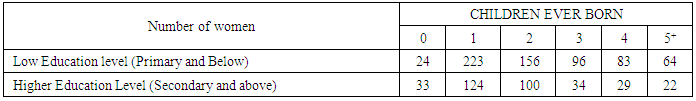
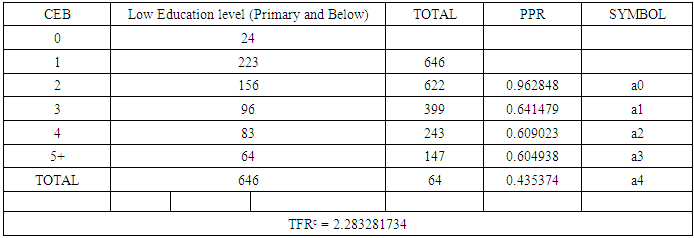
The fertility rate of women with Low Education level by method of PPR (Total fertility rate cohort) was approximately found to be 2.3per woman. The recognizable stall in fertility was particularly motivated by the decrease pattern in the parity progression ratios in the third and higher ages. The probability of a woman who has Low Education level with zero child and going on to have one child was approximately 0.96. Also the probability of a woman who has Low Education level with 1 child and going on to have a second child was approximately 0.64. Again, the probability of a woman who has Low Education level with 2 children and going on to have third child was approximately 0.61. In addition, the proportion of a woman who has Low Education level with 3 children and going on to have a fourth child was approximately 0.60. Finally, the proportion of a woman who has Low Education level with 4 children and going on to have a fifth or more children was approximately 0.44.Table 9. Parity Progression Ratio for Higher Education Level (Secondary and above) of cohort followed from 2007-2017
 |
| |
|
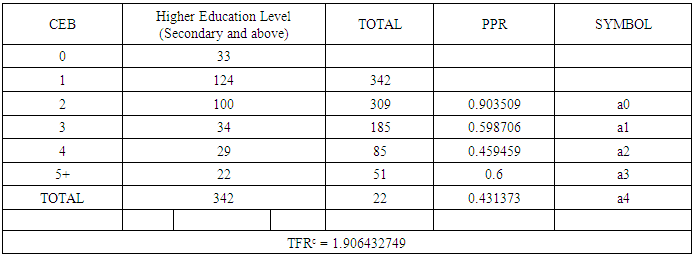
The fertility rate of women with Low Education level by method of PPR (Total fertility rate cohort, TFRc) was approximately found to be 1.9 per woman. The recognizable stall in fertility was particularly motivated by the decrease pattern in the parity progression ratios in the third and higher ages. The probability of a woman who has high Education level with zero child and going on to have one child was approximately 0.9. Also the probability of a woman who has High Education level with 1 child and going on to have a second child was approximately 0.60. Again, the probability of a woman who has high Education level with 2 children and going on to have third child was approximately 0.46. In addition, the proportion of a woman who has high Education level with 3 children and going on to have a fourth child was approximately 0.60. Finally, the proportion of a woman who has high Education level with 4 children and going on to have a fifth or more children was approximately 0.43.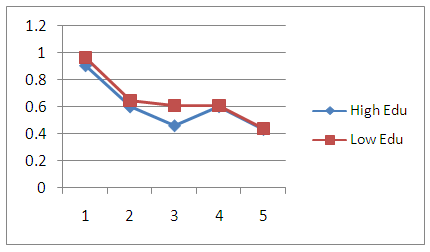 | Figure 3. Graph of Parity Progression Ratios of High and Low educated women |
Table 10. Coefficientsa
 |
| |
|
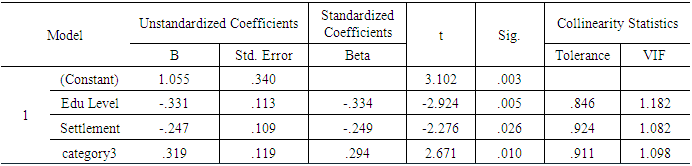
Fertility rates by the method of PPR showed that highly educated women have lower parity compared to those who are less educated (TFRc: 1.9 <2.3). Figure 3 shows that parity progression ratios of less educated women were generally greater than that of the higher educated women except for parities 4 and beyond which appear to be at par.The covariates passed a Multicollinearity test (no multicollinearity) where the computed values of variance inflated factor (VIF) lie within acceptable range of 1-10 (Montgomery, 2010). The explanatory variables are not strongly correlated among themselves.Table 11. Model Summary
 |
| |
|
The Cox and Snell’s R squared and Nagelkerk R squared values suggest that the model explains roughly 27% and 36.6% of the variation in the outcome respectively.Table 12. Variables in the Equation
 |
| |
|
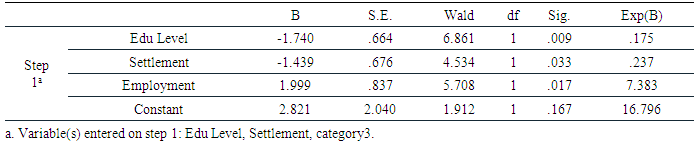
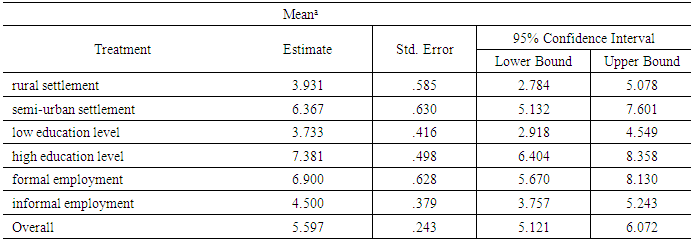
The table shows the output of variables in the equation with a dichotomous dependent variable. The Education level group has negative coefficient (B = -1.740) and statistically significant (p<0.05). Women with higher Education (senior high level and above) are significantly (0.175 times) less likely to have the intent to have above 3 children than those with lower level of education (below senior high level). Again, settlement level has negative coefficient (B = -1.439) and statistically significant (p<0.05). Women in sub-urban settlement were found to be significantly (0.237 times) less likely to have children beyond parity 3 than those in rural settlement. Finally, the Employment level has positive coefficient (B =1.999) and statistically significant (p<0.05). Informal sector workers who are women are significantly more likely (7.383 times) to have children beyond parity 3 than formal workers.Table 13. Means for Survival Time
 |
| |
|
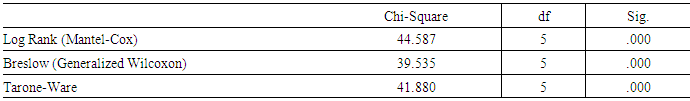
There seem to be quite some difference in the means for survival time and it is important to test if this difference is significant.Table 14. Overall Comparisons
 |
| |
|
Test of equality of survival distributions for the different levels of Treatment.The results from all three statistics showed a statistically significant result.The survival plot shows that women with high education level and those in formal employment have performed better (they tend to have fewer children) followed by women living in sub urban settlement. The hazard function plot shows that the women who have low education and those in informal employment have the highest hazard in terms of fertility (they tend to have more children than the other treatment categories) followed by women in rural settlement. 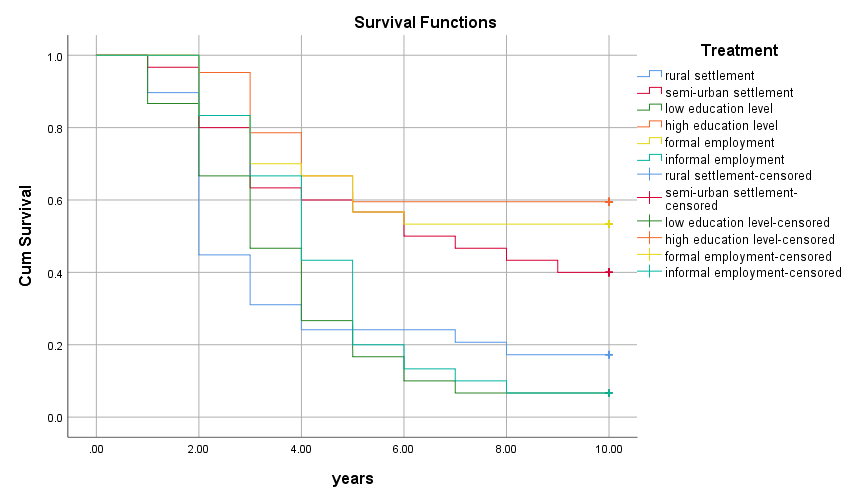 | Figure 4. Survival Function Plot |
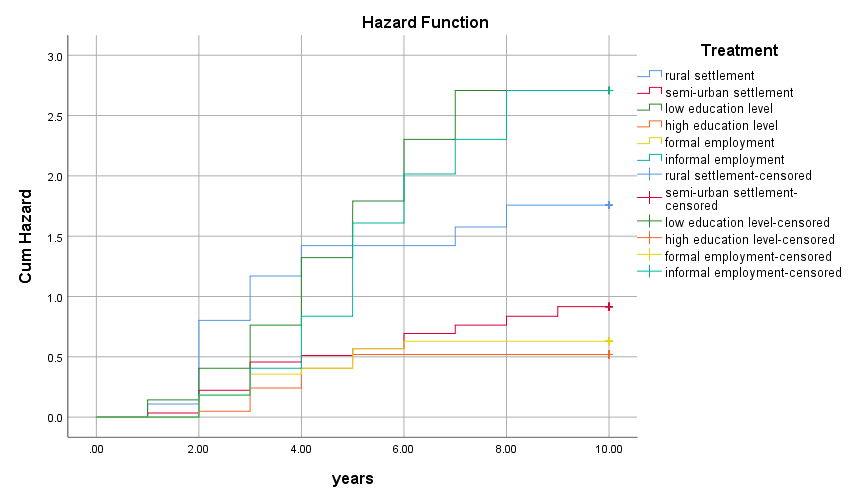 | Figure 5. Hazard Function Plot |
4. Conclusions
This paper sought to estimate the effect of socioeconomic variables such as education level, type of employment and settlement type on the fertility rate of women in Ghana using the method of cohort Total fertility rate (TFRc) computed through parity progression ratios (PPRs) and the use of survival and categorical analyses to determine the relationship among the categories. The Kaplan Meier statistics showed a significant difference for the six categories. The hazard function plot showed that the women who have low education and those in informal employment have the highest hazard in terms of fertility (they tend to have more children than the other treatment categories) followed by women in rural settlement. However, the survival plot shows that women with high education level and those in formal employment have performed better (they tend to have fewer children) followed by women living in sub urban settlement. Formal workers were found to have lower fertility rate compared to informal workers (TFRc: 2.1<2.4). Similarly, Sub-urban women were found have lower fertility rate compared to rural women (TFRc: 2.2<2.5). Again, highly educated women were found to have lower fertility rate compared to those who are less educated (TFRc: 1.9 <2.3). Women with higher Education level (senior high level and above) were found to be 0.175 times less likely to have children beyond parity 3 in comparison with those with lower level of education (below senior high level). Women in sub-urban settlement were found to be 0.237 times less likely to have children beyond parity 3 than those in rural settlement. Again, informal sector workers who are women were found to be 7.383 times more likely to have children beyond parity 3 than formal workers. It was recommended for population control education to be targeted at women in rural settlements, those in informal sector as well as women with little or no formal education.
5. Implication for Future Research
Future research can explore the many other socioeconomic factors not considered in this study to examine their effect on fertility rates.
6. Future Research
Future research can use larger data source and increase the span of the study in order to get more robust outcome. Estimation of confidence intervals for PPRs can also be considered.
7. Recommendations
As part of the recommendations of this paper,1. Population control education or interventions should to be targeted at women in rural settlements, those in informal sectors of employment as well as women with little or no formal education.2. Ghana as a country must begin steps to improve upon data preservation and accuracy in order to assure the quality of data (example is in terms of age reporting) used in research studies.
References
| [1] | Yadava R.C., Kumar A. (2011). The Estimation of Parity Progression Ratios. Journal of Scientific Research, Vol.55, 2011: 127-134, ISSN: 0447-9483. |
| [2] | Yadava, R.C., and Bhattacharya, M. (1985). Estimation of parity progression ratios progression ratios from closed and open birth interval data, Mimeo, Centre of Population studies, Babaras Hindu University, Varanasi, India. |
| [3] | Yadava, R.C., Pandey, A. Saxena, N.C. (1989). Estimation of parity progression and instantaneous parity progression ratios, in population Transition in India, Vol.1, 357-362., S.N. Singh et.al., eds., B.R. Publishers, New Delhi. |
| [4] | Yadava, R.C., and Kumar, A. (2002). A modified procedure of computation of parity progression ratios from birth interval data, Janasmkhya, Vol. XX, 33-40. |
| [5] | Yadava, R.C., Pandey, A. Saxena, N.C. (1992). Estimation of parity progression and instantaneous parity progression ratios from truncated distribution of closed and open birth intervals, Mathematical Biosciences, 110, 181-190. |
| [6] | Verma S., Singh K.K (2014). Trends and differentials in parity progression among women in northern and southern India. Asian Journal of Research in Social Sciences and Humanities. Vol. 4, No. 3, pp. 42-56. |
| [7] | Retherford R.D, Ogawa, R.M and Hassan E.Z. (2006). Multivariate Analysis of Parity Progression-Based Measures of the Total Fertility Rate and Its Components Using Individual-Level Data. East-West Center Working Papers. www.EastWestCenter.org. |
| [8] | Leon C. (1990). Recent Developments in Parity Progression Intensities in Norway: An Analysis based on Population Register Data. Discussion Paper. No. 51. |

 Abstract
 Reference
 Full-Text PDF
 Full-text HTML