Maureen T. Nwakuya1, Omosivie Mmaduka2
1Department of Mathematics/Statistics, University of Port Harcourt, Port Harcourt Rivers State, Nigeria
2Department of Prevention and Social Medicine, College of Health Science, University of Port Harcourt Teaching Hospital, Port Harcourt Rivers State, Nigeria
Correspondence to: Maureen T. Nwakuya, Department of Mathematics/Statistics, University of Port Harcourt, Port Harcourt Rivers State, Nigeria.
| Email: |  |
Copyright © 2019 The Author(s). Published by Scientific & Academic Publishing.
This work is licensed under the Creative Commons Attribution International License (CC BY).
http://creativecommons.org/licenses/by/4.0/

Abstract
Mental health is the state of well-being of an individual, were such individual can cope with the stresses of life and still make contribution to his/her community. Research has shown that there is an association between behavioral tendencies of undergraduate students and their mental health. This we believe is due to stress of full time academic program. Bearing this in mind we focused our research in identifying these factors that affect the mental health of students and ascertain the level of relationship between them and the student’s mental health. We adopted the stratified sampling technique for data collection and used self-administered questionnaire to identify the prevalence of factors known to be associated with mental health. The ordered logistic regression was carried out to obtain a proportional odds model that was used to model this relationship. The results show that when the current well-being of the students increase by a unit the odds of mental health state of the student being in an unstable state or mildly-unstable state versus stable state increases by 36.27%, given that any other variable is held constant. Also when the coping strategy increases the odds also increases by 33.16%, we can also observe that increase in the mental health assessment also increases the odds of mental health in unstable or mildly unstable state versus stable state, by 22.49%. A close look at the odds ratio and the regression coefficients makes us conclude that the most influential factors of the mental health is the current well-being of the student, followed by coping strategies and lastly the mental health assessment.
Keywords:
Mental health, Ordered Logistic Regression, Stratified Sampling, Proportional Odds Ratio and Categorical data
Cite this paper: Maureen T. Nwakuya, Omosivie Mmaduka, Ordered Logistic Regression on the Mental Health of Undergraduate Students, International Journal of Probability and Statistics , Vol. 8 No. 1, 2019, pp. 14-18. doi: 10.5923/j.ijps.20190801.02.
1. Introduction
Mental health is the state of well-being of an individual, were such individual can cope with the stresses of life and still make contribution to his/her community. The World Health Organization (WHO) estimates that about 20% of Nigerians suffer mental illness with mental disorders accounting for 13% of global burden of disease. Experts have tasked the government on the need to increase its investment in mental health, pass the Mental Health Bill and have a health policy on mental health as practiced internationally. The WHO endorsed mental health as a universal human right and a fundamental goal for health care systems of all countries (WHO, 2005). Unfortunately, mental health systems in many low and middle income countries in Sub-Sahara Africa face challenges in ensuring optimal mental health services, [10].In Nigeria, the issue of mental health has attracted little attention, much less that of undergraduate students. Often undergraduate mental health victims are stigmatized, scorned and neglected by families in the belief that their problem is beyond remedy, so many of them abandon school and are left to wander about on the streets, sleeping under the bridges and causing menace to the society. The question that comes to mind is; how many Universities in Nigeria have an office which deals with mental health, psychological and emotional issues of students? The issues of mental health illness can be nipped at the board, if preventive measures and coping strategies are laid down.The population for this research work is University of Port Harcourt and the data size for this research work was obtained using the stratified sampling scheme, where the departments served as the strata. The total sample size is 706.
2. Ordered Logistic Regression Model
Logistic regression and Ordinary least square (OLS) have the same goal, which is to model a response variable as a function of one or more explanatory variables, the major difference is that OLS requires the response variable to be continuous while logistic regression requires the response variable to be a dichotomous categorical variable. Often there are occasions when the response variable is polychotomous. Such response variable can be classified into two categories-multinomial and ordinal, when the response variable is classified according to their order of magnitude, the multinomial logistic regression cannot be used rather the ordinal/ordered logistic is most appropriate, [11]. Many logistic regression models have been developed for analyzing ordinal response variable. In situations where there are many response variables, a multivariate approach is considered, but for this paper only one response variable is considered with more than two explanatory variables, so the ordered logistic regression is considered. Ordered logistic regression is an extended type of logistic regression where the response categorical variable is ordered into more than two categories. There are several ordered/ordinal logistic regression models such as Proportional Odds Model (POM), Continuous with Restrictions, Stereotype Model etc. Ordinal Logistic regression was originally proposed by [12]. The name cumulative link model is adopted from [1] and it was later changed to proportional Odds model by [9]; [2]. The work focuses on how well the response variable (Mental health state) can be predicted by the answers from questions based on five factors. This research work investigated the effects of these factors on the mental health of undergraduate students using the ordered logistic regression. The response (mental health state) was ordered into three categories. The underlying model for this work is the Proportional odds model. A major assumption underlying ordinal logistic regression is that the relationship between each pair of outcome groups is the same, that is the coefficient that describe the relationship between the lowest versus all the higher categories of the outcome variables are the same as the one that describe the relationship between the next lowest category and all the higher categories etc. This is known as the parallel regression assumption or the proportional odds assumption. To ascertain that the Proportional odds model is appropriate, this assumption must hold.
3. Proportional Odds Model (POM)
The proportional odds model is a special case of the cumulative logit model. It is not based on individual probability of each class, but on the cumulative probabilities of the class considered j and the (j-1) precedent classes [9]. Proportional odds model is a model that allows separated intercepts for the cumulative logit, but restricted the parameter sets of the predictors to be same across all the logits. This model basically compares the probability of a response less than or equal to a given category (j=1,…J-1) to the probability of a response greater than this category. In addition, this model is composed of J-1 parallel linear equations. The model has (J-1) parameters. Let the probability that the response  falls in the j =1,…J category be denoted by πij ie πij = Pr{Yi =j}. We then define the corresponding cumulative probability that the response falls in the jth category or below as;
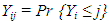 | (1) |
so we have that 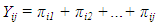 | (2) |
Let g(.) denote a link function mapping probabilities to the real line. The link function is used to transform the cumulative probabilities into linear function of the independent variables. The logit transformation of the cumulative response probabilities  is given by;
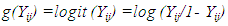 | (3) |
And this equation is assumed to be a linear function of the explanatory variables, thus; the cumulative logit model is given by;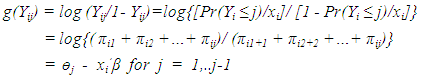 | (4) |
This is called the proportional odds model (POM), where өj is a constant representing the baseline value of the transformed cumulative probability for category j,  is the vector of explanatory variables for the ith observation and β is the corresponding set of regression parameters. The effect of the explanatory variables is either to raise or lower the odds of a response in category j. This model was derived by [12]. Some sources write the cumulative logit model with a plus on the right-hand side, but there is a good reason for the minus. It means that larger the value of xi’β, the higher the probability of the response falling in a category at the upper end of the response scale ie the higher value of the covariates indicates a positive association with the higher value of the response category. For small values of xi’β the response is likely to fall in the low category and for large values xi’β the response is likely to fall in the high category. A key point is that the regression part xi’β is independent of j, so that β has the same effect for each of the j-1 cumulative logits. It is worthy of note that xi’β does not contain an intercept, since the өj (threshold) act as intercepts.Definitions of Terms:The predictor variables are defined thus:× Current_wellbeing:- This we define to mean how the individual perceives him/herself, in terms of being cheerful, relaxed, useful, loved etc.× Current_Concerns:- These are the current concerns of undergraduate students, such as family, relationships, etc.× Concerns on mental health:- This we considered as issues pertaining to someone’s health like suicidal tendencies, seeing a doctor on health matters, attempt to be get better etc.× Mental health Assessment:- This we defined to be mental stability in terms of self-control, attitude to life etc.× Coping Strategies:- This is defined as the measures taken in other to maintain a stable mental health,
4. Methodology
The aim of this research work is to investigate the relationship between the mental health state of undergraduate students and factors that affect the mental health of these students. This research work utilized data gotten from 706 respondents through questionnaire method. We considered a response variable Y (mental health status) with three categories, namely; Stable, Mildly-unstable and Unstable and an explanatory variable  = (x1,x2,…,x5) the vector of explanatory variables (co-variables). The j categories of Y conditional to the values of the co-variables occur with probability π1, π2, …, πj that is πj = Pr(Y = j/x) for j=1,2,…J. In modeling the ordinal response the cumulative probabilities Yij = πi1 + πi2 +…+ πij was considered. Thus this work presents ordinal logistic regression with cumulative probabilities. The explanatory variables for this work includes; current wellbeing, current concerns, concerns on mental health, mental health assessment and mental health coping strategies. The analysis was done using the R software [16]. We made use of the polr command from the MASS package to estimate the ordered logistic regression model. The command name comes from proportional odds logistic regression, highlighting the proportional odds assumption in the model. The assumption was tested using the brant command in R. The goodness of fit test was carried out to ascertain if the model was appropriate.
4.1. Model Presentation and Parameter Estimation
The cumulative logit model for this work is given by;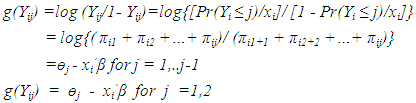 | (5) |
The proportional odds model assumes that the true β values are the same in all the models, since the logit ranges from j to j-1 and we have the response j=3, which gives us two logit models. Therefore the only difference in the models is the intercept term  , j=1,2 and it satisfies the condition
 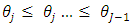 . This means that the estimates of the two ordinal models provide just one set of β estimates. Furthermore β does not depend on j, meaning that the relationship between x and y is independent of the category. By exponentiating the β estimates relative to a given predictor ie taking e β we obtain an estimate of the odds ratio (OR) that describes the relative odds for
  for values of xi differing by one unit. This model is usually estimated using the maximum likelihood. The maximum likelihood of ө is that value that maximizes L(ө) and it is given as:
 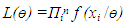 | (7) |
Maximizing this function in eqn(5) is equivalent to maximizing the log likelihood;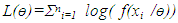 | (8) |
To obtain the estimates of the model, eqn (6) is expanded and differentiated with respect to ө and β and setting the two equations to zero.
4.2. Goodness of Fit Test
Goodness of fit test is used to determine whether the predicted probabilities deviate from the observed in a way that the ordered logistic model cannot predict. If the resulting p-value is less than the chosen significant level, it is concluded that the predicted probabilities deviates from the observed in a way that the model could not predict. This could be as a result of; incorrect link, omitted higher-order term for variables in the model or from the omitted predictor that is not in the model. If the deviation is statistically significant, then a new link function should be sort or the terms in the model will be changed. This test was done using the chi-square test. The chi-square test is based on the difference between the observed and the expected values for each category. The chi square statistic is defined as;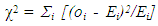 | (9) |
where oi is the observed value of cases in category i, and Ei is the expected value of cases in category i.
5. Results
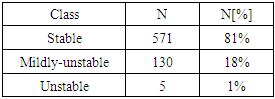
Table 1. The Distribution of the Ordered Multi Class of the Response
 |
| |
|
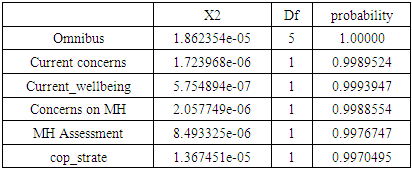
The percentage of stable undergraduate is high which is good, but the concern lies in the 19% that are perceived not to be mentally stable.The brant test was defined by Rollin Brant [3] to test if the parallel regression assumption holds. It was implemented in R under the package and function called brant, this is available on CRAN. The result of the brant test is shown below in table 2.Table 2. Brant Test
 |
| |
|
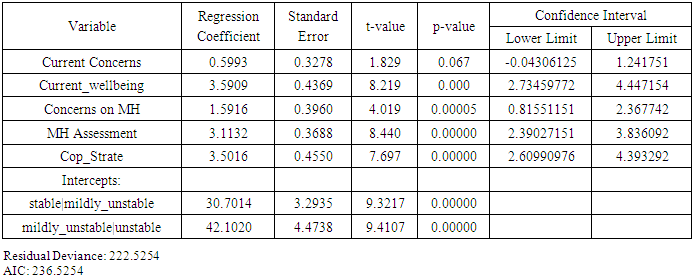
H0: Parallel Regression Assumption holds The tables shows that the parallel regression assumption holds, because all the probabilities show none significance. Table 3. Model Estimates
 |
| |
|
Table 3 above shows the estimates of the model. The table shows that all the variables are significant except the current concerns, and the confidence interval for current concerns also confirms that it is not significant.Thus the logit model is given as; | (10) |
 | (11) |
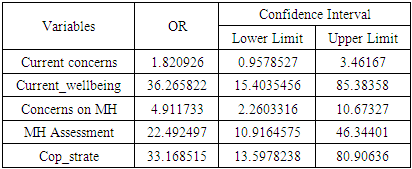
Table 4. Odds Ratio and Confidence Interval
 |
| |
|
6. Discussion
The aim of this research work is to illustrate the use of ordered logistic regression in predicting the mental health status of undergraduate (science) students in University of Port Harcourt, based on five factors. A sample of 706 students was obtained using the stratified random sampling method. The status of the mental health of the students is an ordinal response ordered according to severity of the mental health (stable, mildly unstable and unstable). In the model five covariates are included as risk factors to mental health, namely; current wellbeing, current concerns, concerns on mental health, mental health assessment and coping strategies. The goodness of fit test was carried out and the result shows that the model was a good fit. The results of the regression in table 3 show that all considered variables except current concerns are found to be significant predictors of mental health state; this is also evident looking at its odds compared to other factors. The brant test of proportional odds assumption shown in table 2, show that the assumption holds because the p-values indicated non-significance making an acceptance of the null hypothesis. The Omnius value is for the whole model and the other values are for the individual coefficients. The result of the odds ratio and confidence interval is given in Table 4, the confidence interval for current concerns includes one, which tells us that current concerns is not a significant risk factor on the response or it could be said that it indicates a non-effect on the response, this also confirms what the regression results in table 3 shows. The results in table 4 also show that when the current well-being of the students increase by a unit the odds of mental health state of the student being in an unstable state or mildly-unstable state versus stable state increases by 36.27%, given that any other variable is held constant. Also when the coping strategy increases the odds also increases by 33.16%, we can also observe that increase in the mental health assessment also increases the odds of mental health in unstable or mildly unstable state versus stable state, by 22.49%. A close look at the odds ratio and the regression coefficients makes us conclude that the most influential factors of the mental health is the current well-being of the student, followed by coping strategies and lastly the mental health assessment.
References
| [1] | Agresti A. (2002). Categorical Data Analysis. Wiley, second Edition. |
| [2] | Agresti A. (2007). An Introduction to Categorical Data Analysis, 2nd Edn.; Wiley New York: pp 400. |
| [3] | Brant, R. (1990). Assessing Proportionality in the Proportional Odds Model for Ordinal Logistic Regression. Biometrics 46, 1171-1178. |
| [4] | Chandra Sekhara O. R & Alemayehu E (2015). Ordinal Logistic regression analysis to assess the factors that affect health status of students in Ambo University: a case of natural and computational sciences college Ambo University. International Journal of Modern Chemistry and Applied Science, 2 (3), pp153-163. |
| [5] | Clareci S. C., Waleska T. C., Arminda L. S. and Mery N. S., (2008). Ordinal Logistic Regression Models: Application in quality of life Studies. https://www.researchgate.net. |
| [6] | Rune H. B. C. (2015). Analysis of Ordinal Data with Cumulative Link Models-Estimation with the R-package ordinal. |
| [7] | Citko D., Milewska A. J., Wasilewska J. and Kaczmarski M. (2012). Ordinal logistic regression for the Analysis of skin test reactivity to common aeroallergens. Studies in Logic, Grammer And Rhetoric, 29(42). |
| [8] | Fuller A.S (2009). A conceptual framework for ordered logistic regression models. Sociological Methods & Research, 38: 306-347. |
| [9] | McCullagh P (1980). Regression Model for Ordinal Data; Journal of Royal Statistical Society Series B 42(2): 109-142. |
| [10] | Saraceno B., Ommeren V. M, Batniji R., Cohen A., Gureje O., Mahoney J., Sridhar D.& Underhill C. (2007). Barriers to Improvement of Mental Health Services in Low-Income and Middle-Income Countries; Global Mental Health, Series, Vol 370 (9593), pp1164-1174. |
| [11] | Sumonkanti D. and Rahman R. M. (2011). Application of ordinal logistic regression analysis in determining risk factor of child malnutrition in Bangladish. Nutritional Journal 2011, 10:124. |
| [12] | Walker SH and Duncan D. B (1967). Estimation of the Probability of an Event as Function of Several Independent Variables, Biometrika 54:167-168. |
| [13] | www.cheld.org/mental-health-care-i, Mental Health Care in Nigeria: Has the time come? |
| [14] | www.https://stats.idre.ucla.edu: Ordinal Logistic Regression in R, Institute for Digital Research and Education. |
| [15] | www.data.princeton.edu/wws509/notes/c6s5.html: Generalized Linear Models by German Rodrigues. |
| [16] | www.rdrr.io>CRAN>MASS. Polr: Ordered Logistic or Probit Regression in MASS. |

 Abstract
 Reference
 Full-Text PDF
 Full-text HTML