Iwundu M. P., Anyanwu C. O.
Department of Mathematics and Statistics, University of Port Harcourt, Nigeria
Correspondence to: Iwundu M. P., Department of Mathematics and Statistics, University of Port Harcourt, Nigeria.
| Email: |  |
Copyright © 2018 The Author(s). Published by Scientific & Academic Publishing.
This work is licensed under the Creative Commons Attribution International License (CC BY).
http://creativecommons.org/licenses/by/4.0/

Abstract
Categorical data, having no underlying metric, are frequently encountered in experimental situations. Analysis of such data deviates from the usual methods involving continuous-type data. In this paper, the significance of main factor (Geo-political Zones) and sub-factor (States) are studied using categorical data in nested arrangements. The CATANOVA technique used is suitable for mixed design, having some factors crossed and others nested. Consideration is made for frequency data involving National Examination Council (NECO) and West African Examination Council (WAEC), from 2003 to 2010. Numerical results show that the main factor, Geo-political Zone and the sub-factor, States, are significant having p-value of less than 0.00001 in each case.
Keywords:
Categorical data, Categorical Analysis of Variance, Crossed factor, Nested factor, Main effects, Sub-factor effects
Cite this paper: Iwundu M. P., Anyanwu C. O., An Application of Categorical Analysis of Variance in Nested Arrangements, International Journal of Probability and Statistics , Vol. 7 No. 3, 2018, pp. 67-81. doi: 10.5923/j.ijps.20180703.02.
1. Introduction
According to Agresti (2007), categorical data analysis deals with data that classify an observation into one or more categories. Two main types of categorical variables involves are variables whose data are on nominal or ordinal scale of measurement. By nominal scale, we refer to a discrete classification of data, in which data are neither measured nor ordered but subjects are merely allocated to distinct categories. Nominal scales are used merely for labelling variables, without any quantitative value, to identify or classify the objects. Quantitative data in the case of nominal categorical variables refer to discrete data otherwise called frequency data. Nominal variable yields unordered qualitative variable and possesses no inherent ordering or nominal distance between categories. In other words, the order of listing the categories is not important. According to Weiss (2009), nominal data are inherently less informative than quantitative data, it does not convey information about the magnitude of differences and it is not also clear on how to deal with missing data. Categorical variables having ordered scales are ordinal variables. Ordinal variables give rise to natural ordering. It is common sometimes to use numerical values to denote the ordering information in an ordinal variable. However, numerical variables corresponding to categories of ordinal variables only show the ranking order in a particular attribute. A number of researchers have displayed categorical variable in a 2 x 2 contingency table or by cross classification. Cross-classified data are viewed as when subjects are classified by two or more types of clusters, but the clusters are not hierarchical or nested within one another. As is commonly seen, many data sets come in the form of counts of individuals, classified into one of a finite set of disjoint categories. The data consist of the numbers of observations falling into each category. Thus, two factors are crossed when every category of one factor occurs in the design with every category of the other factor. In other words, there is at least one observation in every combination of categories for the two factors. On the other hand, a factor is nested within another factor when each category of the first factor co-occurs with only one category of the other factors. In other words, an observation has to be within one category of say Factor 2 in order to have a specific category of Factor 1. One of the simplest categorical data analyses involving nominal data in cross classification requires checking whether the categorical variables are independent. Another includes goodness of fits tests, where observed and expected frequencies are compared. Yet another area of interest where categorical data analysis is implored, particularly in medical fields, is in prospective, retrospective and cross-sectional studies, aimed at comparing incidence of diseases. As in any inferential study, estimation of parameters and test of hypothesis are key aspects to categorical analysis. Although most encountered data arrangements make use of cross-classification, in real life situation, some data are in nested arrangement. Hence, multi-factor studies can involve treatment combinations in which some factors are crossed with other factors, and some factors are nested within other factors. The need for nesting of factors arises when an experimental situations requires that unique levels of one factor occur within each level of a second factor. Researchers are faced with the problem of developing useful methods for analysing categorical data. Although methods for analysing quantitative (continuous) variables are vast, the assumptions are completely different when the data structure is non-quantitative. This puts a big restriction on the use of such techniques for categorical data. Due to the seeming complexity with categorical data, many inferential problems still remain unanswered when considering nominal categorical data. The aim of this paper is to illustrate the analysis of variance of categorical data involving frequency data in nested arrangement, using performance of students examinations conducted by National Examination Council (NECO) and West Africa Examination Council (WAEC). The main factor shall be the Geo-political Zones and the sub-factor shall be the States. The objectives of this study include1. Assessing the significance of the main factor. 2. Assessing the significance of the sub-factor. In all cases, investigation shall be gender-based (sex) and Period-based or Duration-base (year of examination).Many literatures have shown the existence of several techniques for analysing data in contingency table. Some group of researchers deal with categorical data in their original format while a second group of researchers transform categorical data to enable the data be treated with existing methods for quantitative data. For instance, Winsor (1948) introduced logit transformation for factorial analysis of multiple dichotomous data. Cochran (1950) while considering comparison of percentages in matched samples suggested assigning values of 0 or 1 to represent the responses in the two categories. Dyke and Patterson (1952) provided a method for the case in which the data are proportions, applicable whether the numbers of observations are equal or not. The data are subjected to logit transformation such that in the new scale of measurements observations can reasonably be represented as linear functions of a number of parameters. Gart and Zweifel (1967) extended the technique of Dyke and Patterson (1952) by introducing weighting function for a special case of dichotomous data. Light and Margolin (1971) reported the measure of variations for categorical data and developed a general approach of analysis of variance for a one-way table with categorical response. The general approach to categorical data proposed by Light and Moagolin (1971) started with the computation of the total variation in the data and then partitioning this variation into specific components. The distributions of the various components are derived using a multinomial model. Onukogu (1985a) studied the effect of specification such as random, fixed and mixed models on test for significance of factors in a CATANOVA. A linear additive model for a two-way classification was proposed, hence establishing a strong link between Analysis of variance (ANOVA) and Categorical Analysis of variance (CATANOVA). Onukogu (1985a) obtained an F-test for main effects as well as estimate of missing responses and adjusted row and column effects for balanced incomplete designs. Transformation such as log-linear and logit were not necessary rather data were analysed using their original format. According to Onukogu (1985b), a two-way ANOVA with quantal responses is equivalent to a three-way contingency table in which one of the classifications is treated as responses to the other two classifications. Knowing that sum of square in ANOVA is viewed as the departure of individual observations from their mean which is not helpful in the case of nominal data since mean is an undefined concept, Onukogu (1985b) reported that one of the hard nut to crack in any analysis of variance of categorical data is the definition and computation of sum of squares. However, he viewed sum of square (SS) of a set of data as the trace of its variance-covariance matrix. Singh (1996) obtained the adjusted sum of squares for rows and columns with restriction to situation where interaction is absent. He used the one moment approximation to derive the asymptotic null distribution of the test statistic as used by Light and Margolin (1971) and Onukogu (1985a,b).It is believed that categorical outcomes can be analysed using ANOVA technique if the arcsine-squre-root logit transformation is applied according to Cochran (1940), Rao (1960), Winer et al (1971). However, Florian (2008) argued that the use of ANOVA for the analysis of categorical data is misleading as with ANOVA over arcsine-square-root transformation, proportions of categorical outcomes can lead to spurious null result and spurious significances which go beyond normal chance of type I and type II error. Singh (2004) studied the validity of the existing CATANOVA method to analyse the nominal data for single and multi-group repeated measure designs and developed a modified test for single and multiple-repeated measure design.Florian (2008) introduced ordinary logit model, though unfortunately, ordinary logit model do not included random effect modeling. However, Florian described a missed logit model (i.e. a generalized linear model) to address the issue, but these models are considered to be too complicated for analytical evaluations. Fortunately, logit model are built into statistical software such as package R thereby reducing computational rigor. Weiss (2009) presented a method for analyzing nominal responses using fractional design with the goal of allowing the analytic power afforded by fractional designs to be extended to studies in which nominal responses are the natural way to express a person’s action or opinions. According to Weiss (2009) nominal responses in the usual sense do not exhibit variance, since there is no metric that can support measure of distance. As in Weiss (2009), nobody can say how much two nominal variable differ, but it is possible to apply the concept of disparity between variable since two variables will either match or do not match. Onukogu (2014) provided the analytical tools for mixed design when some factors may be crossed while other are nested. In the technique, frequency data are analysed in their original format, without the need for any transformation. The work provides a CATANOVA method for testing for the significance of nested factors. In his study, a breakdown was given of the total observed variation into independent sources such that the effect of each factor can be tested and concluded separately.
2. Methodology
The data for this research work involve m-way contingency table in which one of the classifications may be viewed as response to the others as in Onukogu (1985b). The m-way contingency table is equivalent to an (m-1)-way CATANOVA. Throughout this work, frequency data involving the performance of students in senior category Examinations conducted by West African Examination council (WAEC) and National Examination Council (NECO) for the period of 2003 to 2010 are employed. The data satisfy the general layout for Categorical data in nested arrangement as presented in Onukogu (2014). Geopolitical Zones and States shall respectively form the main factor and the sub-factor. The performance in the examination shall be viewed as (i) Gender-based and (ii) Duration or Time-based.The two-way Categorical analysis of variance in a nested arrangement due to Onukogu (2014) is adopted for this research. We assume no loss in generality using the method, for unequal levels of sub-factor that do not differ significantly. However, for computational ease, the average of the sub-factor levels shall be employed. The layout for the two-way CATANOVA nested classification is presented in Figure 1 as follows;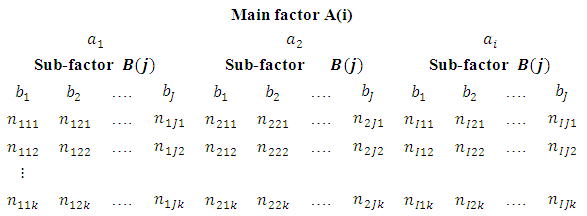 | Figure 1. Layout of two-way CATANOVA nested classification |
In Figure 1, factor A and factor B have 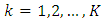 responses per unit where factor A has
  levels and factor B has
  levels. The cell totals are such that
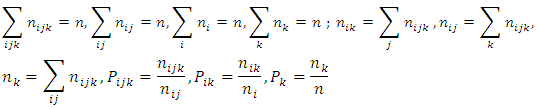 The statistical model for the two-way nested classification for the Categorical data is the three- component model.
 | (1) |
where  is a constant for the
  response
 is the effect of the
  level of factor A
 is the effect of the
  level of factor B within the
  level of factor A.The fundamental assumptions in Categorical analysis of variance are associated with statistical distributions, statistical independence and constant variance. It is general to assume multinomial probability model given by
 where
where 

 is binomial with probability
  The covariance is given as
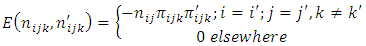 The variance is given as
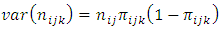 More details regarding the assumptions may be seen in the literature used in this work. The two hypotheses considered in a nested classification, given that the data are enumerative, are;
 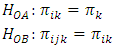 The interpretation of the statistical statement in
  is that there is no main factor effect. In a similar way, the interpretation of the statistical statement in
  is that there is no sub-factor effect.Let the model be;
 | (2) |
 | (3) |
 is a constant for the
  response
 is the effect of the
  level of factor A
 is the effect of the
  level of factor B within the
  level of factor A.Equating (2) and (3) gives
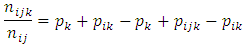 Squaring both sides
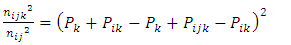 | (4) |
Multiplying both sides by  gives
gives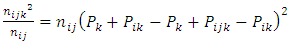 | (5) |
Taking summation over both sides yields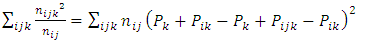 | (6) |
This implies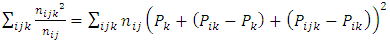 | (7) |
This implies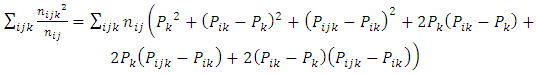 | (8) |
Since 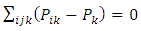 and
and 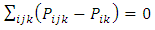 , (Onukogu; 2014)
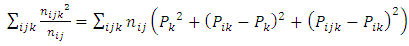 | (9) |
Expanding (9) gives | (10) |
which results in  | (11) |
By rearrangement, we have | (12) |
Adding n to both sides gives | (13) |
Equation (13) is a partition of the sum of squares. Thus 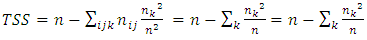 | (14) |
 | (15) |
 | (16) |
 | (17) |
If we let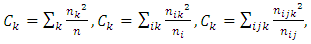 then
then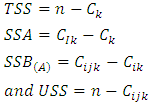 The total sum of squares (TSS) has
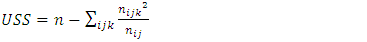
  degree of freedom. The unit of sum of squares (USS) has
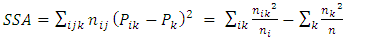
  degrees of freedom. The sum of squares (SSA) of factor A has
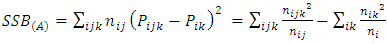
  degrees of freedom. The sum of squares
  of the sub-factor B has
  degrees of freedom.It has been shown in Onukogu (2014) that as
  tends to infinity,
  and
and  have approximate Chi-square distributions with
 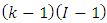 and
and 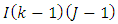 degress of freedom respectively. Hence in testing the hypothesis about the main factor effects, the test statistics is
 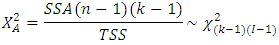 Also, in testing the hypothesis about the sub-factor effects, the test statistics is
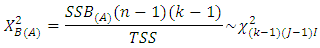 provided that TSS is independent of
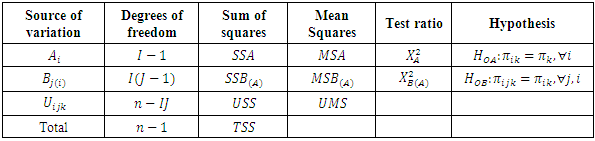
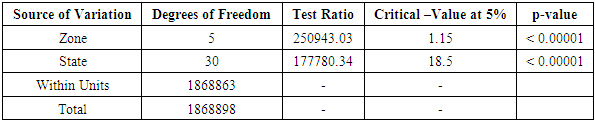
  Further details on asymptotic distribution may be seen in Onukogu (2014).The CATANOVA table is summarized in Table 2.1.
Table 2.1. CATANOVA table for significance of effects
 |
| |
|
3. Results
With reference to the two-way nested classification for NECO 2003 in Appendix 1, the components of the sums of squares are computed as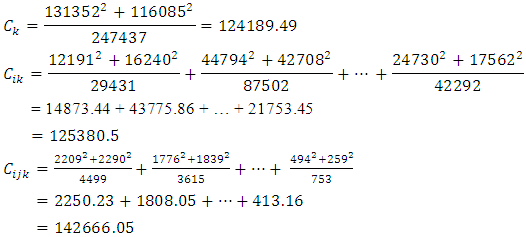 The respective sums of squares are
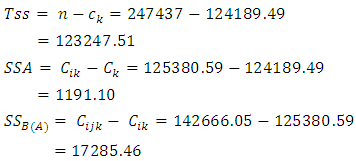 The test statistic for assessing the significance of main factor effect is computed as
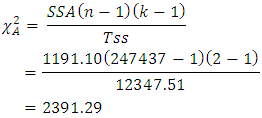 The test statistics for assessing the significance of sub-main factor effect is computed as
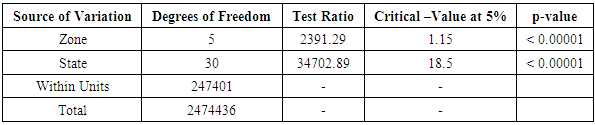
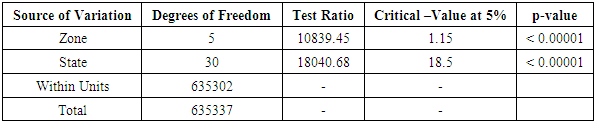
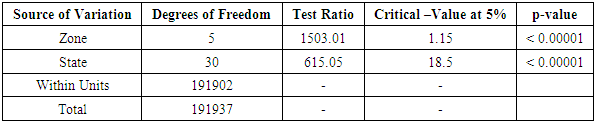
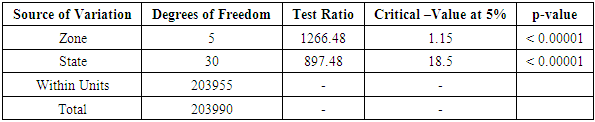
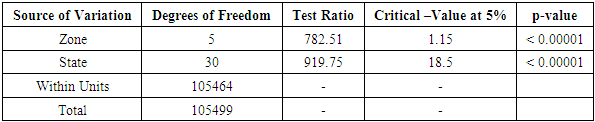
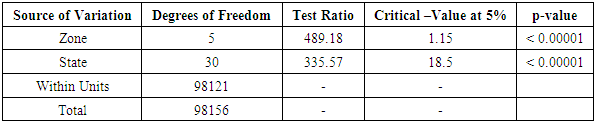
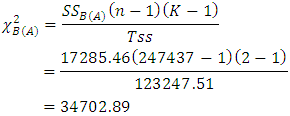 The CATANOVA Table for the partitioning of sums of squares and testing relevant hypotheses is as in Table 3.2.
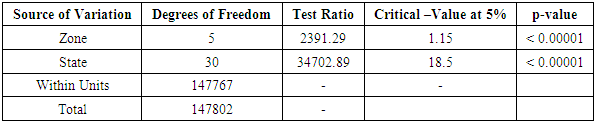
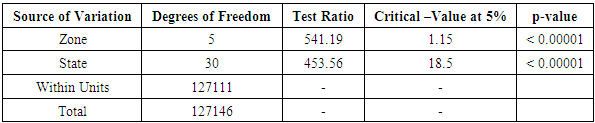
 Table 3.2. CATANOVA Table for NECO 2003
 |
| |
|
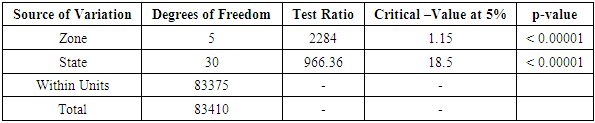
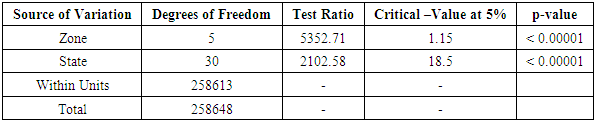
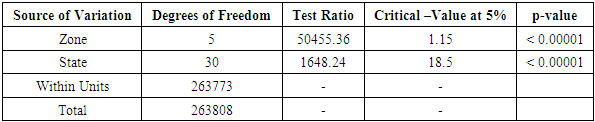
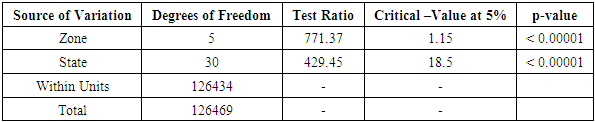
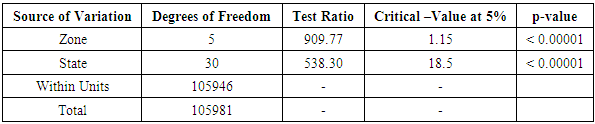
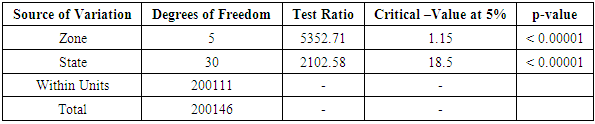
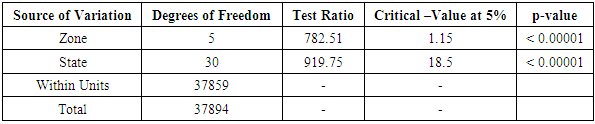
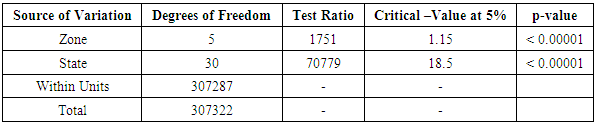
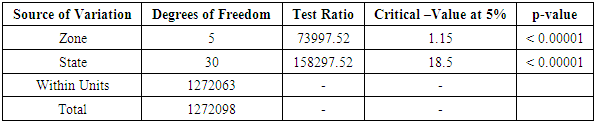
With reference to Appendices 1-4, the computational requirements for the nested data arrangements are summarized in CATANOVA Tables 3.3-3.19.Table 3.3. CATANOVA Table for NECO 2004
 |
| |
|
Table 3.4. CATANOVA Table for NECO 2005
 |
| |
|
Table 3.5. CATANOVA Table for NECO 2006
 |
| |
|
Table 3.6. CATANOVA Table for NECO 2007
 |
| |
|
Table 3.7. CATANOVA Table for NECO 2008
 |
| |
|
Table 3.8. CATANOVA Table for NECO 2009
 |
| |
|
Table 3.9. CATANOVA Table for NECO 2010
 |
| |
|
Table 3.10. CATANOVA Table for WAEC 2003
 |
| |
|
Table 3.11. CATANOVA Table for WAEC 2004
 |
| |
|
Table 3.12. CATANOVA Table for WAEC 2005
 |
| |
|
Table 3.13. CATANOVA Table for WAEC 2006
 |
| |
|
Table 3.14. CATANOVA Table for WAEC 2007
 |
| |
|
Table 3.15. CATANOVA Table for WAEC 2008
 |
| |
|
Table 3.16. CATANOVA Table for WAEC 2009
 |
| |
|
Table 3.17. CATANOVA Table for WAEC 2010
 |
| |
|
Table 3.18. CATANOVA Table for WAEC (Duration-based)
 |
| |
|
Table 3.19. CATANOVA Table for NECO (Duration-based)
 |
| |
|
4. Discussion of Results
CATANOVA for data in nested arrangements has been applied in studying the significance of performance in WAEC and NECO. The need for nesting of factors arises when an experimental situation requires that unique levels of one factor occur within each level of a second factor. Two-way nesting due to Onukogu (2014) was considered where Geopolitical Zone served as the main factor and State served as the sub-factor. In one instance, Gender was viewed as the “response” factor, having two levels. In another instance, “Duration of Examination” was viewed as the “response” factor, having eight levels. Six levels of Geopolitical Zone were considered. Although the States within each Geopolitical Zone are not constant, thus creating imbalance to sub-factor levels, an average of sub-factor levels was used throughout the research. It is assumed that for large sample size, the CATANOVA technique employed is robust against slight imbalance in sub-factor levels. In examining the performances in WAEC and NECO in relation to Geopolitical Zones and States within Zones, two aspects, namely, Gender-based assessment and Duration-based assessment were considered. The categorical data analysis revealed significant difference in the performance of students in WAEC and NECO within the Geo-political Zones (main factor) and the States (sub-factor). The p-value for each test revealed that the test is significant at an Observed Significance Level (OSL) less than 0.00001. When sub-factor levels, nested within the main factor, are not constant, an average of sub-factor levels may be used in the analysis of the data having unbalanced structure, particularly if the sub-factor levels are not grossly different and if the sample size is large.
5. Conclusions
Frequency data are increasingly encountered in real-life situations. Unfortunately, some of such data have been erroneously analysed without the consciousness that there is no underlying metric with such data. Fortunately, attention is gradually being drawn to the need for methods of handling frequency (count, categorical or nominal) data. In this work, an application of categorical analysis of variance has been presented for data in nested arrangement, in view of establishing the significance of main factor and sub-factor effects. It provides a practical guide for determining the significance of categorical factors when data are in nested arrangements.
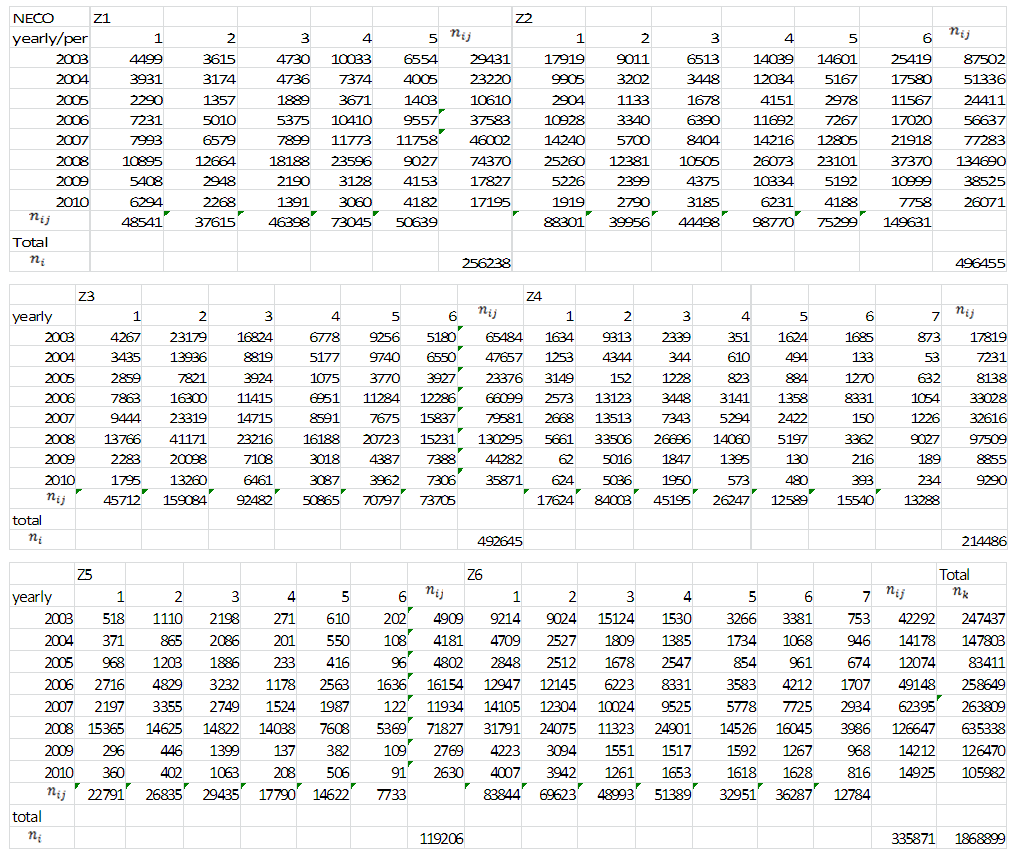
Appendix 1: Two-way Nested Classification for NECO (Gender-based)
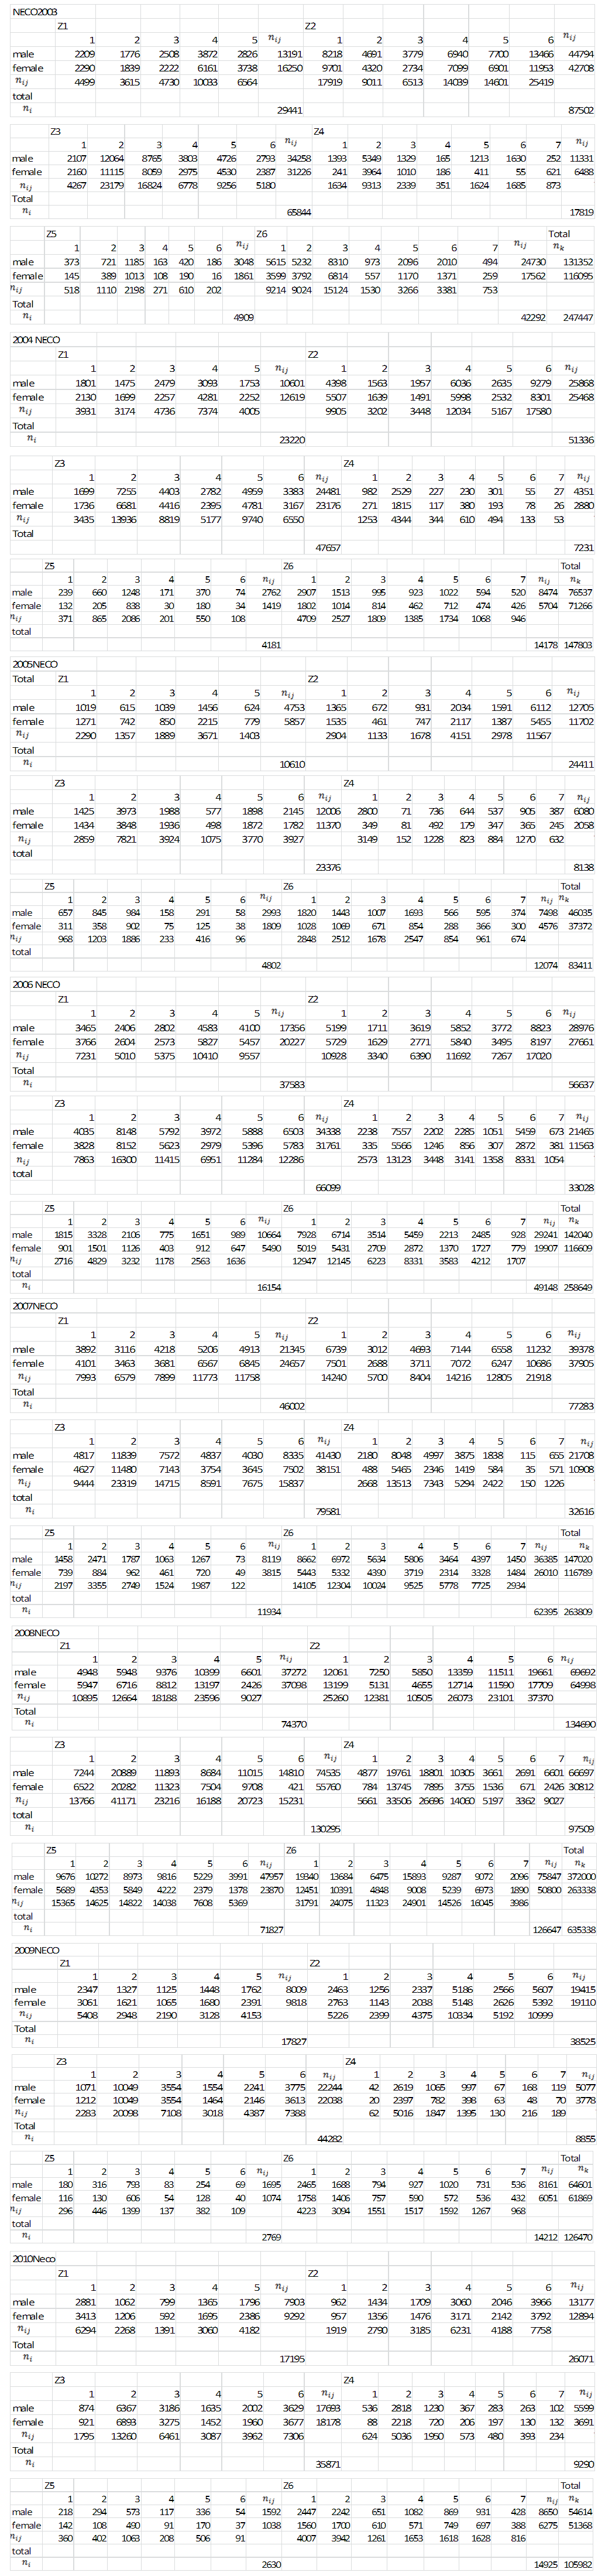 | Appendix 1 |
Appendix 2: Two-way Nested Classification for WAEC (Gender-based)
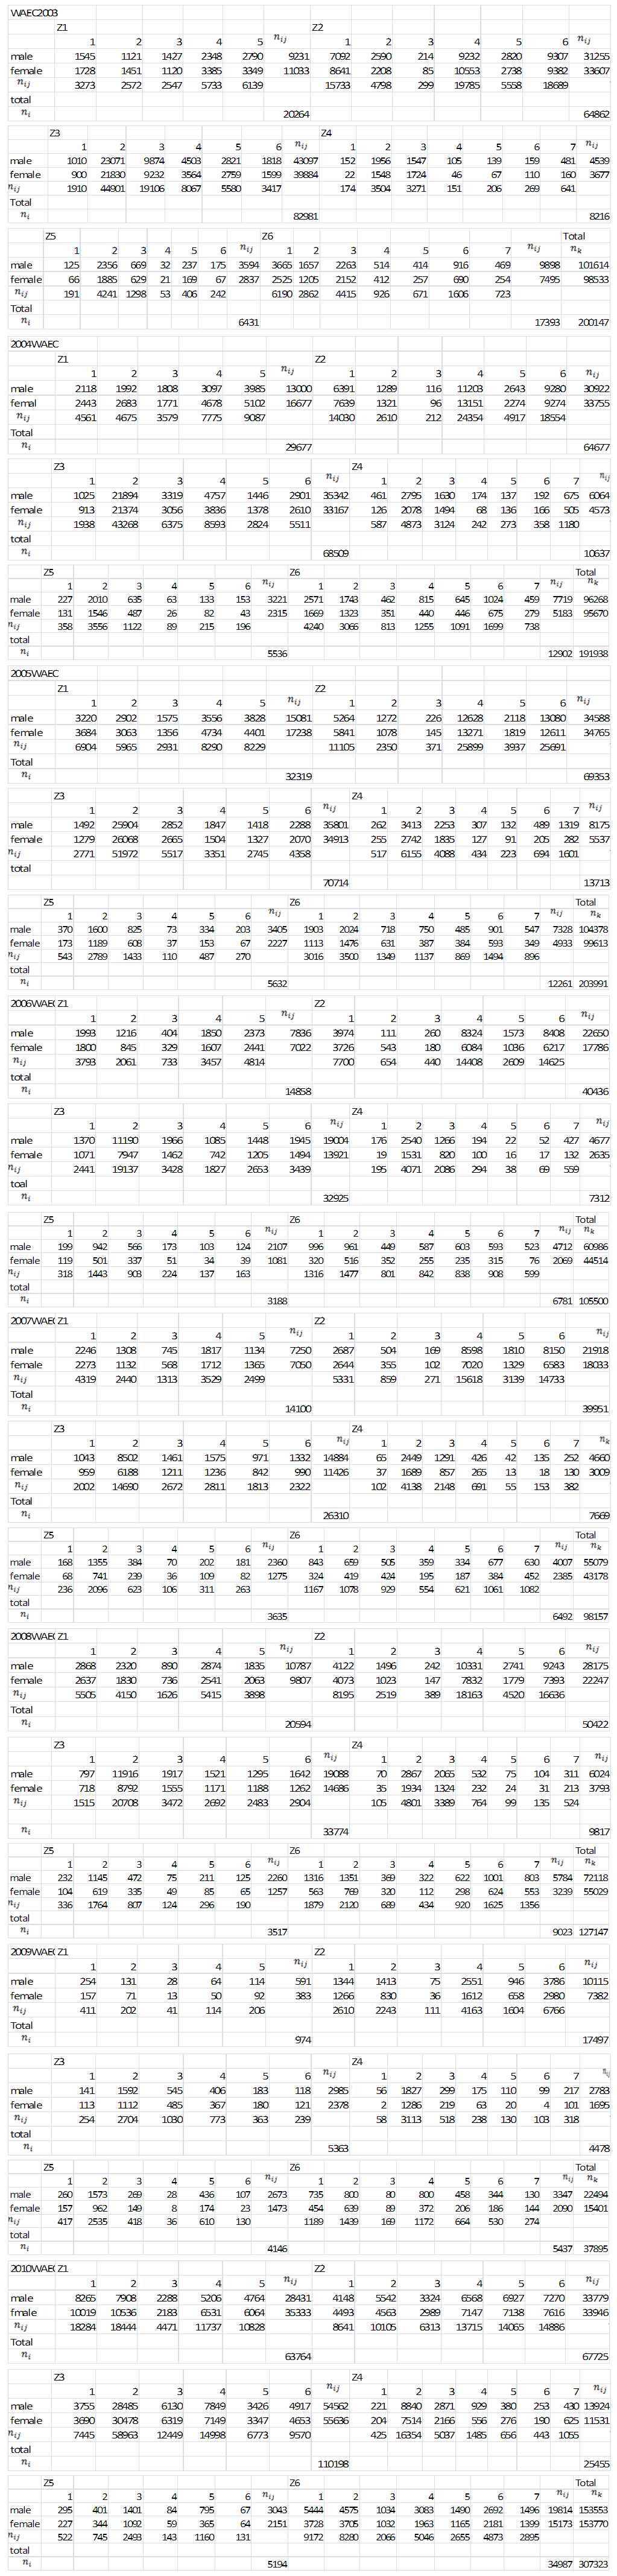 | Appendix 2 |
Appendix 3: Two-way Nested Classification for WAEC (Duration-based)
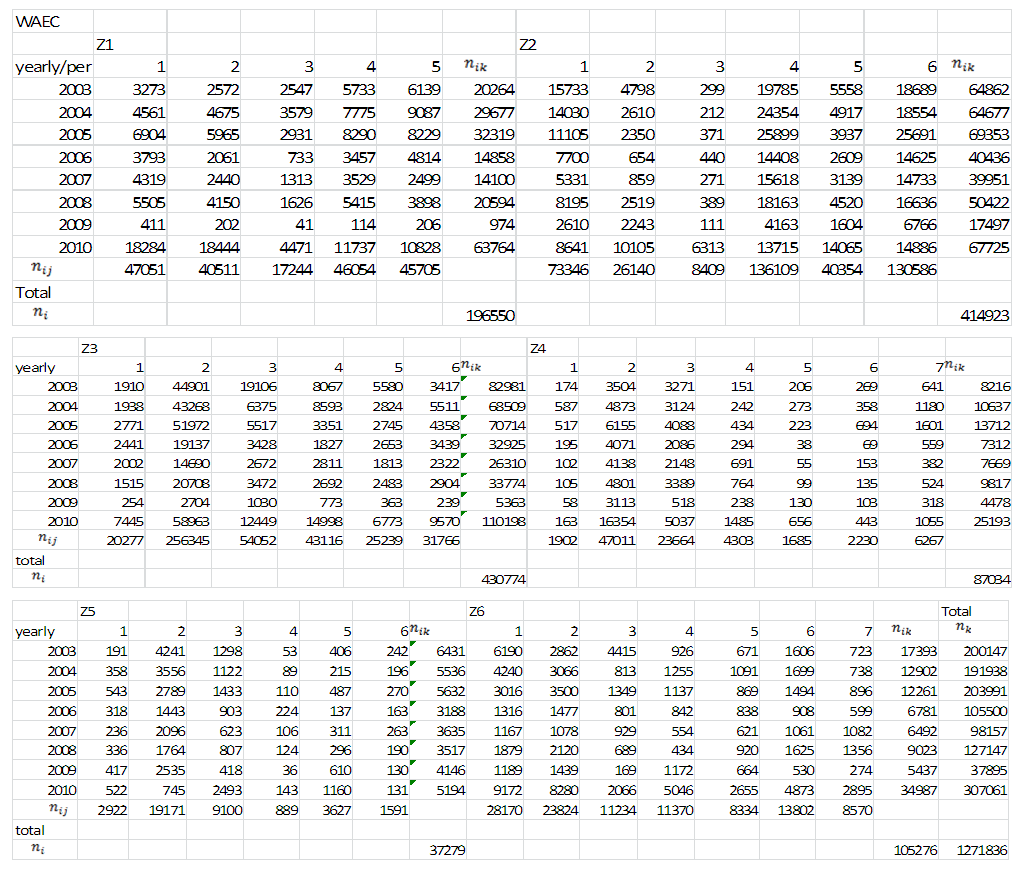 | Appendix 3 |
Appendix 4: Two-way Nested Classification for NECO (Duration-based)
 | Appendix 4 |
References
| [1] | Agresti, A. (2007). Categorical data analysis. New York: Wiley Interscience. |
| [2] | Cochran W. G. (1940). The analysis of variances when experimental errors follow the Poisson or binomial laws. The Annals of Mathematical Statistics, II, 335-347. |
| [3] | Cochran, W. G (1950). “The comparison of percentages in matched samples,” Biometrika, 37: 256-55. |
| [4] | Dyke, G. V. and Patterson, H. D. (1952). Analysis of factorial arrangements when the data are proportions. Biometrics, 8, 1-12. |
| [5] | Florian T. J. (2008). Categorical data analysis: Away from ANOVAs (transformation or not) and towards logit mixed models. Journals of memory and Language 59, 434-446. |
| [6] | Gart, J. J. and Zweifel, J. R. (1967). “On the bias of various estimators of the logit and its variance with applications to quantal bioassay,” Biometrika, 52, 181-7. |
| [7] | Light, R. J. and Margolin, B. H. (1971). An analysis of variance for categorical data. Journal of the American Statistical Association, 66: 534-544. |
| [8] | Onukogu, I. B. (1985a). Reasoning by Analogy from ANOVA to CATANOVA. Biom. Journal, 27: 839-849. |
| [9] | Onukogu, I. B. (1985b). An analysis of variance of nominal data. Biom. Journal, 27: 375-383. |
| [10] | Onukogu I. B. (2014). Analysis of variance of Categorical data-Nested Designs. Journal of Statistics: Advances in Theory and Aplications 12: 109-116. |
| [11] | Rao, M. M. (1960). Some asymptotic results on transformations in the analysis of variance. ARL Technical Note. 60-126. Aerospace research laboratory, Wright-Patterson Air Force Base. |
| [12] | Singh, B. (1996). On CATANOVA method for analysis of two-way classified nominal data. Sankhya, B58(3), 379-388. |
| [13] | Singh, B. (2004). CATANOVA for analysis of nominal data from Repeated Measures Design J.ind.Soc. Agril. Statist. 58(3): 257-268. |
| [14] | Weiss, D. J. (2009). Nominal analysis of “variance” Behavior Research Methods, 41(3), 901-908. |
| [15] | Winer, B. J., Brown, D. R., and Michel, K. M. (1971). Statistical principles in experimental design. New York: Graw-Hill. |
| [16] | Winsor, C. P. (1948). Factorial Analysis of a multiple dichotomy. Human Biology. 20: 195-204. |

 Abstract
 Reference
 Full-Text PDF
 Full-text HTML