-
Paper Information
- Next Paper
- Paper Submission
-
Journal Information
- About This Journal
- Editorial Board
- Current Issue
- Archive
- Author Guidelines
- Contact Us
International Journal of Probability and Statistics
p-ISSN: 2168-4871 e-ISSN: 2168-4863
2018; 7(2): 44-50
doi:10.5923/j.ijps.20180702.02

Using the Zero Inflated Negative Binomial Model to assess Factors Associated with Occurrence of Childhood Pneumonia
 Abstract
 Reference
 Full-Text PDF
 Full-text HTML
Oyindamola B. Yusuf1, Onoja M. Akpa1, Kehinde P. Akinpelu2, Abass O. Gbolahan3
1Department of Epidemiology and Medical Statistics, Faculty of Public Health, College of Medicine, University of Ibadan, Nigeria
2Infectious Disease Institute, College of Medicine, University of Ibadan, Ibadan, Nigeria
3Department of Planning, Research and Statistics, Oyo State Ministry of Health, Nigeria
Correspondence to: Onoja M. Akpa, Department of Epidemiology and Medical Statistics, Faculty of Public Health, College of Medicine, University of Ibadan, Nigeria.
| Email: |  |
This work is licensed under the Creative Commons Attribution International License (CC BY).
http://creativecommons.org/licenses/by/4.0/

The present study was intended to model the number of cases of childhood pneumonia using zero inflated negative binomial (ZINB) regression which accounts for both excess zeros and over dispersion. Data on childhood pneumonia was obtained from the Integrated Disease Surveillance and Response (IDSR) of the State Ministry of Health for the period: 2010 - 2014. Over-dispersion was ascertained using the mean and variance. Incidence per year was determined. The ZINB model was fitted, and incidence rate ratios with their 95% CI were determined. Goodness of fit was assessed using the Vuong z-statistic criteria. There was an initial rise and a subsequent decline in the incidence of childhood pneumonia cases; 7 per 1000 in 2012 and 0.5 per 1000 in 2014. The risk of childhood pneumonia was lowest in 2011 (IRR = 0.24, 95% CI: 0.15, 0.38) with a slight increase in 2014 (IRR= 0.17, 95% CI: 0.09, 0.32). The Vuong z-statistic was -7.952 (i.e. V < -1.96). The zero inflated negative binomial model yielded optimal results in modeling the number of cases of childhood pneumonia when there is an indication of over dispersion and excess zeros.
Keywords: Over-dispersion, Childhood Pneumonia, Zero inflated negative binomial regression
Cite this paper: Oyindamola B. Yusuf, Onoja M. Akpa, Kehinde P. Akinpelu, Abass O. Gbolahan, Using the Zero Inflated Negative Binomial Model to assess Factors Associated with Occurrence of Childhood Pneumonia, International Journal of Probability and Statistics , Vol. 7 No. 2, 2018, pp. 44-50. doi: 10.5923/j.ijps.20180702.02.
Article Outline
1. Introduction
- In the analysis of count data, there are situations where there are an excessive number of individuals with a count of zero. The poisson model generally known for count data may not be appropriate because it assumes that the conditional variance of the dependent variable is equal to the conditional mean and so it will give a poor fit. Zero inflated models have been developed to accommodate for this scenario. The zero inflated poisson model (ZIP) allows for overdispersion but does not cater for these excess zeros. However, the zero inflated negative binomial model (ZINB) fits better because it allows for overdispersion and also excessive zeros.The rationale behind zero-inflated count modelling is that real-life data are usually prone to over-dispersion and excess zeros and they adjust well to data from a particular mixture of two populations; one that has only zero counts and another in which the counts are the realizations of a discrete distribution [1]. The ZINB model deals with both over-dispersed and zero inflated data by assuming there are two distinct data generating processes. The result of a Bernoulli trial is used to determine which of the two processes is used. The ZINB regression model has been applied to human microbiota sequence data with random effects. The results revealed that the simulation study used indicated that the method of estimation gave unbiased results for both fixed effects and random effects [2]. The theoretical distribution of ZIP and ZINB has been extensively reviewed and reported by several authors [2-4].Pneumonia being the most common clinical manifestation of pneumococcal infection remains a childhood disease in developing countries such as Nigeria, with high morbidity rates [5] Pneumonia deaths is also the commonest cause of under-5 mortality in Nigeria. The disease morbidity is usually presented as count data such as number of cases with the disease. The methods of analysis of such count data may however pose a problem when extra zeros in the count dataset remain unaccounted for. This may subsequently result in biased parameter estimates, low power, loss of information to detect a covariate effect and ultimately wrong inferences. Hence, the use of ZINB models to analyze such data which helps to overcome the problems of underestimation of parameters, account for over-dispersion and improve inferences. Therefore we determined factors associated with number of cases of Pneumonia in south west Nigeria.
2. Study Design and Population
- Data (2010 to 2014) on Pneumonia in childhood was obtained from the database of the Integrated Diseases Surveillance and Response (IDSR) at the Oyo State Ministry of Health, Nigeria. The records were outpatients and inpatients presenting with pneumonia at the 764 health facilities in the 33 LGAs in Oyo state.
3. Data Management
- Data on 1,980 reported cases of children with pneumonia aged 0-59months from 2010 to 2014 were used. Information on the LGA of domicile, month and year of infection were also extracted as explanatory variables in the analysis. Age was categorized as 0-28days – 40years and above.Descriptive statistics including mean and standard deviation (SD) were computed to check for the presence of over-dispersion. The pattern of pneumonia in childhood for the 5 years in the 33 local government areas was presented using charts. The zero inflated negative binomial model and the zero inflated poisson regression model were fitted. The effect of season, (defined as month of reporting) years and the geographical location (determined by the 33 local government areas) on the occurrence of Pneumonia was determined. The Maximum likelihood technique was used to estimate the parameters of the model using the logit function. Incidence rate ratios (IRR), 95% CI and their p-values were reported.The number of reported cases of childhood pneumonia would be zero-inflated by those months when no child was infected with pneumonia or those months when though children were infected, cases were not reported in any health facility in the given LGA. In this regard, the Zero-inflated Negative Binomial (ZINB) model was more appropriate due to the presence of zeros and over dispersion in the data.
4. Results
- Descriptive statistics of number of cases of childhood pneumoniaTable 2 below shows the descriptive statistics of cases of childhood pneumonia from 2010 to 2014. The dataset consists of a large number of zero cases (1371, 69.0%) and non-zeros (609, 31.0%). The mean number of cases was 8.69, the variance was 1865.203, the minimum number was 0 and the maximum number was 544.The Distribution and pattern of reported cases of childhood pneumonia.The number of zeros in the reported cases of pneumonia was 69% (Figure 1).Incidence of pneumonia cases was highest in 2012; 7 per 1000 and decreased till 2014(0.5 per 1000) (Figure 2).
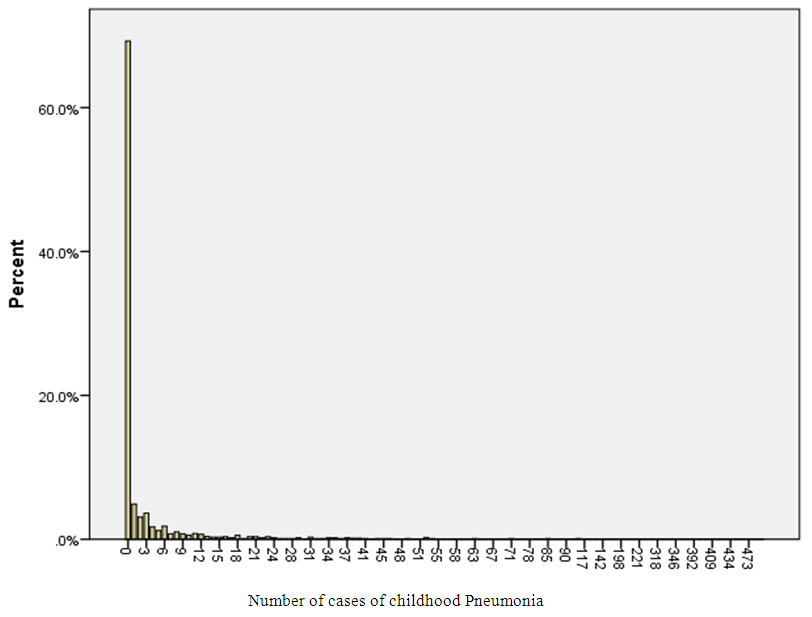 | Figure 1. Distribution of Childhood Pneumonia cases in 2010 to 2014 |
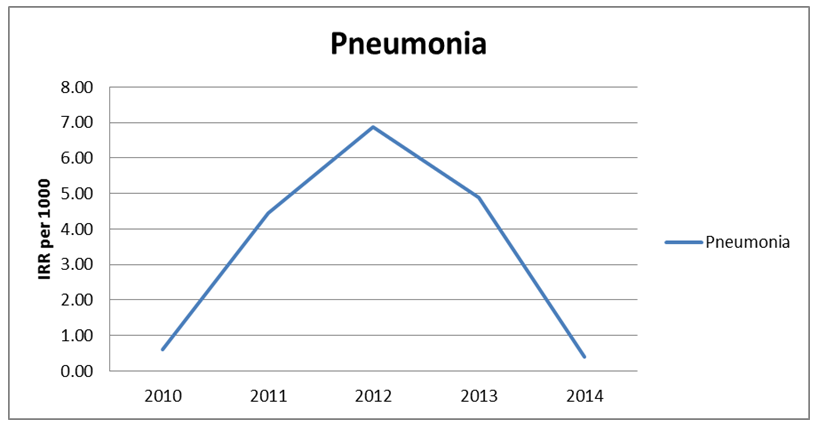 | Figure 2. Pattern of childhood pneumonia 2010 to 2014 |
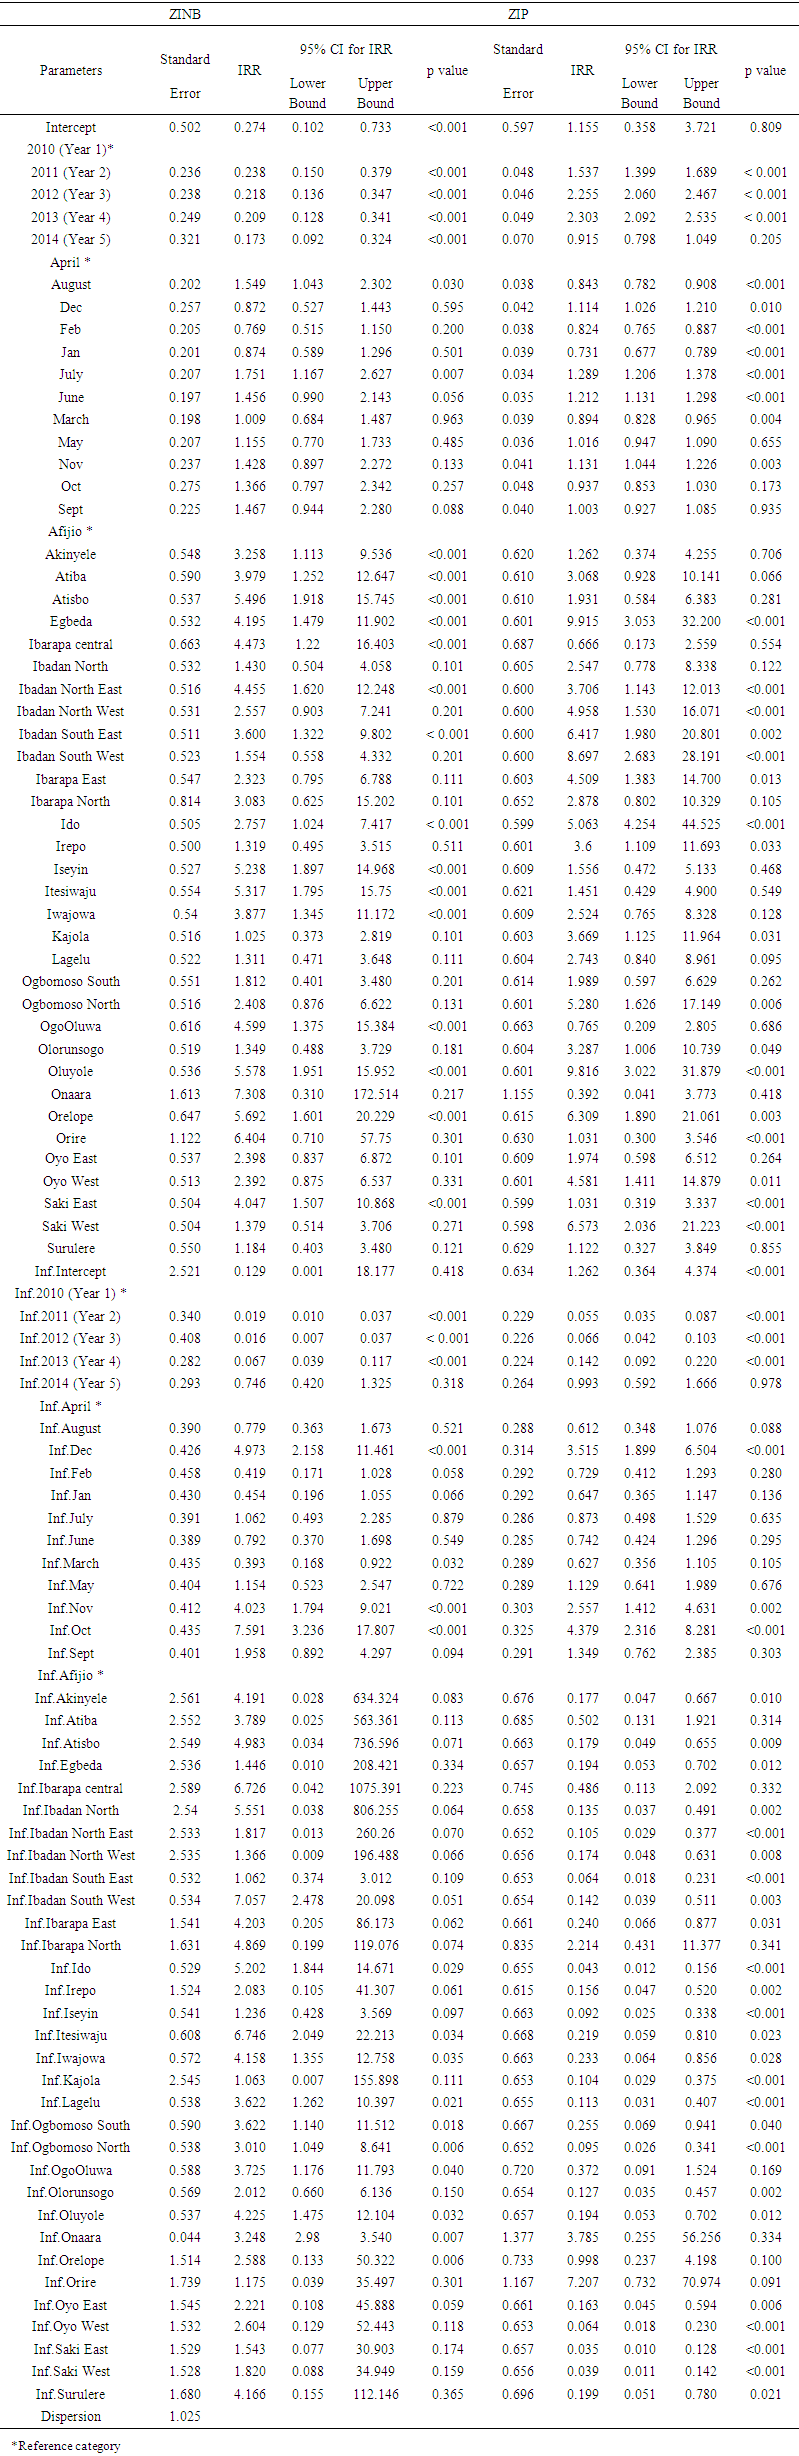 | Table 1. Parameter estimates in the Zero inflated negative binomial and Zero Inflated Poisson regression model for Childhood Pneumonia |
 | Table 2. Descriptive statistics of number of cases of childhood pneumonia in 2010 to 2014 |
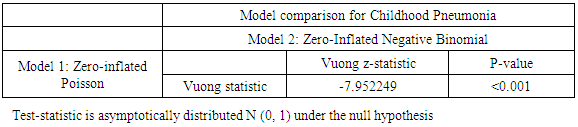 | Table 3. Comparison Test for childhood Pneumonia models (ZIP and ZINB) |
5. Discussion
- Unlike categorical data whose distribution is almost always known, count data is different and may sometimes have excess zeros. The childhood pneumonia cases showed excess zeroes and over-dispersion (the variance was greater than the mean). The zero inflated negative binomial regression model (ZINB) was preferred since it accommodates over-dispersion in the outcome data. Several studies have used the ZINB [1] and [6].The annual incidence of childhood pneumonia showed a sustained decrease from 2010 onwards with the greatest decrease in year 2014. This reduction in incidence of pneumonia appears to coincide with the measures put in place to combat pneumonia both locally and globally. These measures include the annual observance of World Pneumonia Day and the introduction of immunization against HIBb, pneumococcus, measles and whooping cough (pertussis) [7].Having established that ZINB regression model was best suited to determine the effect of month on the disease occurrence in Oyo state, months of reporting also had significant effect on the incidence of new cases of childhood pneumonia. Previous studies have shown that pneumonia illness is most common in the winter months and the greatest incidence during the rainy season [8, 9]. The geographical locations were also predictors of the occurrence of childhood pneumonia. In Nigeria, several environmental factors that could predispose children to pneumonia vary across geographic locations. The variation may be occasioned by seasonal and or occupational differences. A previous study on acute respiratory infections among un-der-five children in Indian slums [10] has identified the role of hazardous environment in the incidence of pneumonia while the impact of seasonal variation in pneumonia infection was noted by [11] who highlighted the increase in episodes typically occurring during the rainy season.The years of reporting, months and the local government areas were found to be predictors for non-cases of pneumonia. The non-cases of pneumonia in the years, months and local government areas may be explained by the increased measures taken in Nigeria to improving access to vaccination in recent years.
6. Conclusions
- The incidence of childhood pneumonia had a sustained decrease from 2010 onward and was highest in 2014. In view of observed sustained decrease in the incidence of childhood pneumonia, the government should be encouraged to improve on the intervention measures that have brought about this degree of success so far attained. The zero inflated negative binomial regression has been shown to adequately model such count data having excess zeros and over-dispersion and hence should be considered as the statistical method of choice for analyzing such data.
ACKNOWLEDGEMENTS
- The authors sincerely thank the Department of Planning, Research and Statistics, Oyo State Ministry of Health for providing the dataset used for the study.