-
Paper Information
- Paper Submission
-
Journal Information
- About This Journal
- Editorial Board
- Current Issue
- Archive
- Author Guidelines
- Contact Us
International Journal of Probability and Statistics
p-ISSN: 2168-4871 e-ISSN: 2168-4863
2018; 7(2): 31-43
doi:10.5923/j.ijps.20180702.01

The Impact of Mothers Education on Fertility in Ghana
 Abstract
 Reference
 Full-Text PDF
 Full-text HTML
Sulemana Abdul-Salam1, Shei Sayibu Baba1, Haruna Jabir2
1Department of Statistics, Faculty of Mathematical Sciences, University for Development Studies, Navrongo, Ghana, West Africa
2Department of Statistics and Mathematics, KNUST, Kumasi, Ghana, West Africa
Correspondence to: Shei Sayibu Baba, Department of Statistics, Faculty of Mathematical Sciences, University for Development Studies, Navrongo, Ghana, West Africa.
| Email: |  |
Copyright © 2018 Scientific & Academic Publishing. All Rights Reserved.
This work is licensed under the Creative Commons Attribution International License (CC BY).
http://creativecommons.org/licenses/by/4.0/

Many African countries, including Ghana, have come to accept the increasing role of education in the development of a healthy population of any nation. Education has the tendency of influencing the fertility of a person. However fertility trends in Africa still remain high. This study is to investigate the relationship between mother’s education and fertility. The Poisson model was used and the GMM was applied to solve the problem of endogeneity in the main explanatory variable of this study. The study utilized data from the Ghana Multiple Indicator Cluster Survey (MICS4). The use of the Poisson model was based on the count and discrete nature of the main outcome variable of this study which is number of children. The Instrumental Variable approach (IV) was used since years of education was an endogenous variable. The study showed that the average number of children among the respondents was found to be 3.8. Years of education was an average of 7.6. The IV estimates had a higher magnitude as compared to the Poisson though with same direction, it reveals one more year of education will reduce the expected number of children by 0.25. Therefore we conclude by this study that education is inversely associated with fertility.
Keywords: Education, Fertility, Poisson, Endogenous and variables
Cite this paper: Sulemana Abdul-Salam, Shei Sayibu Baba, Haruna Jabir, The Impact of Mothers Education on Fertility in Ghana, International Journal of Probability and Statistics , Vol. 7 No. 2, 2018, pp. 31-43. doi: 10.5923/j.ijps.20180702.01.
Article Outline
1. Introduction
- Global total fertility is projected to decline to 2.4 children per woman by 2030 and 2.2 children per woman by 2050. In Africa, fertility is projected to decline to 3.9 children per woman by 2030 and 3.1 children per woman by 2050 (WHO UNICEF UNFPA, 2014). Fertility declines in all other regions are projected to be much more modest and even show small increases in Europe and Northern America. The slower projected pace of fertility decline in Africa compared with the pace experienced by Asia and Latin America and the Caribbean at similar levels of fertility has important population and development implications for Africa and the world at large, United Nations (2015). Policy makers have advocated educating girls and young women as a means to reduce population growth and foster sustained economic and social welfare in developing countries.Early childbearing poses increased health risks to adolescent mothers and reduces the education and employment opportunities that adolescent girls might have had otherwise. Similarly education has an inverse relationship with fertility or the number of children a mother can have. The trend in fertility has been downward in all regions but there are very sharp differences in levels and trends. Africa has the highest birth rate and the decline over time has been slow (United Nations, 2013) Tracking trends in fertility and birth rates is essential in planning for the current and future needs of multiple generations. Sustained high fertility rates lead to disproportionately large populations of young dependents, driving demand for supports for young families, for additional schools, and for affordable child care. Figure 1 shows world fertility trend from 1950-2050.
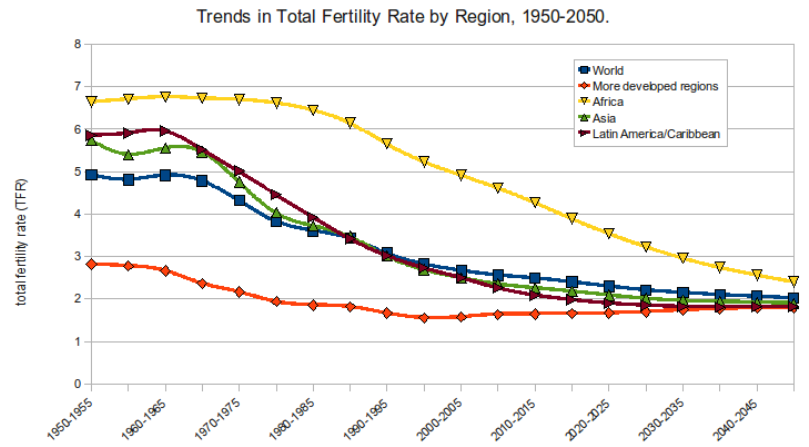 | Figure 1. World Fertility Trend (1950-2050). (Source: UN, world population prospects 2012) |
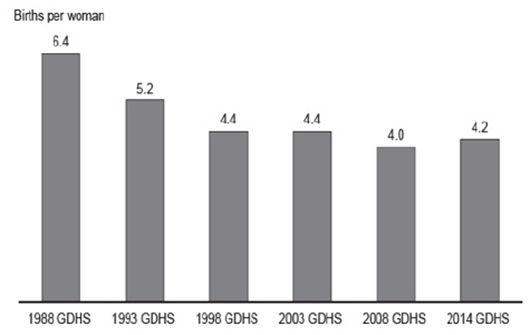 | Figure 2. Fertility Trend in Ghana (1988-2014). (Source: GDHS, 2014 report) |
2. Literature Review
- In Malawi, Luca, Radice, and Marra (2014) in their study about the impact of mothers education on fertility in Malawi; suggested that the relationship of interest was affected by endogeneity and exhibits an inverted U-shape among women living in rural areas of Malawi, whereas it exhibits an inverse (non-linear) relationship for women living in urban areas. They concluded that a year increase in education reduces fertility. A study in Nigeria by Osili and Long (2008), in testing whether the relationship between fertility and education is indeed causal by investigating the introduction of universal primary education policy in Nigeria revealed that increasing female education by one more year reduces early fertility by 0.26 births.Also, Amin and Behrman (2014) and Grépin and Bharadwaj (2015) in their various studies revealed that schooling has effect on women’s fertility; thus more schooling decreases number of children women may have since it delays childbearing. This negative effect operates through a postponement of first births away from teenage years and no catch-up later in life. They concluded that it may greatly accelerate declines in child mortality in the developing world today since increased education leads to better economic opportunities for women.Furthermore, in Israel, Lavy and Zablotsky (2015) found that education lowered fertility rates among exposed women, and therefore interpreted it as an effect of female education on fertility. The study further found that spousal education and children quality play a role in the fertility decline. Also, Handa (2000), in his study indicated both education and income have strong negative effects on births but the impact of education is larger for rural women. The birth elasticitise were -0.15 and -0.45 for income and education, respectively.Similarly, Luo (2006) found that Lower levels of both maternal education and neighbourhood’s income were associated with delivery and mortality. It revealed mothers with higher level of education has a greater impact on birth outcomes. Also, Habibov (2011) revealed mothers education have significant effect in the utilization of health care as well as the quality of services that they may receive. In Ghana, Blunch (2013) reveals adult literacy has a substantial impact in reducing child mortality and improving maternal health in the country and other developing countries. Furthermore, Arthur (2012) found that education had significant influence in the reduction of maternal mortality. The study also suggested at least the attainment of secondary level of education should be encouraged among women as it has a direct impact on Antenatal Care visits by expectant mothers. Also, Björklund (2006) revealed that policies such as “complete your education” adopted in Sweden years ago by families had really affected the level and structure of fertility. It indicated a reduction of family size to about 2 during those period of years. Similarly, Paul Schultz (2002) concluded that the health and schooling of children are more closely related to their mothers’ education than fathers’ education.Furthermore, Dinçer, Kaushal, and Grossman (2014) used data from Turkey to study the effect of education on women’s fertility and empowerment. In using instrumental variables, found increase in the proportion of ever-married women with eight-years of schooling lowered the rate of pregnancies and being significant as well. It further found an increase in the proportion of same women making ANC visit during the first trimester. Also using contraceptives and knowledge of the ovulation cycle increased respectively. It however revealed, there is weak evidence that schooling decreased child mortality.Another study in Tanzania, Ayoub (2004) showed that women’s schooling significantly reduces the number of children born per woman. The study found strong support for the negative correlation between Effects of Women’s Schooling on Contraceptive Use and Fertility, women’s schooling and cumulative fertility.
3. Data Source
- The Ghana Multiple Indicator Cluster Survey (MICS) is a nationally-representative household surveys that provide data for a wide range of monitoring and impact evaluation indicators in the areas of population, health and economics. The MICS was carried out in 2011 by the Ghana Statistical Service (GSS). Financial and technical support was provided by UNICEF, USAID, UNFPA, the Japanese Government, ICF/MACRO, the Ministry of Health/National Malaria Control Programme, and the Navrongo Health Research Centre. MICS is an international household survey programme developed by UNICEF. The Ghana MICS was conducted as part of the fourth global round of MICS surveys (MICS4). MICS provides up-to-date information on the situation of children and women and measures key indicators that allow countries to monitor progress towards the Millennium Development Goals (MDGs) and other internationally agreed upon commitments. The women (15-49) years was chosen because the defined fertility age range of women is between this periods. To study the Impact of education on fertility in Ghana, we used the information on respondents Number of Children to link individual’s years of education, (given as the number of years of schooling), religion, region, age and other control variables of interest. It is believed that the information chosen in one way or the other may have an impact on women’s number of children and hence the relationship between education and fertility.
4. Poisson Model
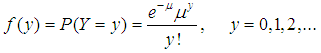
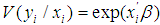
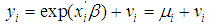
- Count data is largely utilized by the Poisson model named after a French mathematical physicist Poisson, Simon-Denis (17811840). His major contributions were in probability theory, in which he greatly improved Laplace’s work and developed several concepts that are now named after him.In this study we are interested in explaining and predicting probabilities, such as the probability of the number of children an educated mother will have. The probability distribution we use as a foundation is the Poisson, not the normal or the logistic.If Y is a Poisson random variable, then its probability function is;
 | (1) |
 | (2) |
 | (3) |
 , by 2 and 3, the Poisson regression is intrinsically heteroskedastic. Given 1 and 2 and the assumption that the observations are independent, the most natural estimator is maximum likelihood (ML). The log-likelihood function is
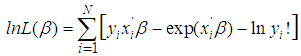 | (4) |
 , is the solution to k nonlinear equations corresponding to the first-order condition for maximum likelihood.
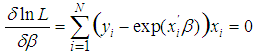 | (5) |
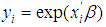 | (6) |
 is the vector of explanatory variables• β is the coefficient of the explanatory variablesAlso, Incidence Rate Ratio (IRR), is sometimes used to interpret the results from the Poisson model just as the Poisson maximum likelihood estimates. It is a ratio based on the rate or incidence of counts, (Hilbe and Greene, 2007). It can also be thought of as a ratio of ratios; i.e. the base ratio is the incidence rate of counts having some characteristic or property out of a group consisting of the population of subjects or items from which the counts are a part. The IRR is an exponentiation of Poisson results which are basically log linear values.
5. Definition and Description of Variables
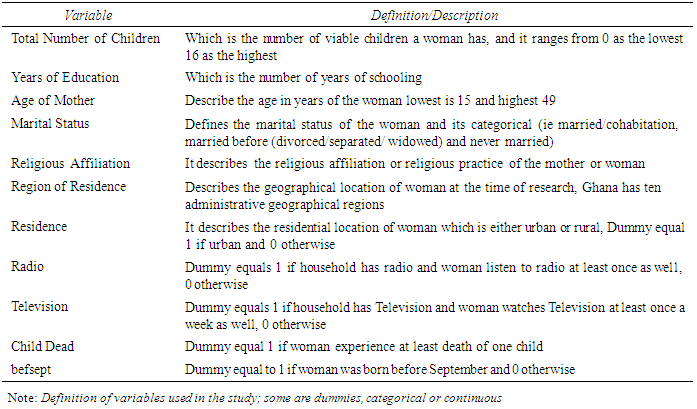
- The selection of variables is largely informed by past studies or literatures. The main outcome variable of this study is the number of children of the respondent (woman).The independent variables are mother’s years of education, geographical location (current regional location and residential location at the time of survey).Again, marital status of the woman has an influence on the number of children and hence we control that in the study. Also, religious practices or affiliation of women, access to media (listen to radio and watch television) and age of mother in years at the time of the survey was considered, this selection criteria was equally utilized by, (Handa, 2000; Zanin, Radice, and Marra, 2014). These variables have an impact on the number of children a mother will have.Also, if a woman experiences at least the death of a child is also a control variable in the study. Mostly educated women spend a lot of their hours in the labour market and often found to have limited hours for child rearing. This sometimes results in trade-off between hours of work and the number of children a mother will desire. We expect higher level of education to be negatively associated with fertility. The definition of all the variables from the pooled data is shown in Table 1. Some of the explanatory variables are continuous or categorical while dummies were created for others with one (1) equals to value of interest and zero otherwise.
|
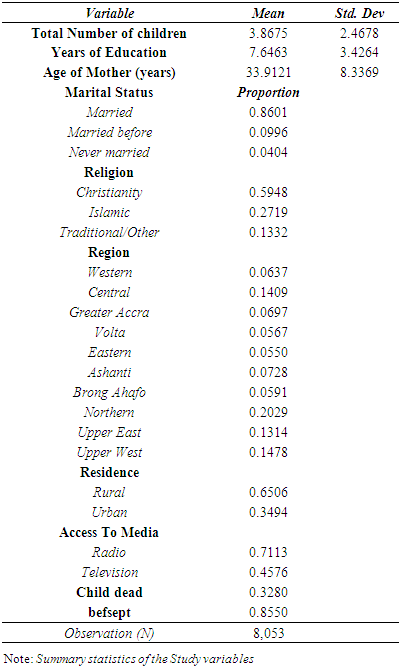
6. Summary Statistics
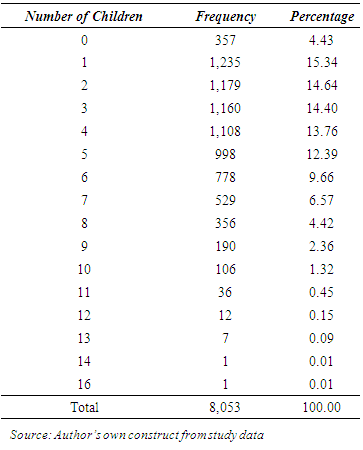
- The focus of this study is on fertility(the number of children) among educated mothers as such our data was limited to about 8,053 out of over 10,963 of the sample size. Table 3 shows the summary statistics for the pooled data, whiles figure 3 shows the graph of the mean of some of the variables.Number of Children is the dependent variable for this study, it is the number of children the woman has. There is an average of about 3.8 number of children (approximately 4) among the respondents.Women’s education (Years of Education), was measured in terms of years of schooling by combining information on educational level attended and the grade attained. Years of schooling is widely used as a proxy variable for education because knowledge and skills should increase with advancement in schooling. However, one limitation of this variable is that it does not measure performance in school, curriculum content, and other qualitative aspects of education, (Zanin, Radice, and Marra, 2014). In Ghana, the official age of entry into primary school is 6 years old, and the school calendar begins in September.Age of Mother (years), the age of respondents plays a crucial role in socio-demographic analyses because age affects many aspects of life such as education, fertility, marriage, retirement, mortality, and so on (Palameleni E. Martin, 2011). Women’s age was coded as a continuous variable. The ages between 15 and 49 years inclusive is typically considered to span women’s reproductive lives. The average age in the study is 33.9 years.Marital Status, Marriage is not only the most predominant context for childbearing but also one of the most important determinants of fertility. It is categorical defined as women who are currently married/cohabitation, married before (Separated/Divorced, widows) and those never married but has at least one child. We use currently married/cohabitation as a base variable to compare with married before and those who never married. Scholars have observed that births usually occur within marriage in developing countries, (Martini et al., 2014; Kazembe, 2009; Marra and Radice, 2011). About 86% were married/Cohabitation. In the present study, we have not considered the woman’s age at marriage. Some observational analyses have noted that self-reported data on the year of marriage may suffer from recall errors when these data are provided by older women recalling an event that happened many years ago or from under-reporting when they are provided by young women (Kalipeni, 1997). Thus, as a precaution, we have excluded the woman’s age at marriage as a control variable to minimize the use of variables that may be affected by potential uncontrollable measurement errors (Sobotka et al., 2013).Religious affiliation, we grouped religions in Ghana into three main categories: Christianity, Islamic and Traditional/Other religion. Heaton (2011) found that Muslims fertility is higher than Christian’s fertility in many developing countries. Our sample is composed mostly of Christian women (59.48%), whereas Muslim and Traditional/Other represent 27.19% and 13.32% of women in the sample, respectively (see Table 1).Region of residence (region), this is defined as a categorical predictor that identifies the geo- graphical region of Ghana where each woman was interviewed. Ghana is divided into 10 regions, northern region has an average of about 20.29% of the total respondents for the study whiles Eastern region being the least with 5.5%. This variable should capture sociocultural differences between regions that are related to women’s fertility.Residence (Urban), in addition to region, we also considered the metropolitan character of respondent’s place of residence. We constructed a dichotomous variable that takes the value of one if a woman lives in an urban area and zero otherwise (i.e. the woman lives in a rural area). Several studies show that women who live in urban areas have lower fertility rates than those who live in rural areas (Kalipeni, 1997; Kravdal, 2000; Sobotka et al., 2013).Access to Media, this is to identify women whose household has either Television or radio in which they watch or listen. Media plays a major role in the form of information and education. A binary variable was created for women who have and listen to radio at least once a week as 1 and 0 otherwise. About 71.13% had access to Radio. Also a binary variable was created for women who watch Television at least once a week as 1 and 0 otherwise, the average is about 45.76%.Child Dead, it refers to women who have experience at least one death of a child. It is coded as 1 for those who have experience that and 0 otherwise. About 32.80% have experience that in this study.befsept, it describes the month of birth of the mother or respondent, it is a dummy variable equal to 1 if woman was born before September and zero otherwise. This variable is also used as the instrumental variable which is considered logically associated with the main explanatory variable (education). Table 2 shows the frequency of the dependent variable.
|
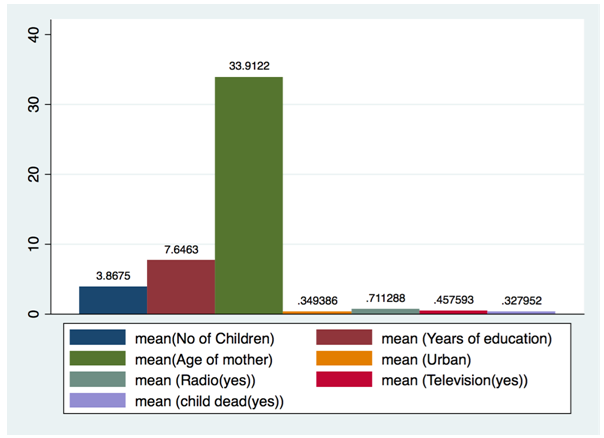 | Figure 3. Graph of Summary statistics of some variables (Source: Author’s own construct from the study data) |
|
7. Analytical Framework
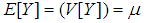
- The existence of discrete count dependent variable that takes non-negative integer values, such as number of doctor visits, number of travel times, number of times an injury occur utilizes some main cross-section data models for counts such as the Poisson and negative binomial models, hurdle and zero- models, and latent class or finite mixture models, (Cameron and Trivedi, 2014).In this study the focus is on Poisson regression model due to the outcome variable which is discrete (Number of children). The number of children by respondents in the study has 0 as the minimum and 16 as the maximum, as shown in figure 4. The Poisson model restricts continuous count variables where as the OLS allows for continuous and discrete counts variables. Again the shape of the distribution of figure 4 (right skewed) makes it a more appropriate model as compared to the OLS which normally favours a “bell shaped” distribution.Interestingly, the property of the Poisson distribution is that the variance equals the mean. A related complication is that of sample selection (Terza, 1998). The count y is observed only when another random variable, potentially correlated with y, crosses a threshold. For example, to see a medical specialist one may first need to see a general practitioner. The Poisson regression model is usually too restrictive for count data, leading to alternative models. A more obvious way that the Poisson is deficient is that, for count data of a cross sectional study the variance usually exceeds the mean, a feature called over-dispersion. However, though very rare in many studies, under-dispersion which when for count data the variance usually is less to the mean. The Poisson instead implies equality of variance of mean, a property called equi-dispersion. (Cameron and Trivedi, 1999) Practically in reference to table 3, one will conclude that there is over-dispersion and hence an extended model must be used. It is nonetheless important to control for over-dispersion for two reasons as discussed by Peterson, Cameron, and Trivedi (1999) and Hilbe and Greene (2007); first, in more complicated settings such as with truncation and censoring, over-dispersion leads to the more fundamental problem of inconsistency and secondly, even in the simplest settings large over-dispersion leads to grossly deflated standard errors and grossly inflated t-statistics in the usual maximum likelihood (ML) output.
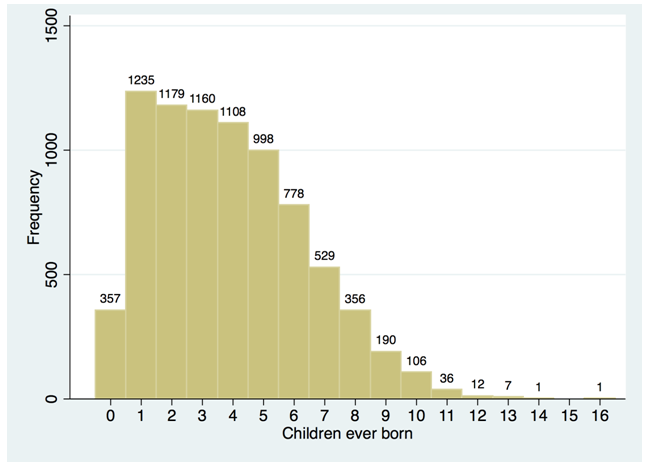 | Figure 4. Graph of Number of children among respondents (Source: Author’s own construct from the study data) |
8. Generalized Methods of Moment (GMM)
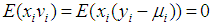
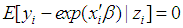
- Models for count variables arise in a number of contexts, in this particular study the focus is on a count variable (Number of Children), but the main explanatory variable years of education is an endogenous variable. It is revealed by Cameron and Trivedi (1999) and Wooldridge (2002) that Mullahy (1998) in a cross-section context and Crepon and Duguet (1997) in a panel data context, apply the GMM approach to count models with endogenous regressors. With reference to equation 5 it is therefore clear that Poisson regression estimator is a method of moment’s estimator. If we write the model equation 6 with an additive error term vi as
 | (7) |
 | (8) |
 | (9) |
 | (10) |
9. Negative Binomial Model
- The Poisson distribution is too limited as it is a one parameter distribution, depending on only the mean µ. In particular, the distribution restricts the variance to equal the mean, but count data used in economic applications generally are over-dispersed. A practical example is this study with reference to Table 3, the dependent variable (Total number of children) has a mean of 3.8 and standard deviation of 2.4. The standard generalization of the Poisson is the negative binomial (NB) model. The negative binomial largely utilizes the variance given by
 | (11) |
 | (12) |
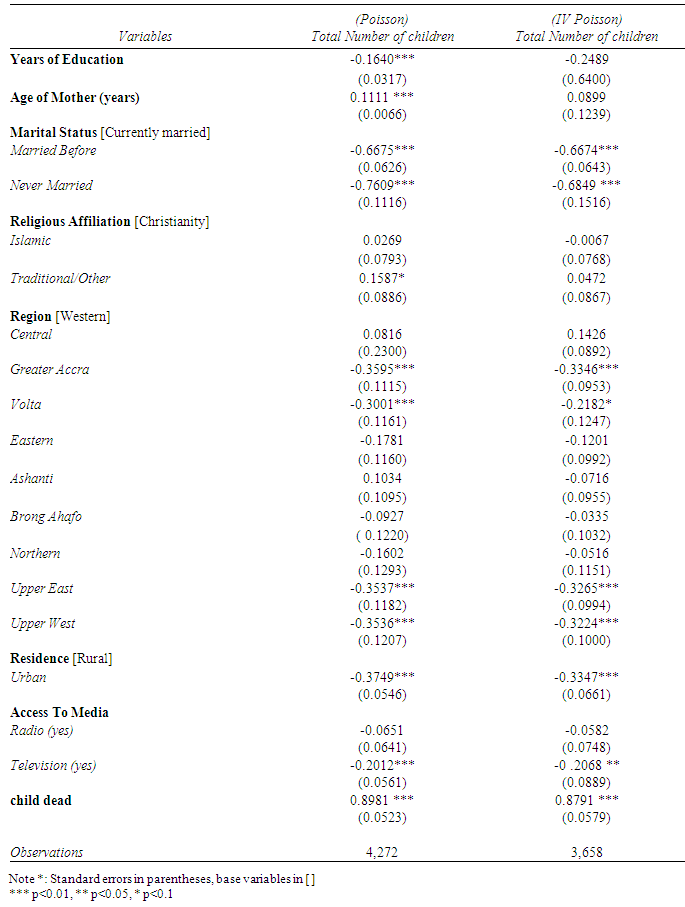
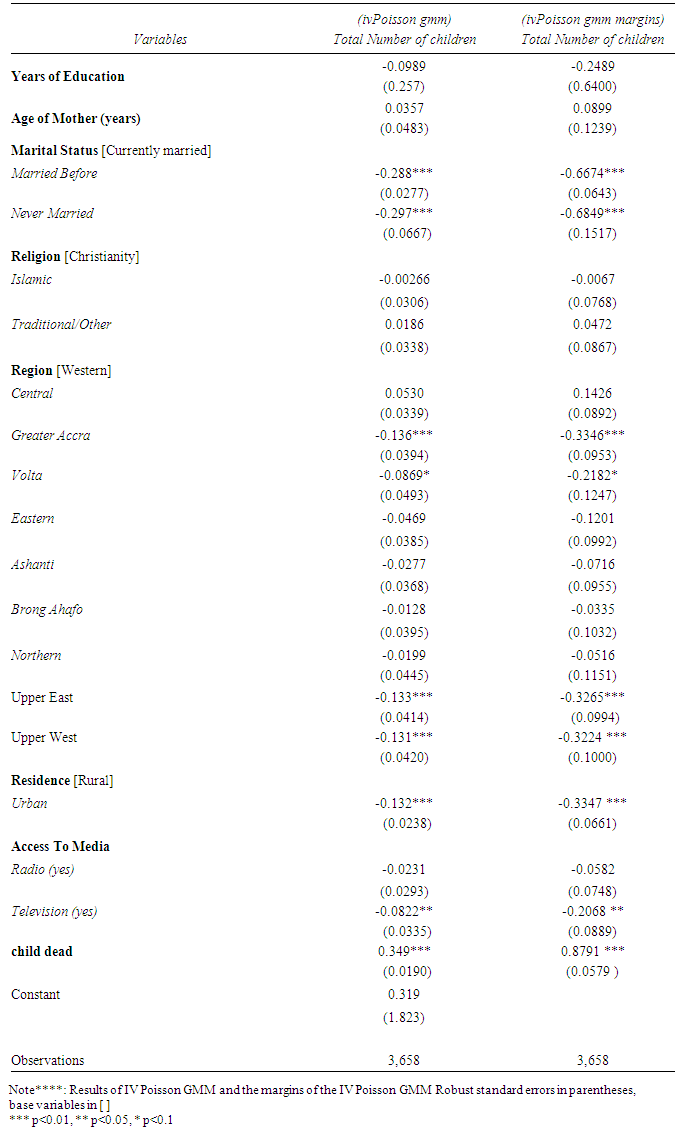
10. Empirical Results
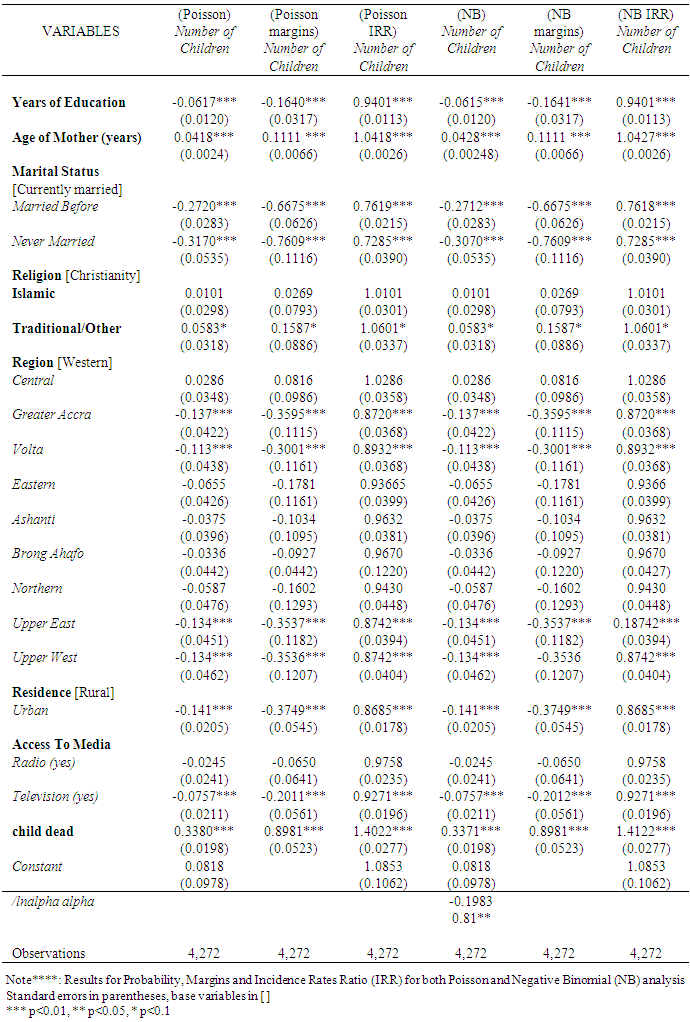
- The results of the estimation of the Poisson analysis and the Instrumental Variable analysis are given in Table 4. The results in the Poisson section shows that one more year of education is significantly and negatively associated with the woman’s expected number of children with a probability of 0.1640. However, the instrumental variable results indicates that one more year of education is negatively associated with the expected number of children by 0.25. Indeed the magnitude with IV results indicated that, normal Poisson regression underestimated that. This is consistent with various findings in Africa, eg (Osili and Long, 2008; Zanin, Radice, and Marra, 2014).Also, women married before (ie divorce/separated/widowed) are significantly and negatively associated with the expected number of children by 0.67 estimates in both Poisson and Instrumental Variables estimates respectively. Also, women who never married are significantly and negatively associated with the expected number of children by 0.76 and 0.68 in the Poisson and IV estimates respectively; in all we used the currently married/cohabitation as a base variable. This result is expected as it is belief that married/cohabitation women may have a higher chance of conceiving compared to the other status.Also, not surprising women who were affiliated to the Islamic religion are positively associated with the expected number of children by 0.027 by the Poisson estimates. However, is negatively associated in the IV estimates. In Ghana most Islamic communities are noted for large family size and household but the results shows otherwise in the IV. Also, traditional/other religious affiliates are positively and significantly associated with the expected number of children with a probability of 0.1587 in the Poisson column, and positively associated with a probability of 0.0472 in the IV estimates respectively. The religious affiliation of respondents have varied directions in the Poisson and IV estimates with different magnitude as well with reference to Table 4. This is not surprising because the error term of the number of children equation and education are not independent, hence inducing bias in some parameters of the model, eg (J.M. Wooldridge, 2011) and (Wooldridge 2010).Moreover, the signs associated with regions in the estimates vary across all the regions where as the central region shows positive signs, the other regions are negatively associated with the expected number of children in both the Poisson and IV estimates with varied magnitude as well. Only Greater Accra, Volta, Upper East and Upper west regions are negatively and significantly associated with the expected number of children in both the Poisson estimates and IV estimates. Ashanti region though negatively associated but not significant. It is worth noting that although the variable of interest is education, the effects of the control variables on children should also change (to some degree) when IV Poisson is used.Also, urban residents are significantly and negatively associated with the woman’s expected number of children with probabilities 0.3749 and 0.3347 in the Poisson and IV Poisson estimates respectively. This results is consistent with other studies, White et al. (2008) who shows that urban women exhibit fertility rates that are, on average, 11% lower than those of rural women. Also, mothers who listens to radio at least once a week are negatively associated with the expected number of children with probabilities of 0.0651 and 0.0582 in the Poisson and IV estimates respectively. Another important observation is the mothers who have access to Television, those that watch television at least once a week are significantly and negatively associated with the expected number of children with a probability of 0.2012 in the Poisson estimates whiles the IV estimates is also significantly and negatively associated with the expected number of children with a probability of 0.2068. This indicates the use of the media in the propagation of information and for education should be precise and appealing to listeners and viewers of radio and Television. The estimates of mothers who have experience at least one child death also indicated a significant and positive association with the expected number of children with a probability of 0.8981 and 0.8791 in the Poisson and IV estimates respectively. Undoubtedly mothers will like to always replace lost kids more especially if they lost their only child, and sometimes a particular sex group.The study further used the Negative binomial regression model, with results in Table 5. The summary table 3 indicated the mean of the dependent variable (Number of children) as 3.8675 and standard deviation as 2.4678, this tend to show the variance is about 6.0900 which is more than the mean and therefore means an over-dispersion as discussed earlier.
|
|
|
11. Conclusions
- This study analysed the relationship between education and fertility among Ghanaian women, accounting for both observed and unobserved variables. This analysis is motivated by observational studies that have identified education as a key contributor to the decline of fertility. Our investigation is based on cross sectional data from the Ghana Multiple Indicator Cluster Survey (MICS4) which contains information on the number of children per woman. The study took into account education and other socio-economic and demographic characteristics for a sample of women between the ages of 15 and 49 years.One initial findings of our study was that women’s education has a significant impact on their expected number of children. Another important finding was that endogeneity was likely to be a concern in research on this relationship. A reduction in fertility was found for women who achieved the highest levels of schooling because, better education helps women to acquire greater knowledge and the skills that they require to find jobs in sectors that are incompatible with child-rearing. The findings of the study are similar to Osili and Long (2008) as found in Nigeria, Handa (2000) as found in Jamaica and Dinçer, Kaushal, and Grossman (2014) in Turkey. This results is significantly associated with the believe that better educated women are more likely to use birth control methods (i.e. modern contraceptive methods) than women with lower levels of education.The Poisson model reported smaller education effects on the expected number of children of the woman (fertility) compared to instrumental variable models. The study also found that the direction is same, thus negatively related. The findings revealed an increase in years of education reduces the woman’s expected number of children (fertility). Also, some socio-economic and demographic characteristics of the woman are negatively associated with the expected number of children. Also, urbanization was found to have a negative association with the woman’s expected number of children. However, religious affiliation are variedly associated with the number of children of the woman (fertility).High fertility coupled with declining death rates is driving a rapid increase of the population in Ghana, where the average annual population growth is about 2.27%. (Ghana Statistical Services, 2013). This trend is a critical socio-economic issue for Ghana because it coincides with inadequate resources and infrastructure.Based on these findings, governments and policy makers should gear their action strategies towards programmes that contribute to increased access to education. Also improve on the quality of existing ones, and promote policies that will ensure achievement of education for a larger number of women.Furthermore policy makers should as well promote educational initiatives on birth control, especially for women living in rural areas. This can be done in the full utilization of the media and other available sources. Undoubtedly, reducing fertility through improvements in women’s education is a strategy that will require time and critical investment. As next steps, researchers should pursue a better understanding on the complex relationship between fertility and education using longitudinal data, which were not available for our analysis.