-
Paper Information
- Paper Submission
-
Journal Information
- About This Journal
- Editorial Board
- Current Issue
- Archive
- Author Guidelines
- Contact Us
International Journal of Probability and Statistics
p-ISSN: 2168-4871 e-ISSN: 2168-4863
2017; 6(5): 93-100
doi:10.5923/j.ijps.20170605.01

Design and Development of Two Sided Complete Chain Sampling Plans for Variable Quality Characteristics - VCChSP
 Abstract
 Reference
 Full-Text PDF
 Full-text HTML
1Department of Statistics, Government Arts College, Coimbatore, India
2Department of Mathematics, Karunya University, Coimbatore, India
Correspondence to: Deva Arul S., Department of Statistics, Government Arts College, Coimbatore, India.
| Email: |  |
Copyright © 2017 Scientific & Academic Publishing. All Rights Reserved.
This work is licensed under the Creative Commons Attribution International License (CC BY).
http://creativecommons.org/licenses/by/4.0/

In this article a new complete chain sampling plans for variable quality characteristics is developed. The new sampling algorithm is given to make a decision on the lots. The performance measures such as operating characteristics function and the related measures are derived and provided by the authors. The merit of new sampling plan is when the lot is not accepted on the basis of first sample then the results of preceding and succeeding lots are utilized to make a unique decision on the current lot. In this sampling plan the shouldering effect on the OC curve is better and will discriminate between good and bad lots. It is found that probability of acceptance of the lot decreases as the chaining index i increase. This will coerce the producer to maintain the quality of the lot. Customers are well satisfied with the operating procedure since it is easy to identify the preceding and succeeding chaining indices i equals j. Designing procedure is provided to determine the parameters and tables are given for the speedy implementation in industries.
Keywords: Variable Characteristics, Two sided, Complete Chain Sampling Plans
Cite this paper: Deva Arul S., Vijila M., Design and Development of Two Sided Complete Chain Sampling Plans for Variable Quality Characteristics - VCChSP, International Journal of Probability and Statistics , Vol. 6 No. 5, 2017, pp. 93-100. doi: 10.5923/j.ijps.20170605.01.
Article Outline
1. Introduction
- Acceptance sampling plans procedure play as a major technique for many product control system besides process control tools and capability indices have significant place in quality control division. Acceptance sampling is based on statistical algorithm which is used to make decisions on the lots comprises of products either to accept or reject after the inspection. That is, sampling plans are widely used in industries for disposition of lots to consumer or to another in-house assembly section. In industries, the product dimensions are measurable and in general variable in nature. By quality we mean a level or standard. If the quality of the product is measurable then the variable under study is called as variable quality characteristics. The main advantages of variable sampling plan are (i) It can used whenever the product dimensions are measurable in nature. (ii) It leads to very small sample size when compared with attribute sampling plans and hence simultaneous reduction in the inspection cost. Thus, a variable acceptance sampling plan requires less sample units, less time for decision making and less cost of inspection. Moreover the measures of variable sampling plans provide precise information that leads to accurate designing of the sampling plans. The newly developed variable sampling plan reduces damages to the lots during destructive or costly testing and the parameters can be easily determined. Many authors have investigated and developed several types of variable sampling plans according to the specific need of the industries. Baillie D H [1] has developed DSP by variables when the process standard deviation is unknown. Balamurali and Usha [2] have designed optimal variable sampling plans by minimizing the ASN. Lieberman and Resnikoff [16] have constructed tables for the selection of variable sampling plan parameters based on MIL-STD 414 scheme. Variables sampling plans based on normal distribution is developed by Owen [17] when the standard deviation of the process is unknown. Bender Jr [3] has developed variables sampling plans based on non-central t-distribution. Govindaraju and Kuralmani [12] have studied OC function of single sampling plans with known sigma value. Govindaraju and Soundararajan [14] have developed tables for selecting the parameters of variables single sampling plans. Bravo and Wetherill [4] designed double sampling plans (DSP) for variable quality characteristics. Schilling [18] has developed new type of sampling plans with variables and attributes quality characteristics to control the mixed production process. Chen C H [5] has designed economic sampling plans for variable quality characteristics by using quadratic loss function. Dodge [10] has introduced the concept of Chain Sampling plans for costly and destructive products. Soundararajan [19] contributed to ChSP(0,1) sampling plans by giving tables. Govindaraju and Balamurali [13] have determined chain sampling plans for variables inspection. Vijayaraghavan and Sakthivel [20] have designed Chain Sampling Plans using Bayesian methodology. Vijila and Devaarul [21] have designed Complete Chain Sampling Plans indexed through AOQL. Devaarul and Edna [8], Devaarul Sand Vijila Moses [9] have developed two sided complete chain sampling plans and relational chain sampling plans respectively for the improvement in the inspection of the lots.
2. Need for the Variable Complete Chain Sampling Plans - VCChSP
- Quality characteristics are the measurable entity of a product which is specified by the customers or the in-house section of the same industry. The quality characteristics can be divided into two broad categories. Firstly, they are the characteristics that customers expect to meet the required standard. Secondly, they are the set of measurable variables which consist of the specification to assess its production capability and to assure that the specifications or standards are met. There are two types of product quality characteristics, variables, and attributes. Variables are those quality characteristics that can be measured on a continuous scale, for example, length or diameter. Attributes are those characteristics that are either present or absent, for example, defective or not defective, within tolerance or out of tolerance. In the literature of acceptance sampling plans, the Probability of acceptance of the lots plays a vital role in designing a sampling plan with appropriate producer and consumer risks. If the operating characteristics curve is convex downward then the efficiency of the sampling plan will be lesser. Hence variable chain sampling plans are developed by many authors, but the customers are not satisfied with such sampling plans because the chaining rule depends only on the preceding lots or previous results. The ongoing production or future inspection results are not considered for the decision on the current lot. Many quality control practitioners insist that if any lot is not accepted on the basis of first sample then not only the preceding ‘i’ samples but the succeeding ‘j’ lots should also be considered, for a unique decision on the current lot. Hence an attempt has been made to develop Variable Complete Chain Sampling Plans which coerce the producer to maintain the quality of the products and is termed as VCChsp (n,k,i). In this paper a new algorithm is given for complete chain sampling inspection based on variable quality characteristics. The new OC function and the related measures are derived for the first time. Designing procedure is given and tables are constructed for the easy application in industries.
3. Condition for Applications
- (i) Lots are submitted for inspection in the order of production for chaining purpose.(ii) The dimension of the products should be measurable in nature.
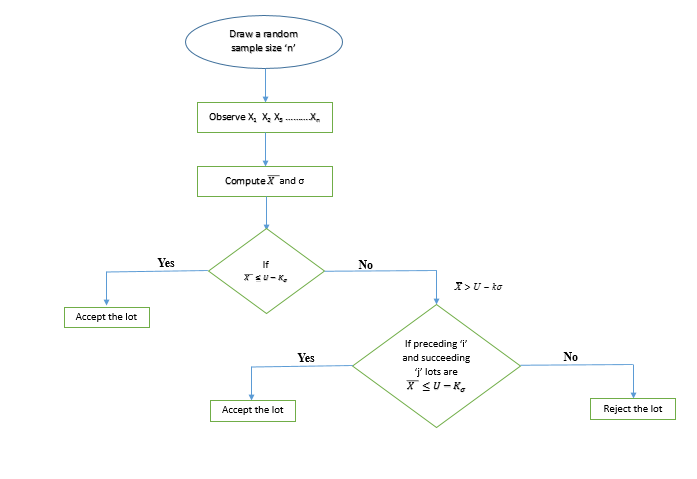
4. Flow Chart - Operating Procedures of Variable Complete Chain Sampling Plan
5. Formulation of VCChSP
- Let
 : Submitted lot quality; q = 1− p
 : Acceptable quality level (AQL)
 : Limiting quality level (LQL)
 : Producer’s risk
 : Consumer’s risk
 : The probability of lot acceptance when the fraction nonconforming is p
 : Sample size for known sigma plan
 : Acceptance criterion for known sigma plan
 : Rejection criterion for known sigma plan
 : Sample size for unknown sigma plan
 : Acceptance criterion for unknown sigma plan
 : Rejection criterion for unknown sigma plan
 : Number of preceding lots considered for accepting current lot for known sigma planj: Number of succeeding lots considered for accepting current lot for known sigma plan
 : The value which is to be compared with acceptance criterion for making decision
 : The sample mean
 : The sample standard deviation
 : The process standard deviation
 : The cumulative distribution function of standard normal distribution.ASN: The average sample number SSP: Single sampling plan ChSP: Chain Sampling PlanVCChSP: Complete Chain Sampling plans based on variable inspection
6. Operating Procedures of Variable Complete Chain Sampling Plan
- Let the quality characteristic of interest has the upper specification limit U which follows a normal distribution with unknown mean
 and known standard deviation
  . Then, the following two procedures of the variables chain sampling plan are proposed.Case 1: Known SigmaStep 1: Draw a random sample of size ‘
 ’Step 2: Determine
  ,Step 3: If
  , then accept the current lot.Step 4: If
  , accept the lot provided the preceding ‘i’ lots and the succeeding ‘j’ lots are accepted based on the criterion
  Step 5: Otherwise reject the lot.Thus, the proposed variable complete chain sampling plan is characterized by three parameters, namely
  and
and  . If j = 0, it reduces to ordinary Chain Sampling Plans for variables. If P
 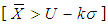 is an impossible event then it reduces to probability of acceptance of single sampling plans. Case 2: Unknown Sigma. Whenever the standard deviation is unknown, we may use the sample standard deviation S instead of
  . In this case, the plan operates as follows.Step 1: Take a random sample of size ‘
 ’Step 2: Determine
  and
and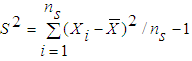 . Step 3: if
  then accept the current lot.Step 4: If
  , accept the lot provided the preceding ‘i’ lots and the succeeding ‘j’ lots were accepted on the condition that
  .Step 5: Otherwise reject the lot.Thus the proposed unknown sigma variable complete chain sampling plan is characterized by three parameters, namely
  .
.7. Measures of VCChSP(k,i,j)
7.1. Operating Characteristics Function of VCChSP(k,i)
- If the Upper specification and process standard deviation are known then the fraction non-conforming in a lot is given as
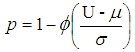 | (1) |
 | (2) |
 | (3) |
 | (4) |
 is the probability of accepting a lot based on the first sample with parameter
  and
and is the probability of not accepting a lot based on first sample.
 is the Probability of acceptance of the preceding i lots.
  is the Probability of acceptance of the succeeding j lots. The probability of acceptance of the chain sampling plan when i=j can also be written as
 | (5) |
 and
and  .The parameters of the known sigma variables chain sampling plan are denoted by
  and for unknown sigma plan they are denoted by
  .
.8. Designing Methodology for Variable Complete Chain Sampling Plans
- Step 1: Determine two points on the OC curve, (
 ,
, ) and (
 ,
, ). where
  is called the acceptable quality level (AQL),
  is the limiting quality level (LQL),
  is the producer’s risk, and
  is the consumer’s risk. Step 2: According to Schilling a well-designed sampling plan must provide at least
  probability of acceptance of a lot when the process fraction nonconforming is at AQL level and the sampling plan must also provide not more than
  probability of acceptance if the process fraction non-con-forming is at the LQL level such that
 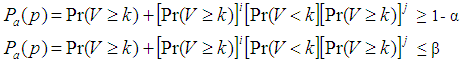 Step 3: The parameters n, k, i = j are determined by solving the equations in step 2 through an iterative computer program. Step 4: By applying the well-known designing procedure due to Duncan [25], if (AQL,
  ) and (LQL,
  ) are prescribed, then the OC function should satisfy the following
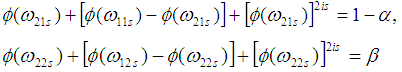 Step 5: In the case of known sigma variable chain sampling plan, the OC function under the specified AQL and LQL conditions can be written as
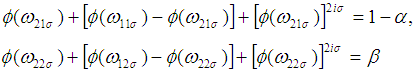 | (10) |
 is the value of
  at
at ,
,  is the value of
  at
at  ,
,  is the value of
  at
at  and
and  is the value of
  at
at  . That is,
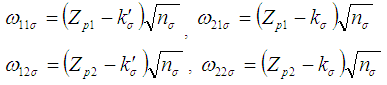 | (11) |
 is the value of
  at AQL and
  is the value of
  at LQL. Step 6: By solving the above equations by iterative procedure, the parameters,
  , i, j and
  are determined and given in the tables.
 9. Illustration 1
9.1. Selection of Known Sigma Variables Chain Sampling Plan for Specified AQL
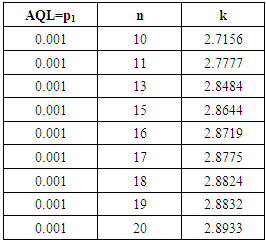
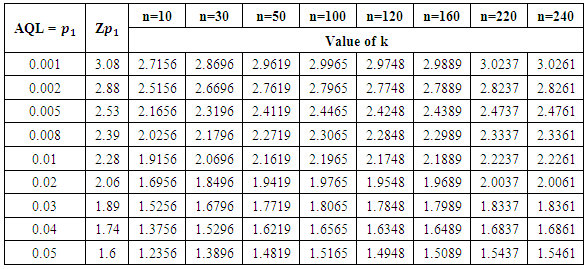
- Table 1 can be used to determine the parameters of the known
 variables complete chain sampling plan for specified values of AQL when
  = 5%. For example, if
  = 1%,
= 1%,  = 5%, Table 1 gives the parameters as
  and
and  = 2.716. For the above example, the plan is operated as follows.From each submitted lot, take a random sample of size 10 and compute
  , where
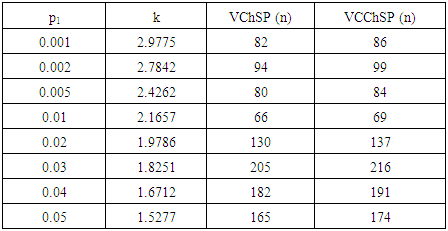
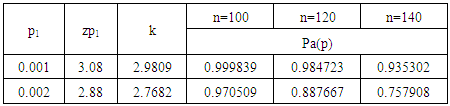
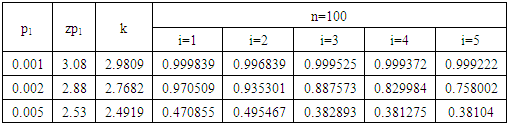
  . Accept the lot if V≥2.716, if V < 2.716, then accept the current lot provided that the preceding i lots and succeeding j lots were accepted on the condition that V≥2.716 with the same sample size of 10 units otherwise reject it. Description of Tables:Table (1) gives various acceptance constant k with the corresponding change in the sample size for the same process quality. For practical convenience small sample size is taken into consideration. However acceptance constant k varies with larger sample size and one can extend the table for various AQLs. Comparison between Variable Chain Sampling Plans and Variable Complete Chain Sampling plans are given in table (2). A small increase in the sample size is noticed in case of VCChSP, even though the chaining index ‘i’ is doubled. It is an added advantage to the producer. It is found from table (3) that the probability of acceptance decreases as sample size increases which gives more pressure on the producer to maintain the quality. Table (4) is constructed for selection of the parameters n, the sample size and k, the variable factor. Table (5) indicate the reduction in the probability of acceptance whenever the chaining index i is increased in the new sampling plan. This gives more pressure to the producer to keep the index i small. In general, the new sampling algorithm and its sampling plan satisfy the consumer. The tables can be extended according to the need of the quality control section in industries.
|
|
|
|
|
9.2. Illustration 2
- Let us suppose that the upper specification limit given by the consumer is 0.95 with producer risk 5%. A lot is submitted for quality testing with an agreement of chaining index i=1.A random sample of 20 observations are taken from the lot and given below:
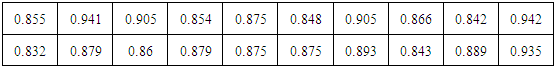 The implementation of VCChsp is shown below:Step1: Draw a random sample of size 20.Step2: For the known data, we determine
 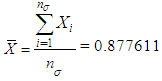 and
and 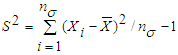 S= 0.29586Step 3: Calculate
 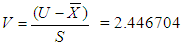 Step 4: Since V=2.446704 ≥ 2.89, we accept the current lot without considering the result of past and future lots. Suppose V < 2.89, then one succeeding and preceding sample results are to be considered for taking the decision on the current lot.
 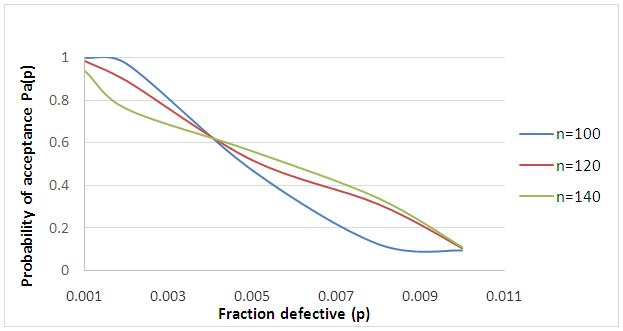 | Figure 1. OC Curve for VCCHSP |
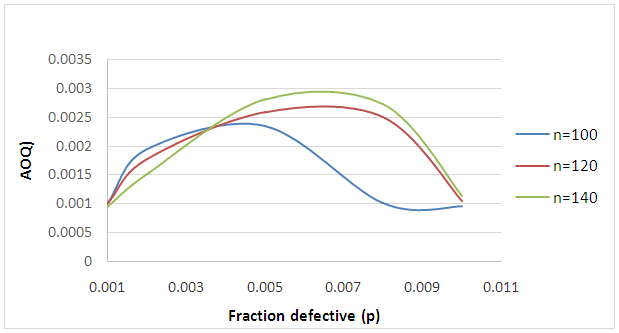 | Figure 2. AOQ Curve for VCCHSP |
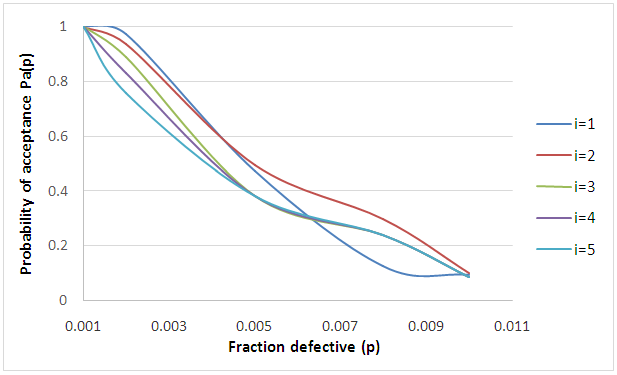 | Figure 3. OC Cuve for VCChSP |
10. Conclusions
- In this article a novel complete chain sampling plans for variable quality characteristics is developed. The new operating procedure is given to decide on the incoming lots. The algorithm is more efficient and will give tremendous pressure on the producer to maintain the quality of the product. The performance measures Operating Characteristics function and the related measures are derived and provided by the authors for the first time. It is to be highlighted that when the lot is not accepted on the basis of first sample then the results of preceding and succeeding lots are utilized to make a unique decision on the current lot. This gives a better shouldering effect on the OC curve and will discriminate between good and bad lots. The chaining index i of the new sampling plans coerces the producer to maintain the quality of the lot. Customers also satisfied with the operating procedure since it is easy to identify the chaining index ‘i’. The sample size is small in VCChSP compared to other sampling plans and hence inspection cost may be lesser for the producer.
ACKNOWLEDGEMENTS
- The authors are grateful to Dr. Paul Dhinakaran, Ph.D., the Chancellor of Karunya University for providing necessary facilities to carry out the research. We thank the experts, reviewers and the editors for giving the suggestions to improve the article.