Shei Sayibu Baba1, Haruna Jabir2, Sulemana Abdul-Salam1
1Department of Statistics, Faculty of Mathematical Sciences, University for Development Studies, Navrongo, Upper East Region, Ghana, West Africa
2Department of Statistics and Mathematics, KNUST, Kumasi, Ghana, West Africa
Correspondence to: Shei Sayibu Baba, Department of Statistics, Faculty of Mathematical Sciences, University for Development Studies, Navrongo, Upper East Region, Ghana, West Africa.
| Email: |  |
Copyright © 2017 Scientific & Academic Publishing. All Rights Reserved.
This work is licensed under the Creative Commons Attribution International License (CC BY).
http://creativecommons.org/licenses/by/4.0/

Abstract
In this study, a new cumulative sum (CUSUM) control chart has been proposed to detect a shift in one of the scale parameters of the New Weibull-Pareto Distribution (NWPD). The V-Mask method was employed in the CUSUM construction. The study indicated a significant changes in the parameters of the V-Mask when a slight shift occurs in the scale parameter under study. The parameters observed in the V-mask included the mask angle, the lead distance and the Average Run Length (ARL).
Keywords:
One-sided, Scale parameter, Slight shift, Lead distance, Weibull-Pareto
Cite this paper: Shei Sayibu Baba, Haruna Jabir, Sulemana Abdul-Salam, One-Sided Cumulative Sum Control Chart for Monitoring Shift in the Scale Parameter Delta (δ), of the New Weibull-Pareto Distribution, International Journal of Probability and Statistics , Vol. 6 No. 4, 2017, pp. 76-81. doi: 10.5923/j.ijps.20170604.02.
1. Introduction
Every rational consumer makes decision with regards to the purchase of a product or service based on the quality of such products or services. This quality is manifested by the level of satisfaction the consumer derives from the product or service over the life span of the product. In order to meet this quality, there should be a system of maintaining standards in manufactured products. This is done through the use of statistical processes which is key in identifying when a process needs attention and correction. Statistical Process Control (SPC) charts are being used widely by quality engineers for monitoring the stability of different process over time. A control chart helps to distinguish between normal process variation and unusual variation due to a special cause. Practical application of SPC charts have now been extended far beyond manufacturing industries to other industries such as biology, genetics medicine, finance among others. It is well known that Shewhart charts are effective in detecting isolated shifts or relatively large sustained shifts. The weakness of the Shewhart control charts is its inability to detect small to moderate shifts in any process. To overcome this challenge, quality control engineers use Cumulative Sum (CUSUM) control charts which are effective in detecting small to moderate shifts. The construction of the CUSUM greatly is done with a probability distribution. The effectiveness and for that matter the sensitivity and power of the CUSUM control chart to a greater extent depends on the type of distribution employed. This New Weibull-Pareto Distribution (NWPD) is suitable for modelling processes or systems with constant failure level.A great deal of researchers have employed different statistical distributions in construction of CUSUM control charts. Notably among them include: Hawkins and Olwell (1998) stated that the CUSUM control charts are most sensitive Statistical Process Contol (SPC) to signal a persistent small step change in a process parameter. Again, Naber and Bilgi (1994) developed a CUSUM control chart for the Gaussian distribution. Kantam and Rao (2004) investigated the CUSUM control chart for the Log-Logistic Distribution and concluded that it was able to detect shifts on the average than the Shewhart control charts Luguterah (2015) proposed a unified CUSUM control chart for the Erlang-truncated exponential distribution. Nasiru (2016) proposed a one-sided CUSUM control chart for shape parameter of the Pareto distribution and recently Shei and Maahi (2017) proposed a unified CUSUM control chart for the parameters of the Pareto distribution. All these researchers investigated the behavior of the lead distance, the mask angle and the Average Run Length (ARL). In this article we proposed the construction of a one-sided CUSUM control chart for monitoring shifts in one of the scale parameters of the New Weibull-Pareto distribution using the V-mask procedure.
2. New Weibull-Pareto Distribution
The NWPD was developed by Nasiru and Luguterah (2015). The distribution has been applied and demonstrated in modeling real life problems and it has proved superior to both Weibull and Pareto distributions. The NWPD was used to model the exceedances of flood peaks (in m3/s) of the Wheaton River near carcross in Yukon Territory, Canada. This data was recently analysed by Merovei and Puka (2014) and Bourguignon et al. (2013). The pdf of the New Weibull Pareto distribution is given by: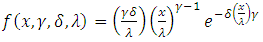 | (1) |
where  is the shape parameter and
  are scale parameters.It has a mean:
 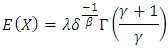 and the variance is given by:
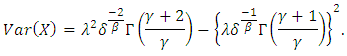
3. Sequential Probability Ratio Test (SPRT)
Sequential sampling is an extension of the multiple sampling phenomenon. In this sampling process, a sequence of samples from a lot are taken and the number of samples are determined by the results of the sampling process. The procedure in which item-by-item are sampled sequentially was introduced by Wald (1947). This procedure is based on the sequential probability ratio test. The V-mask control scheme was proposed by Barnard (1959). The performance of the V-mask is determined by the lead distance and the angle of the mask. The mask is applied to successive values of the CUSUM statistic: where
where  is the standardized observation:
 The decision procedure consist of placing the V-mask on the cumulative sum control chart with the point O on the last value of
  and the line OP. If all the previous cumulative sums
  lie within the two arms of the V-mask, the process is in control. However, if any of the cumulative sum lie outside the arms of the V-mask, the process is considered to be out of control. Let
  the likelihood function of the NWPD with a shift in the shape parameter and let
  be the likelihood function of when there is no shift in the shape parameter of the NWPD. Then the ratio of these likelihoods is taken as
  The SPRT is used for testing null hypothesis,
  as against the alternative hypothesis,
4. Cumulative Sum (CUSUM) Control Chart for the New Weibull-Pareto Distribution
The pdf of the New Weibull-Pareto distribution is given by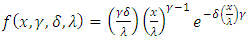 | (1) |
where  is the shape parameter and
  are scale parameters.If
  are randomly, independent and identically distributed with the pdf in (1), then the likelihood ratio for testing the null hypothesis
 against the alternative hypothesis
 where
where  and keeping
  and
and  fixed. The likelihood of when a shift occurs is given by:
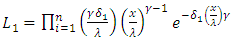 | (2) |
and the likelihood of when there is no shift is given by: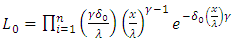 | (3) |
The likelihood ratio of the two (2) and (3) is given by: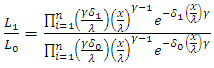 | (4) |
This is reduced to: 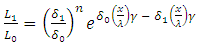 | (5) |
The continuation region of the Sequential Probability Ratio Test (SPRT) distinguishing between the two hypotheses is given by: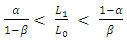 | (6) |
where  and
and  are type I and II errors. Thus substituting for (5) into (6), it gives:
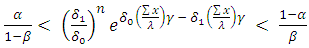 | (7) |
Taking logarithm of (7), it yields: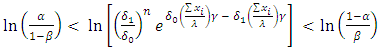 | (8) |
This becomes: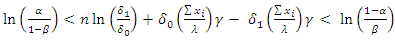 | (9) |
Setting  to zero and taking the right hand side of the inequality it yields:
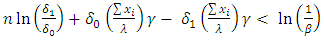 | (10) |
Thus: 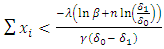 | (11) |
and finally | (12) |
Equation (12) is then written in the form  where
where  and
and Alternatively, equation (12) can also be written in the form
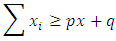 where
where 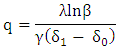 and
and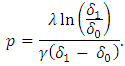 The mask angle is then obtained as:
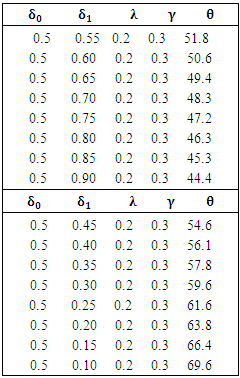
 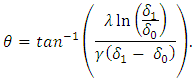 Table 1 shows the simulated values of the mask angle,
  given the values of
  and
and  . When there is a positive shift in the parameter delta,
  from
from  to
to  it can be determined from the first part of Table 1 that the value of
  decreases as
  increases. On the other hand when there is a negative shift where
  , the value of
  increases. Not all but also, when the shift in the parameter is positive, larger shifts produce smaller mask angles. However, when the shift is negative, larger shifts in the parameter produce larger angles of the V-Mask. The details are shown in the second part of Table 1.
Table 1. Simulated values of the mask angle,

 |
| |
|
The lead distance,  is the value of
  above. Thus:
 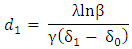 where
where  The alternative case of the lead distance is denoted by
  which is equal to the value of
  as shown above. Thus:
 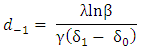 where
where  Given values of
  and
and  with a positive shift in the parameter
  where
where  It shows that the lead distance,
  increases as the size of the shift increases as indicated in the first part of Table 2. Also, the smaller the shift in the parameter, the larger the value of the lead distance and the vice-versa. More also, no matter whether the shift in the parameter is positive or negative, the lead distance has the same value for any given shift. On the other hand if the shift is negative,
  the value of
  decreases as shown in the second part of Table 2.
 Table 2. Simulated values of the lead distance, d
 |
| |
|
5. The Average Run Length of the CUSUM
The ARL is given by: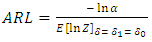 | (13) |
where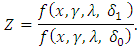 The ratio of the functions is given by:
 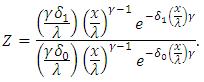 This is reduced to:
 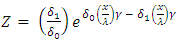 | (14) |
Taking logarithm of (14) it yields: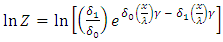 | (15) |
Taking expectation of (15) gives: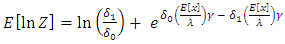 | (16) |
and: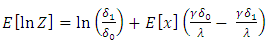 | (17) |
 is defined by:
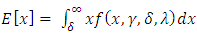 | (18) |
This implies: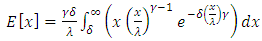 | (19) |
By integrating (19) it gives: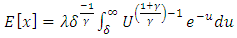 | (20) |
but 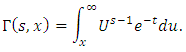 This is simplified as:
 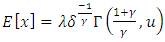 | (21) |
Substituting (21) into (17) for  it yields:
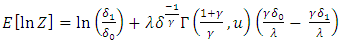 | (22) |
And finally: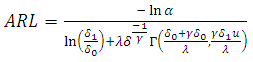 | (23) |
where  is an upper incomplete gamma function.The sensitivity of the CUSUM depends on its performance based on the ARL. The in-control ARL and the out-of control ARL. The in-control ARL is the average number of observations from the in-control process before a false out-of control alarm is raised. On the other hand, the out-of control ARL refers to the average number of observations required to detect a shift in the process mean. CUSUM charts are designed to reduce the out-of control ARL for a shift in the process mean while maintaining a given in-control ARL (Bagshaw and Johnson (1975), Moustakides (1986)). Given the values of
  and
and  with a shift in
  such that
  whereas the other parameters are fixed, the ARL decreases as the value of
  enlarges. On the other hand if the shift in
  , is negative where
  , the ARL increases. Furthermore, if
  , and the value of
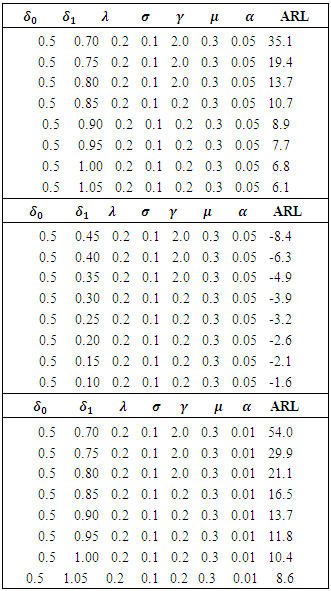
  is reduced from 5% to 1% level of significance, the value of the ARL also reduces. It can also be determined that the larger shift in the process parameter, the smaller the ARL when the shift in the parameter is positive but when the shift in the parameter is negative, smaller shift produces smaller values and the vice-versa. The details are shown in Table 3. The first part of the Table 3 indicates a positive shift with
  having a value of
  The second part of the Table 3 shows a negative shift and the third part of the Table 3 gives values of ARL when there is a changed in the value of
  from 0.05 to 0.01.
Table 3. Simulated values of the ARL
 |
| |
|
6. Practical Demonstration with Some Random Values of the NWPD
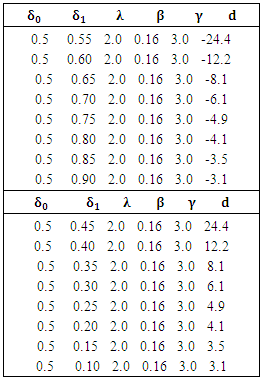
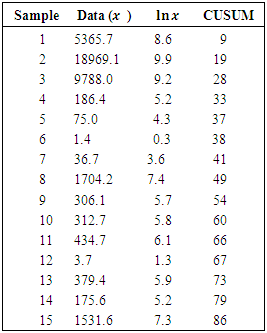
Table 4 shows some random numbers generated with the NWPD. The first ten values are random numbers of the distribution when the scale parameter is fixed at 0.5. The last five numbers represent some random numbers of the NWPD when the scale parameter shifts to 0.9. The V-Mask, having a mask angle of 76° and a lead distance of 3 was placed at the last point plotted. The process graph is then plotted with the CUSUM value to the nearest whole number against the sample number. The graph showed that sample 1 to 8 fell outside the arms of the V-Mask, indicating a shift in the process parameter as shown in Fig 1.Table 4. Random numbers of the NWPD
 |
| |
|
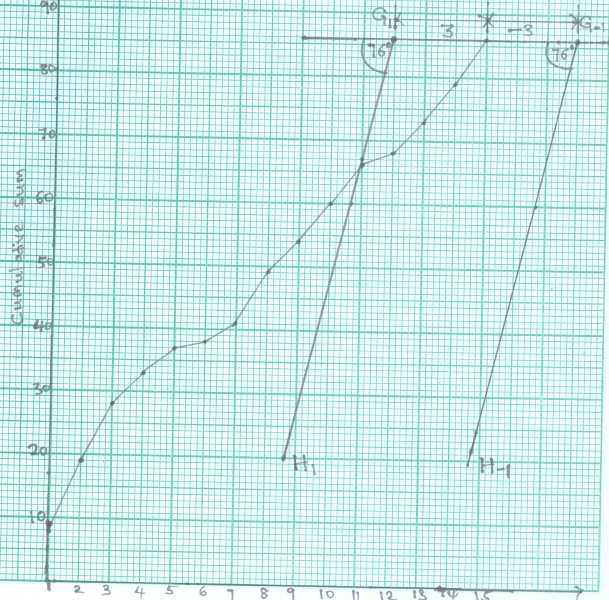 | Figure 1. One-sided CUSUM plot for the simulated hypothetical data |
7. Conclusions
In this study, we proposed a new one-sided CUSUM control chart for the NWPD. The results shows that when there is a positive shift in the parameter delta,  from
from  to
to  the value of the mask angle,
  decreases as the difference
  increases. On the other hand when there is a slight negative shift in the value of the parameter, where
  the value of the mask angle,
  increases.Also, there has been an effect on the lead distance,
  whenever there is a slight shift in the process parameter. The lead distance increases in value as the size of the shift becomes larger and the lead distance also decreases when the shift is negative, thus when
  Furthermore, the ARL decreases as the value of
 enlarges. On the other hand if the shift in the parameter
  is negative where
  the ARL increases. More also, if
  and the value of
  level of significance reduces, the value of the ARL also reduces.
References
| [1] | Bagshaw, M. and Johnson, R. (1975). The Influence of Reference Values and Estimated Variance on the ARL of CUSUM Test. Journal of Royal Statistical Society, Series B (Methodological) 37(3), 413-420. |
| [2] | Bourguignon, M., Silva R. B., Zea L. M., and Cordeiro G. M. (2013). The Kumaraswamy-Pareto distribution. Journal of Statistical Theory and Applications, 12(2): 129-144. |
| [3] | Hawkins, D. M. and Olwell D. H. (1998). Cumulative sum charts and charting for quality improvement. Springer-Verlag, New York. |
| [4] | Kantam, R. R. L. and Rao, G. S. (2004). A note on point estimation of system reliability exemplified for the Log-logistic distribution. Economic Quality control. 19(2): 197-204. |
| [5] | Luguterah, A. (2015). Unified cumulative sum chart for monitoring shifts in the parameters of the Erlang-Truncated exponential distribution. Far East Journal of Theoretical Statistics, 50(1): 65-76. |
| [6] | Merovci F., and Puka L., (2014). Transmuted Pareto Distribution. Probstar Forum, 7: 1-11. |
| [7] | Moustakides, G. (1986). Optimal Stopping Times for Detecting Changes in Distributions. The Annals of Statistics 14(4): 1379-1387. |
| [8] | Nabar, S. P. and Bilgi, S. (1994). Cumulative Sum Control chart for the Inverse Gaussian distribution. Journal of Indian Statistical Association. 32:9-14. |
| [9] | Nasiru S. and Luguterah A. (2016). The New Weibull-Pareto Distribution. Pakistan Journal of Statistics and Operation Research. 11(1): 103-114. |
| [10] | Nasiru, S. (2016). One-sided cumulative sum control chart for monitoring shifts in the shape parameter of Pareto distribution. Int. J. Productivity and Quality Management, 19(2): 160. |
| [11] | Shei S. B. and Tuahiru M. (2017). Unified Cumulative Sum Control Chart for Monitoring Shifts in the Parameters of Pareto Distribution. International Journal of Statistics and Applications 7(3): 170-177. |
| [12] | Wald, A. (1947). Sequential Analysis. John Wiley, New York, NY. |

 Abstract
 Reference
 Full-Text PDF
 Full-text HTML