Dikko H. G.1, Adehi M. U.2, Yakasai A. M.3, Asiribo E. O.4, Dahiru T.5
1Department of Statistics, Ahmadu Bello University, Zaria, Nigeria
2Department of Mathematical Sciences, Nasarawa State University, Keffi, Nigeria
3Infectious and Tropical Diseases Unit, Public Health and Diagnostic Institute, College of Medical Sciences, North-West University, Kano, Nigeria
4Department of Statistics, University of Agriculture, Abeokuta, Ogun, Nigeria
5Department of Community Medicine, Ahmadu Bello University, Zaria, Nigeria
Correspondence to: Adehi M. U., Department of Mathematical Sciences, Nasarawa State University, Keffi, Nigeria.
| Email: |  |
Copyright © 2017 Scientific & Academic Publishing. All Rights Reserved.
This work is licensed under the Creative Commons Attribution International License (CC BY).
http://creativecommons.org/licenses/by/4.0/

Abstract
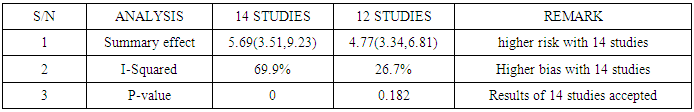
Meta-analysis of common events is readily available when a literature search is carried out for use in a meta-analysis. Usually, the fixed and random effect models work well with the common events. Non-common events are associated with effect estimates that are undefined or unstable when data is needed to carry out a meta-analysis. The application of the single mean imputation technique provided a complete data set in the meta-analysis of four studies that encountered loss of data. Data was sourced via Google scholar, jstor website, MEDLINE, Infectious Diseases Journal, Veterinary Medicine Journal, Public Health Journal and Cochrane database. Twelve studies out of sixteen had complete data and were meta-analyzed, resulting in a summary effect of 4.77 and a 95% confidence interval of (3.34, 6.81), I-squared = 26.7% with p-value = 0.182. After tackling missing values of the four studies using the MATLAB software for imputation of missing values, another meta-analysis was carried out with the 16 studies, the resulting summary effect was 5.4 and 95% confidence interval of (3.36, 8.67), I-squared=66.9%, p-value<0.001. Sequential sensitivity analyses and publication bias tests led to the exclusion of 2 studies. The final meta-analysis consisted of 14 studies and resulted in a summary effect of 5.69, 95% confidence interval of (3.51, 9.23) in favour of mortality, I-squared=69.9%, p-value<0.001. The result of the meta-analysis involving 14 studies was accepted over that of 12 studies going by the P-value significance (Table 3). Protective measures should be used by the individuals who are exposed to rabies by slaughtering or consumption of infected species because rabies is extremely fatal.
Keywords:
Non-common events, Missing Values, Rabies, Sensitivity Analysis, Subgroup Analysis
Cite this paper: Dikko H. G., Adehi M. U., Yakasai A. M., Asiribo E. O., Dahiru T., Meta-analysis for Non-Common Events: Rabies, International Journal of Probability and Statistics , Vol. 6 No. 4, 2017, pp. 65-75. doi: 10.5923/j.ijps.20170604.01.
1. Introduction
Non-common events occur in everyday circumstances, the events may be avoided by researchers because data may be undefined, unstable or missing. Non-inclusion of such studies where meta-analysis is inevitable reduces statistical power on the inferences there-off or may result in misleading conclusions. Non-common events are also associated with high levels of heterogeneity which may be managed using sequential sensitivity analysis or subgroup analysis [1]. Rabies is a non-common event and it is a fatal illness with almost 100% case fatality rate. In rabid animals, the rabies virus confines mainly to the nerves and adipose tissues even though it can also be found in all parts of the body [2]. Transmission is possible following consumption of carcasses of animals that died of rabies and by consumption of raw dog meat [3]. No intervention is effective in stopping the disease after the onset of symptoms. Hence, there is need to prevent the disease. Rabies is transmitted by contamination of wound with infectious material especially saliva from rabid animals and from bites by rabid animals. In Nigeria, dogs are responsible for over 96% of rabies cases in animals [4]. Rabies remains an endemic and neglected tropical disease in Nigeria and is often misdiagnosed, under-diagnosed and under-reported [12, 15]. In some cases, despite proper vaccination, the disease has been reported [12, 17].
2. Materials & Methods
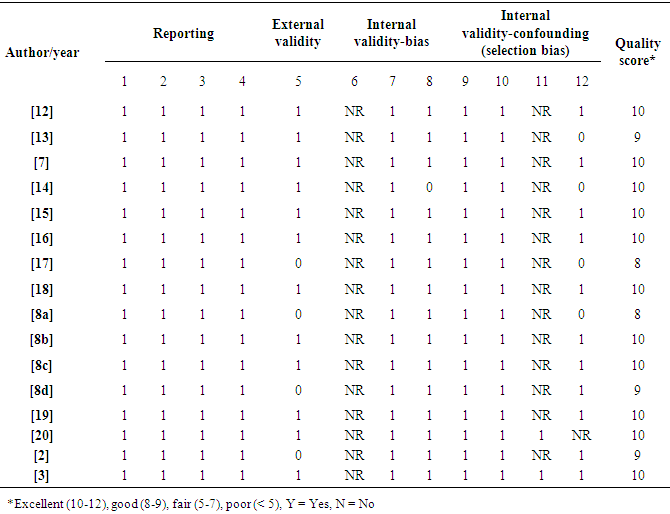
Data for rabies was sourced via Google scholar, jstor website, MEDLINE, Infectious Diseases Journal, Veterinary Medicine Journal, Public Health Journal and Cochrane database. The quality of the studies was rated either good or excellent based on the Downs & Black [5] checklist (Table 1). The inclusion criteria were studies that recorded: -1. odd ratios for risk of mortality related to rabies.2. results from Nigeria.3. sample size.Altogether, 16 studies were included for the meta- analysis.Table 1. Downs and Black checklist for quality assessment of studies included in the systematic review and meta-analysis (Downs & Black, 1998)
 |
| |
|
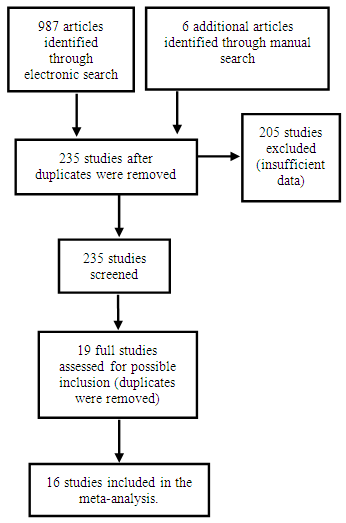 | Figure 1. Flow diagram for selected 16 studies for review and meta-analysis of rabies data |
The meta-analysis of non-common disease outcomes is associated with loss of data due to death, lack of response owing to stigma of disease, recovery of patients or simply attitude of patients. Such missing information are needed for meta-analyses especially because fewer studies are available in non-common cases. The pattern of missing data from four studies could not be determined, the four studies were derived from [8] and did not have an effect measure neither was it computable from available data. The single mean imputation method of missing data management involving sequential imputation of mean as explained in [9, 10] was adopted using MATLAB software to obtain odd ratios that were used in the meta-analysis.The statistical methods that was used for the meta-analysis are those explained in [6] combined with both the DerSimonian & Laird (D & L) methods and inverse variance (IV) methods based on standard fixed or random effects models which were modified to provide a solution to the meta-analysis of non-common outcomes [1]. Consider a collection of k non-common primary studies, the ith of which has estimated effect size Yi and true effect size  . The general models are: -
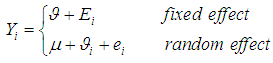 | (1) |
where 
 is the sampling error,
 is the random deviations of study’s observed effect from the true effect size,
 is the population mean,
 is the deviation of study’s true effect from the grand mean,
 is the grand meanThe fixed effects model assumes
  for
for  , implying that each study in the meta-analysis has the same underlying effect. The estimator of
  is generally a simple weighted average of the Yi, with the optimal weights equal to the inverse of the variance
 | (2) |
where  is the within study variance for study i.The weighted mean (M) is then computed as
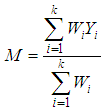 | (3) |
where  is, the sum of the products
  (effect size multiplied by weight) and is divided by the sum of the weights
  .The variance of the summary effect is estimated as the reciprocal of the sum of the weights,
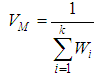 | (4) |
and the estimated standard error of the summary effect is the square root of the variance, | (5) |
Then,  lower and upper limits for the summary effect are estimated thus,
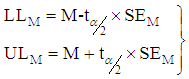 | (6) |
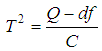
Finally, a t-test to test the null hypothesis that the common true effect  is zero can be computed using
 | (7) |
for a one-tailed test the p-value is given by 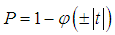 | (8) |
where we choose positive if the difference is in the expected direction and negative otherwise, and for a two-tailed test by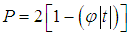 | (9) |
and  is the standard normal cumulative distribution.To compute a study’s variance under the random-effects model, we need to know both the within-study variance and
  , since the study’s total variance is the sum of the two values. One method for estimating
  is the method of moments (or the D & L method). The parameter
  (tau-squared) is the between studies variance (the variance of the effect size parameters across the population of studies).It is possible that T is negative due to sampling error, which is unacceptable as a value for
  , so we define;
 | (10) |
Let  be an estimator for
 | (11) |
where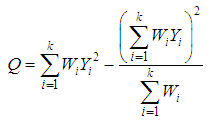 | (12) |
df=k-1where k is the number of studies, and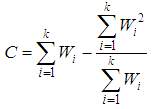 | (13) |
under the random-effects model the weight assigned to each study is | (14) |
where  is the within-study variance from study i plus the between-study variance,
  .
.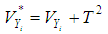 | (15) |
The weighted mean,  , is
, is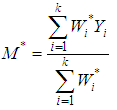 | (16) |
that is, the sum of the products (effect size multiplied by weight) divided by the sum of the weights.The variance of the summary effect is estimated as the reciprocal of the sum of the weights, or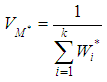 | (17) |
and the estimated standard error of the summary effect is the square root of the variance,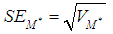 | (18) |
The  lower and upper limits for the summary effect would be computed as
 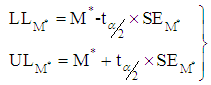 | (19) |
Finally, a t-value to test the null hypothesis that the mean effect  is zero could be computed as
 | (20) |
where we choose positive if the difference is in the expected direction or negative otherwise.For a two-tailed test by | (21) |
The I2- Statistic is an alternative and stronger measure compared to the Q- measure [11].  | (22) |
use value of Q from (12).Heterogeneity in the I2 – Statistics may be termed low, moderate, or high based on the intervals  ,
,  , or
, or  respectively.
3. Results
The studies from [8] had missing odd ratio values that were not computable from available data. Before the imputation of missing values, the meta-analysis of 12 studies (Figure 2) resulted in I-squared = 26.7%, p-value>0.001, with odds ratio = 4.77 in favour of mortality, at 95% confidence interval (3.34, 6.81).Egger’s and Begg’s tests (Figure 3&4) were at variance with respect to publication bias, as such, we could not conclude the presence of bias. However, sensitivity analysis (Figure 5) indicated that study [7] may be a source of bias. 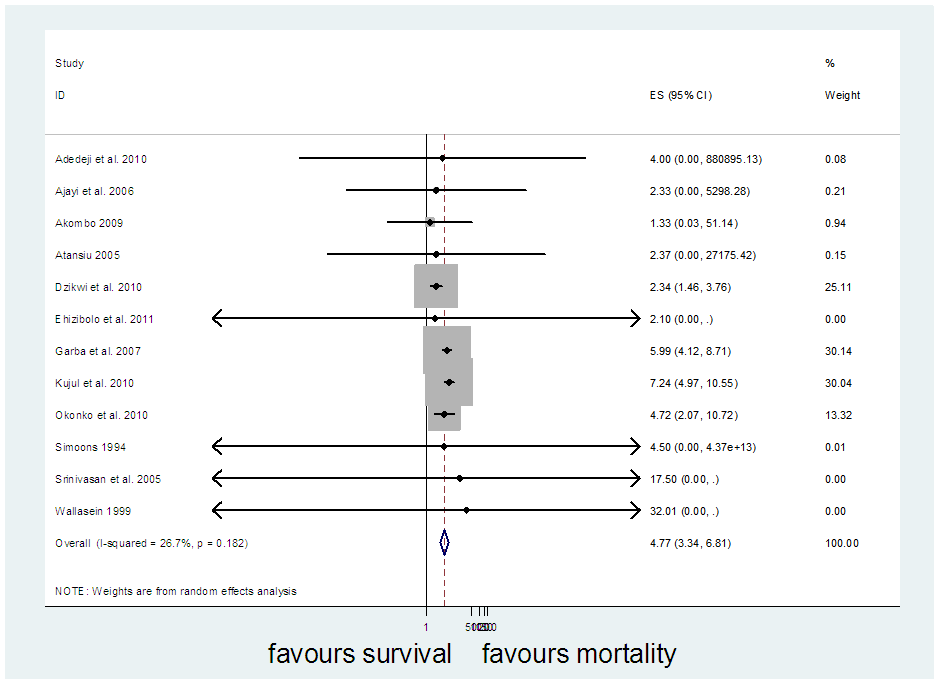 | Figure 2. Meta-analysis of 12 studies on risk of mortality of rabies data |
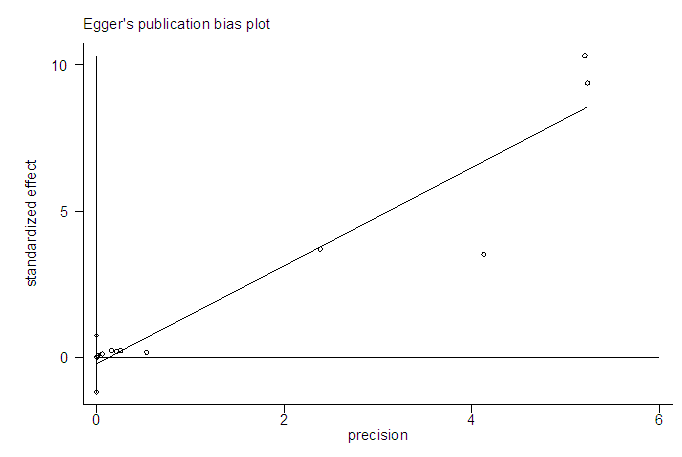 | Figure 3. Egger’s publication bias plot of rabies data |
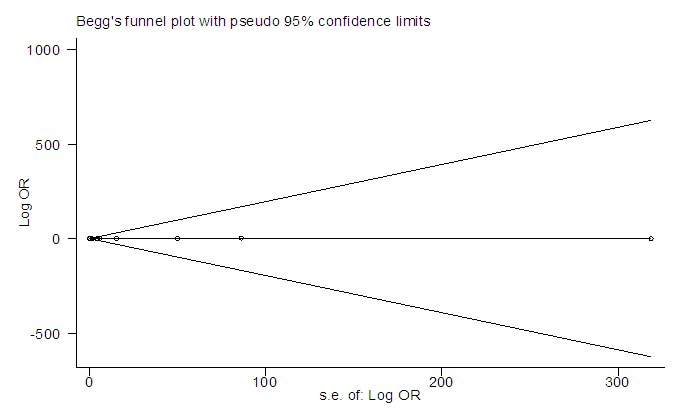 | Figure 4. Begg’s funnel plot of rabies data |
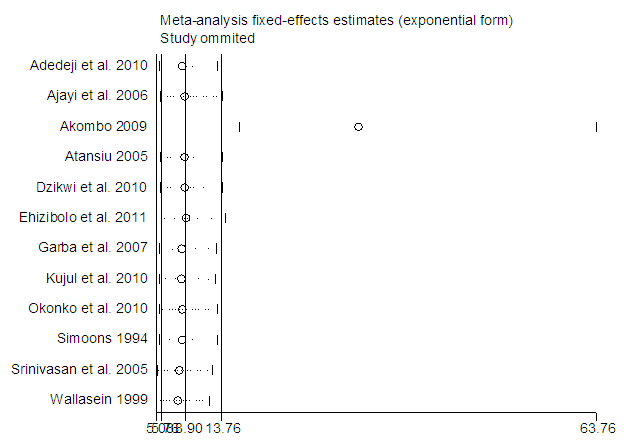 | Figure 5. Sensitivity analysis of rabies data |
In a sequential pattern, the MATLAB software, using the single imputation of mean method from the available values, the odd ratios were imputed before meta-analysis was carried out on 16 studies altogether. The meta-analysis resulted in I-Squared = 66.9%, p-value<0.001, with odds ratio = 5.4 in favour of mortality, at 95% confidence interval (3.36,8.67) (Figure 6).Egger’s test (Figure 7) detected the presence of bias, while Begg’s test (Figure 8) indicated the absence of bias. Sensitivity analysis (Figure 9) also showed that the [7] study may be a source of bias.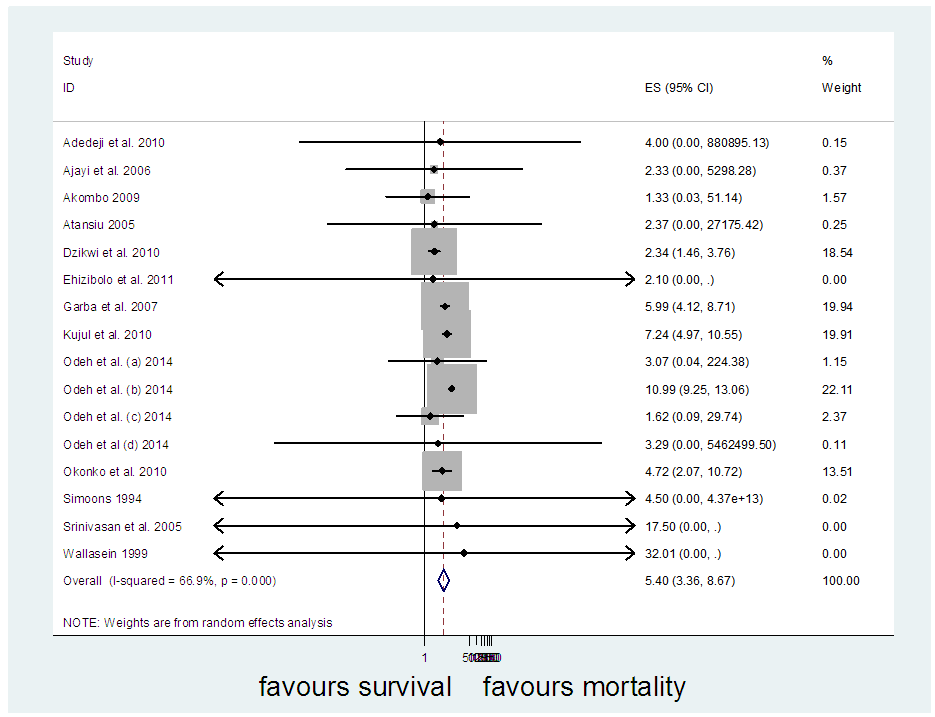 | Figure 6. Meta-analysis of 16 studies of rabies data |
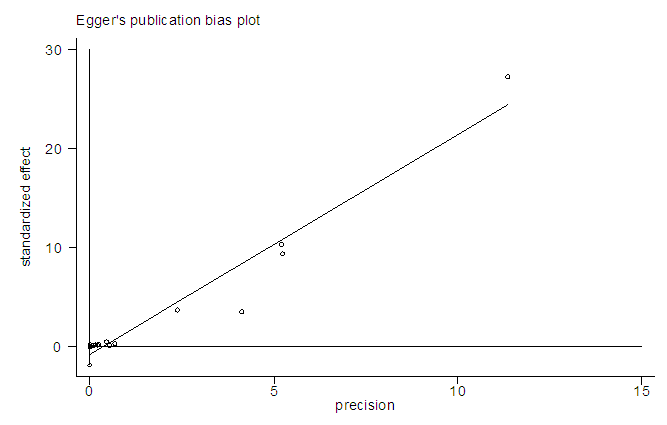 | Figure 7. Egger’s test of 16 studies of rabies data |
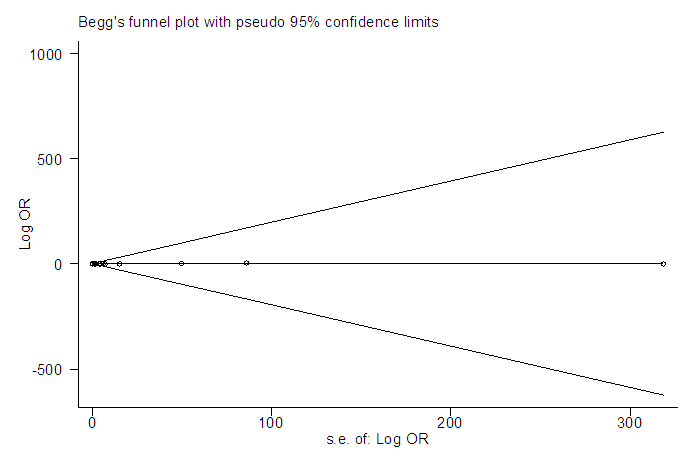 | Figure 8. Begg’s test of 16 studies of rabies data |
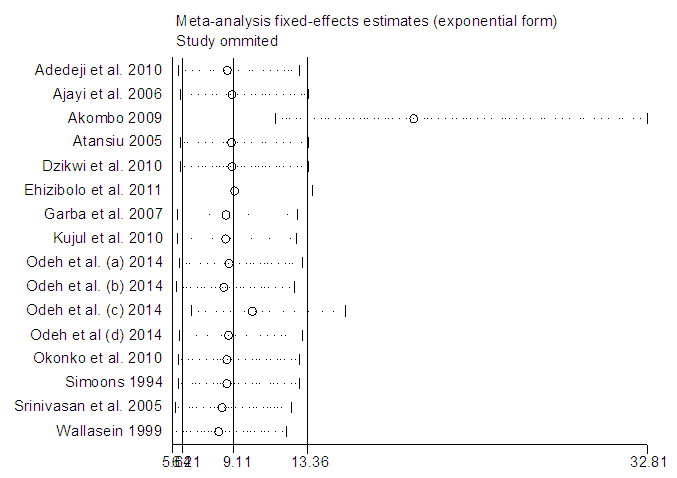 | Figure 9. Sensitivity analysis showing Akombo study as a source of bias |
The [7] study was excluded and and another meta-analysis was carried out (Figure 10). It yielded I-Squared = 68.4%, p-value<0.001, with odds ratio = 5.52 in favour of mortality at 95% confidence interval (3.42,8.9).Sensitivity analysis (Figure 11) showed [8] may be a source of bias & heterogeneity, after excluding it and meta-analysing, I-Squared = 69.9%, p-value<0.001, with odds ratio = 5.69 in favour of mortality (Figure 12), at 95% confidence interval (3.51, 9.23).Table 3 is a comparison of the meta-analysis of the 12 studies (Figure 2) versus that of 14 studies (Figure 12).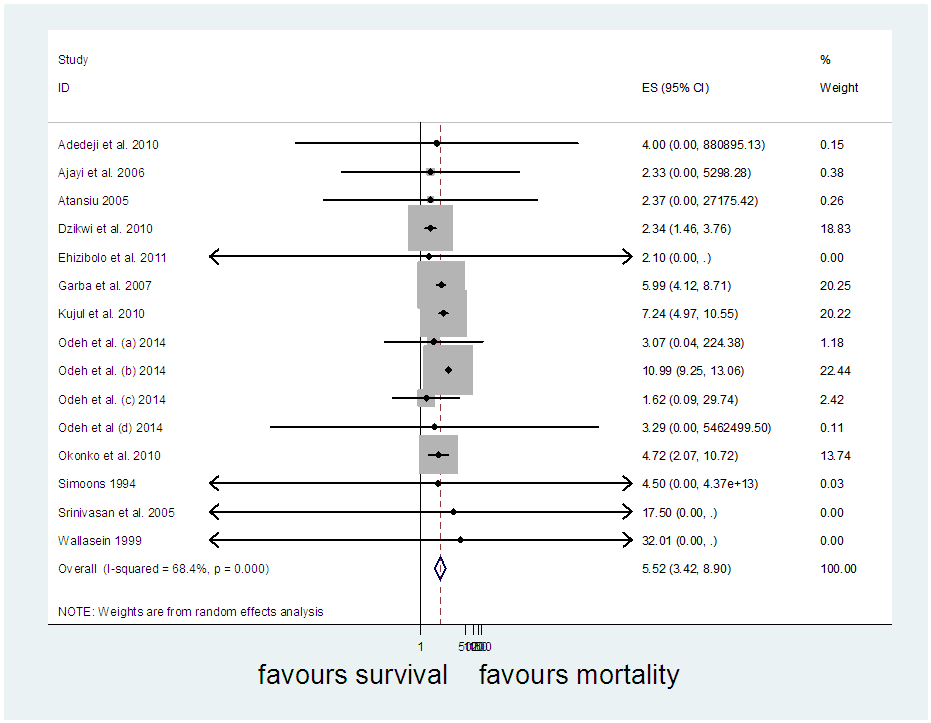 | Figure 10. Meta-analysis of 15 studies of rabies data |
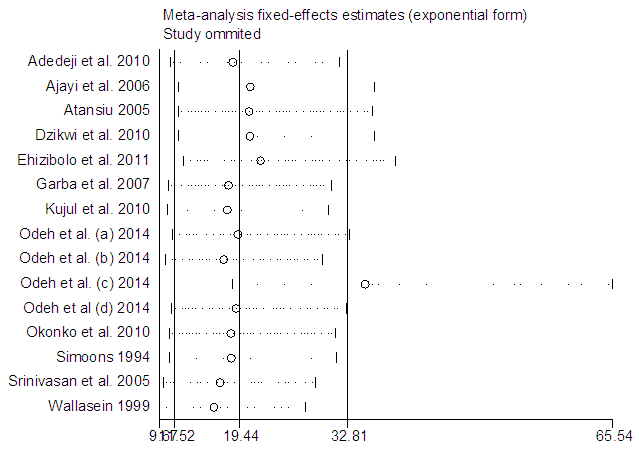 | Figure 11. Sensitivity analysis showing Odeh (c) 2014 study as source of bias |
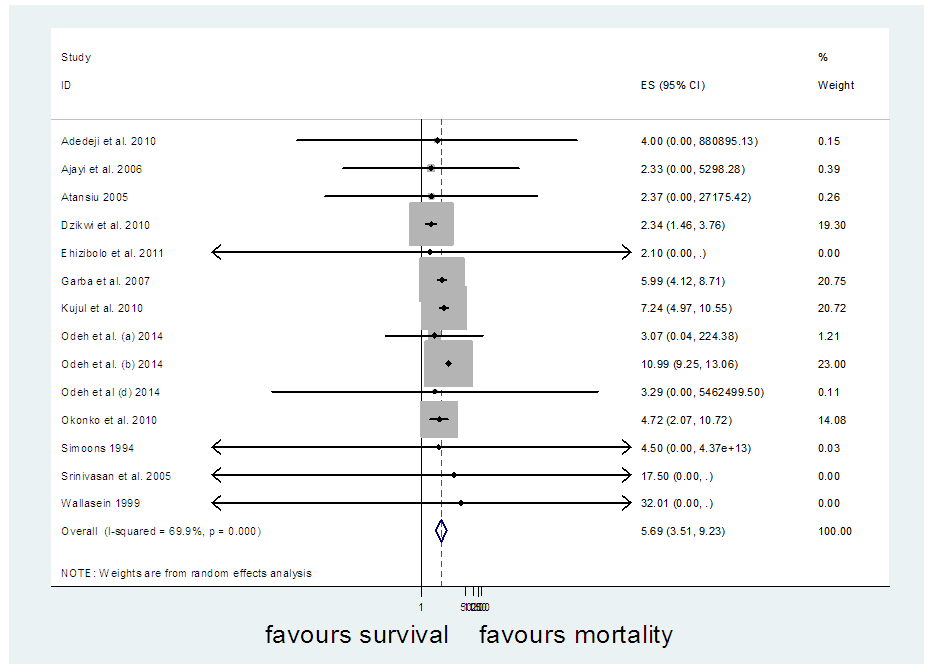 | Figure 12. Showing meta-analysis of 14 studies |
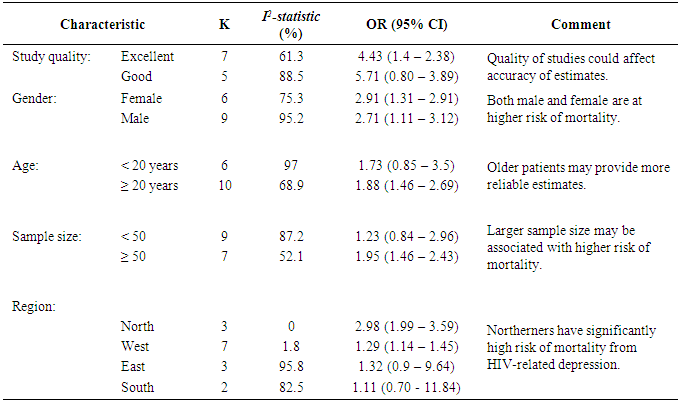
Table 2. Subgroup analyses to identify sources of methodological heterogeneity in rabies data
 |
| |
|
Table 3. Meta-analysis results on risk of mortality in persons exposed to rabies before & after imputing missing values
 |
| |
|
4. Discussion
Non-common events are characterized by missing data because the events occur in adverse situations that portends such. The application of the missing data statistical tool is an attempt to gather more studies for meta-analysis when non-common outcomes are involved. Treatment of such data as a complete frame is beneficial to the overall power of results.The alternative methods provided for the meta-analysis are easy to apply when rare events are involved. Most times, the number of studies, k, is small, as such, the t-test is recommended instead of the standard normal distribution.
5. Conclusions
In conclusion, meta-analysis of rare events poses difficulties such as incomplete data, heterogeneity etc. These problems may be tackled effectively using missing data mechanisms, sensitivity analysis and subgroup analysis. In this paper, sensitivity and subgroup analysis did not completely reduce heterogeneity, however, the power of the final summary effect measure is reliable, P-value<0.001. In the field of meta-analysis, non-common outcomes have been neglected in the past, probably because of some of the problems that were encountered in this research. Some of such problems include non-availability of data, presence of publication bias, few studies available, lack of statistical knowledge, case of missing data. An attempt has been made in this research to resolve some of the set-backs, with the hope that more researchers will survey the use of the techniques to meta-analyze non-common outcomes of primary studies.Downs and Black checklist items: 1- aims/objectives clearly outlined; 2- major outcomes clearly mentioned; 3- patients characteristics provided; 4- major findings clearly mentioned; 5-sample representative of population; 6- appropriate statistical tests done; 7- primary outcome valid; 8- were measures to curtail bias applied; 9- cases and controls recruited form same population; 10- cases and controls recruited over same time period; 11- adjustment for confounders done; 12- addressed lost to follow up.
References
| [1] | Adehi M. U., Yakasai A. M., Dikko H. G., Asiribo E. O., Dahiru T. (2017). Risk of Mortality in Patients with HIV and Depression: A Systematic Review and Meta-analysis of a Non-Common Outcome. International Journal of Statistics and Applications, Vol. 7(4): 205-214. |
| [2] | Srinivasan A., Burton E., Kuehnert M. J., Rupprecht. C. E., Sutker W. L., Ksiazek. T. G., Zaki, S. R. (2005). Transmission of Rabies Virus from an Organ Donor to Four transplant recipients. New England Journal of Medicine. 352, pp. 1103-1111. http://dx.doi.org/10.1056/NEJMoa043018. |
| [3] | Wallersein C. (1999). Rabies Cases Increase in Philippines. British Medical Journal. 318, pp. 1306. http://dx.doi.org/10.1136/bmj.318.7194.1306. |
| [4] | World Health Organization, International Classification of Diseases and Related Health Problems. 10th Revision. 2005, Geneva: WHO. |
| [5] | Downs S. and Black N. (1998). The Feasibility of Creating a Checklist for the Assessment of the Methodological Quality both of Randomized and Non-Randomized Studies of Healthcare Interventions. Journal of Epidemiology and Community Health. 52(1), pp. 377-384. |
| [6] | Brockwell S. E. and Gordon I. R. (2001). A Comparison of Statistical Methods for Meta- Analysis. Statistics in Medicine Journal; Vol. 20: 825-840. |
| [7] | Akombo P. M. (2009). Dog Ecology and Epidemiological Studies of Canine Rabies in Benue State, Nigeria. M.Sc Thesis, Ahmadu Bello University, Zaria. |
| [8] | Odeh L. E., Umoh J. U., & Dzikwi A. A. (2014). Assessment of Risk of Possible Exposure to Rabies among Processors and Consumers of Dog Meat in Zaria and Kafanchan, Kaduna State, Nigeria. Global Journal of Health Science. Vol. 6(1): 142-153. |
| [9] | Roderick J. A. & Donald B. R. (2002). Statistical Analysis with Missing Data, Second Edition. John Wiley & Sons, Inc., Hoboken, New Jersey, USA. Published simultaneously in Canada. ISBN 0-471-18386-5. |
| [10] | Borenstein M., Hedges L. V., Higgins P. T., Rothstein H. R. (2009). Introduction to MA. John Wiley & Sons, Ltd. |
| [11] | Enders and Craig. (2010). Applied Missing Data Analysis. Guilford Press: New York. |
| [12] | Adedeji A. O., Eyarefe O. D., Okonko I. O., Ojezele M. O., Amusan T. A., & Abubakar M. J. (2010). Why is there still rabies in Nigeria? A review of the current and future trends in the epidemiology, prevention, treatment, control and possible eradication of rabies. British Journal of Dairy Sciences. 1(1), pp. 10-25. |
| [13] | Ajayi B. B., Rabo J. S., & Baba S. S. (2006). Rabies in Apparently Healthy Dogs Histological and Immunohistochemical Studies. The Nigerian Postgraduate Medical Journal. 12, pp. 128-134. |
| [14] | Atanasiu P. (2005). Annual Inoculation and the Negri Body. In G.M. Baer (ed.), The natural history of rabies (pp. 373-400). New York, NY: Academic press Inc. http://dx.doi.org/10.1016/B978-0-12-072401-7.50025-3 |
| [15] | Dzikwi A. A., Umoh J. U., Kwaga J. K. P., & Ahmad A. A. (2010). Serological Surveillance for Non-Rabies Lyssa Viruses among Apparently Healthy Dogs in Zaria, Nigeria. Nigerian Veterinary Medical Journal. 31(3), pp. 214-218. |
| [16] | Ehizibolo D. O., Ehizibolo P. O., Ehizibolo E. E., Sugun M. Y., & Idachaba S. E. (2011). The Control of Neglected Zoonotic Diseases in Nigeria through Animal Intervention: An Overview. African Journal of Biomedical Research. 14(2), pp. 81-88. |
| [17] | Garba A., Oboegbulem S. I., Junaidu A. U., Lombin L. H., Makinde A. A., Elsa A. T., & Ogunsan A. E. (2007). Dogs the Principal Reservoir Host for Rabies in Nigeria: Current Report. Book of Proceedings of the Nigerian Veterinary Medical Association, 44th Annual congress, Delta 2007 (pp. 355-359). An addendum from 43rd NVMA Annual congress Minna, 2006. |
| [18] | Kujul N. N., Banyigyi S. A., Abechi A. S., & Moses G. D. (2010). Rabies in 5- Week Old Puppies in Jos, Plateau State, Nigeria. A Case Report. Researcher. 2(12), pp. 86-88. |
| [19] | Okonkwo, J. O., Adedeji, A. O., Eyarefe, O., Babalola, E. T., Amusa, T. A., & Amande, J. T. (2010). Why is there still rabies in Nigeria? A review of the current and future trends in the epidemiology, prevention, treatment, control and elimination. Electronic Journal of Environmental, Agriculture and Food Chemistry. Vol. 9(8), pp. 1283-1307. |
| [20] | Simoons F. J. (1994). Eat Not This Flesh; Food Avoidance from Prehistory to the Present (2nd ed., pp. 229). University of Wisconsin Press. |

 Abstract
 Reference
 Full-Text PDF
 Full-text HTML