-
Paper Information
- Paper Submission
-
Journal Information
- About This Journal
- Editorial Board
- Current Issue
- Archive
- Author Guidelines
- Contact Us
International Journal of Probability and Statistics
p-ISSN: 2168-4871 e-ISSN: 2168-4863
2017; 6(3): 45-50
doi:10.5923/j.ijps.20170603.02

Bayesian Multiple Comparisons Procedures for CRD in R Code
 Abstract
 Reference
 Full-Text PDF
 Full-text HTML
Paulo César de Resende Andrade, Luiz Henrique Cordeiro Rocha, Mariana Mendes da Silva
Instituto de Ciência e Tecnologia, Universidade Federal dos Vales Jequitinhonha e Mucuri, Diamantina, Brasil
Correspondence to: Paulo César de Resende Andrade, Instituto de Ciência e Tecnologia, Universidade Federal dos Vales Jequitinhonha e Mucuri, Diamantina, Brasil.
| Email: |  |
Copyright © 2017 Scientific & Academic Publishing. All Rights Reserved.
This work is licensed under the Creative Commons Attribution International License (CC BY).
http://creativecommons.org/licenses/by/4.0/

Procedures for multiple comparisons between treatment averages are of great interest in applied research. They are used to compare factor’s levels means, since the most popular tests show problems related to ambiguous results and to the control of the type I error rates, besides their performance are worst in heterocedastics and unbalanced cases. This work has as objective to implement two Bayesian alternatives for multiple comparisons proposed by Andrade & Ferreira (2010) for completely randomized design in R code, contemplating the possibility of analyzing homocedastic and heterocedastic cases, with or without balancing. The implementation was illustrated by an example. In addition, the results of the two tests were compared with those of the Tukey test. The implementation was done successfully, allowing more possibility of choice for the user.
Keywords: Multiple comparison procedures, Heteroscedasticity, Unbalanced
Cite this paper: Paulo César de Resende Andrade, Luiz Henrique Cordeiro Rocha, Mariana Mendes da Silva, Bayesian Multiple Comparisons Procedures for CRD in R Code, International Journal of Probability and Statistics , Vol. 6 No. 3, 2017, pp. 45-50. doi: 10.5923/j.ijps.20170603.02.
1. Introduction
- A common problem in science and also in industry is the comparison of the means of some treatments of interest, to determine which of these treatments differ from each other, if this difference exists (RAFTER et al, 2002). The most usual way to treat this problem is analysis of variance (ANOVA).Since the treatments of the fixed-effect test, the global F-test of ANOVA tests the hypothesis of equality between the population means of the treatments compared. If the F test is significant, with more than two treatments being qualitative, multiple comparison procedures (MCP) are then used to test the difference between the treatments (HOCHBERG & TAMHANE, 1987; HSU, 1996; BRETZ et al, 2010).MCP are statistical procedures that compare two or more means. There is a vast bibliography about them (HINKELMANN & KEMPTHORNE, 1987, HOCHBERG & TAMHANE, 1987; HSU, 1996; BRETZ et al, 2010). All comparisons of treatments are performed when MCP are used. They allow the analysis of differences between means after the conclusion of the experiment to detect possible groups in a set of levels of unstructured factors. The major problem with these tests is the ambiguity of the results, which makes interpretation difficult (MACHADO et al, 2005). This problem can be circumvented by alternative methods of clustering (SCOTT & KNOTT, 1974; CALINSKI & CORSTEN, 1985), but they have the disadvantage of being valid only under normality.A second problem, which does not less important, is the type I error control (HOCHBERG & TAMHANE, 1987; HSU, 1996). A common difference between MCP concerns how to measure type I error rates, which can be either by comparison or by experiment (STEEL & TORRIE, 1980; BENJAMINI & HOCHBERG, 1995). The performance varies with type I error rates and power, making it difficult to decide which MCP to use (DEMIRHAN et al, 2010).The MCP and the F test require that certain assumptions be satisfied - the samples should be randomly and independently selected; the residues must be normally distributed and the variances must be homogeneous (RAFTER et al, 2002). Because one or more of these assumptions may be violated for a given set of data, it is important to be aware of how this would impact an inferential procedure. The insensitivity of a procedure to one or more violations of its underlying assumptions is called its robustness. The first assumption is the least likely to be violated, because it is under the control of the researcher. If violated, neither the MCP nor the F-test are robust. Most of the procedures seem to be robust under moderate departures from normality in that the error rate per experiment will only be slightly higher than specified. Some MCP have been specifically developed to be used when the variances are not all equal. Many of the proposed procedures control the general risk of type I errors, but have little statistical power. Three procedures that have often been recommended are those developed by Game & Howell (1976), Dunnett C (1980), and Dunnett T3 (1980). These procedures control the overall risk of a type I error experimentally at approximately the level of nominal significance and have the best statistical power between the alternative solutions. Tamhane (1979) proposed two approximated approaches for the multiple comparisons with a control and all-pairwise comparisons when the variances are unequal. Demirhan et al (2010), Ramsey et al (2010) and Ramsey et al (2011) studied the influence of violations of assumptions of normality and homogeneity of variances on the choice of a multiple comparison procedure. Tamhane (1979), Chen & Lee (2011), Li (2012), Shingala & Rajyaguru (2015), Sarmah & Gogoi (2015) have also done studies on multiple comparison procedures for populations with unequal variances.Booststrap resampling methods can be used in studies of multiple comparisons of the means of one-factor levels in situations of heterogeneity of variances of normal or non-normal probabilistic models (KESELMAN et al, 2002).An alternative is the use of Bayesian procedures. A fair number of articles takes into account the problem of multiple comparisons from the Bayesian point of view (DUNCAN, 1965; WALLER & DUNCAN, 1969; BERRY, 1988; GOPALAN & BERRY, 1998; BERRY & HOCHBERG, 1999; SHAFFER, 1999; BRATCHER & HAMILTON, 2005; GELMAN et al, 2012). Andrade & Ferreira (2010) proposed Bayesian alternatives for multiple comparisons using a methodology based on a posteriori t multivariate distribution, contemplating the possibility of analyzing both cases of homogeneity and heterogeneity of variances, with and without balancing. The proposed alternatives were superior to the other procedures studied, in the simulated examples, because they controlled the type I error and presented a greater power. In addition to having advantages over conventional tests, in the sense that there isn't need for homogeneity of variances and data balancing, that is very significant from a practical point of view. Despite the superiority of the Bayesian alternatives, they weren't implemented which made it difficult to use them.Free programs, such as the R (R DEVELOPMENT CORE TEAM, 2017) program, are widely used to perform experiments analysis. In addition to being free, R has several packages for the most diverse areas and allows the user to create their own functions. In addition, it receives contributions from researchers from around the world in the form of packages, making a major development of the program and enabling solutions to real problems to be easily found or created by the researcher himself.Therefore, the objective of this article is to implement in R code, two Bayesian alternatives for multiple comparisons proposed by Andrade & Ferreira (2010), in the context of completely randomized designs, when the validity assumptions are satisfied, as well as when the assumptions are not met.
2. Methodology
- A function in code R (R DEVELOPMENT CORE TEAM, 2017) was programmed to perform two Bayesian tests presented by Andrade & Ferreira (2010) for the case of the completely randomized design. This function allows to analyze the experimental data considering the cases of homogeneity and heterogeneity of variances in models with normal distribution, in situations of balancing or not.For this, a sample of size n of the multivariate t distribution
 was generated, whose parameters are specified by:
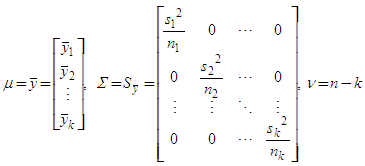 | (1) |
 k is the number of population means and
  is the covariance matrix of the means. From the posteriori multivariate t distribution, we were generate k chains of means
  , using the Monte Carlo method and assuming constant means, vector
 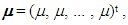 that is, all the same components. Thus, without loss of generality, it was assumed
  (for all k components), imposing the null hypothesis H0 in the Bayesian method.Following the generation of the standardized amplitude of the posteriori, under H0, and it was obtained in the posteriori distribution of the averages as follows:
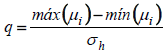 | (2) |
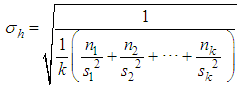 | (3) |
 considering all the pairs, it was obtained
 | (4) |
 was obtained as follows:
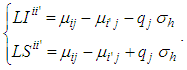 | (5) |
 we calculated the posterior probability of the intervals containing the value zero. Let
  be the indicator function to verify that the value zero belongs to the interval in the jth Monte Carlo sample unit of the a posteriori chain,
 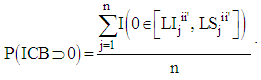 | (6) |
|
|
3. Results
- The Bayes function (N, alpha, file) receives three entries, N is the sample size to be simulated, alpha is the significance level and file the file with the experimental data.Initially the analysis of variance was performed and the assumptions of normality and homoscedasticity were verified.The mean vectors
 (Yb in the implemented function), the covariance matrix
  (Syb in the implemented function) and the degree of freedom ν (nu in the implemented function) for the multivariate t distribution generation were calculated from the experimental data, middle of the tpostmult function.
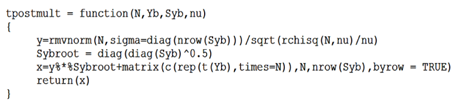 By means of the qpostbayes function k k means chains
  were generated, using the Monte Carlo method, imposing the null hypothesis H0 in the Bayesian method. The generation of the standardized amplitude of the posteriori was performed, under H0, from expressions (2) and (3).
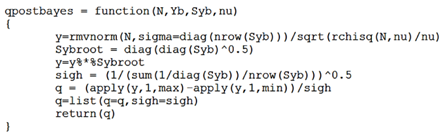 The inference about the hypothesis
 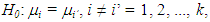 was made through two Bayesian tests (dbayes e pbayes).To test the hypothesis of equality of means by means dbayes test, we obtained the least significant difference Δ from the expression (4), delta function in the code.
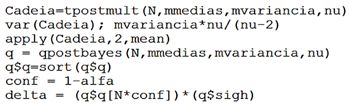 The differences were then compared with the delta value. For any amplitude greater than delta, the difference is considered significantly different from zero, that is, there is difference between the treatments of that pair.
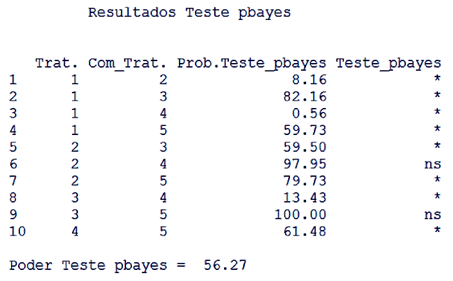
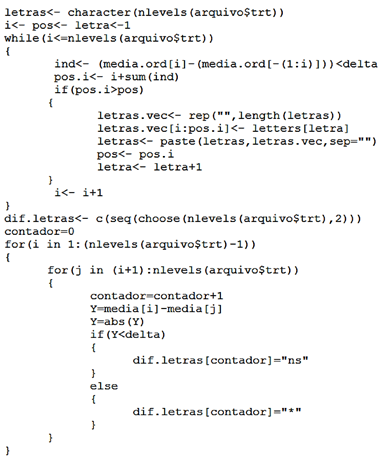 To test the hypothesis of equality of means by means of the pbayes test, we used the limits generated from equation (5) and calculated the posterior probability of the intervals containing the value zero, according to equation (6). There isn't difference between the pair of means for probabilities greater than 95% of zero being in the ranges.
 The power the pbayes test was calculated.
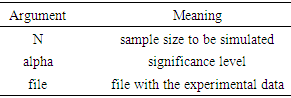
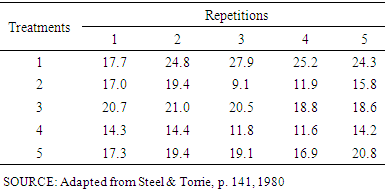
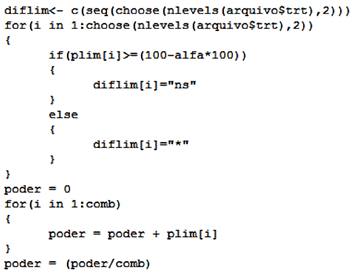 The implementation of the function is illustrated by the example cited in materials and methods, using N = 10000, alpha = 0.05 and file as the experimental data of Table 2, which should be inserted in R (R DEVELOPMENT CORE TEAM, 2017) according to Figure 1.
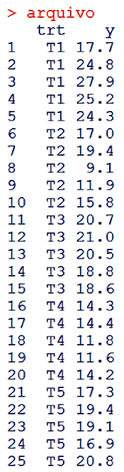 | Figure 1. Format in which the data must be inserted in the R |
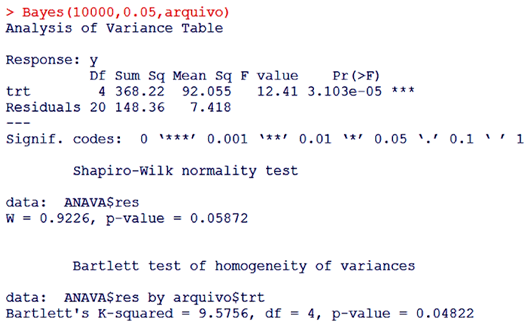 | Figure 2. Interface with variance analysis, Shapiro-Wilk normality test and Bartlett's variance homogeneity test |
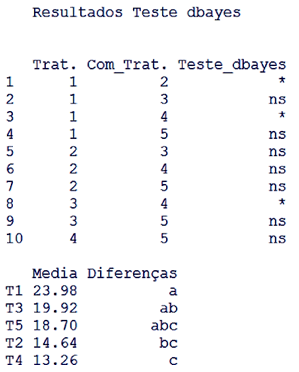 | Figure 3. Output for the dbayes test, ns indicates non-significant and * significant at 5%. Averages followed by the same letter in the column do not differ by 5% probability by the dbayes test |
 | Figure 4. Output to the pbayes test with its power. ns indicates not significant and * significant at 5% |
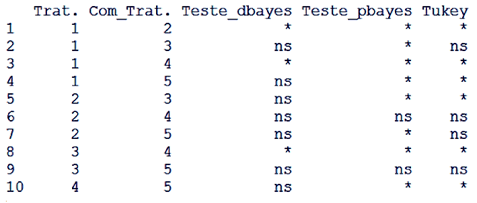 | Figure 5. Comparison between the tests proposed with Tukey |
4. Conclusions
- The implementation of the two Bayesian alternatives (dbayes and pbayes tests) for multiple comparisons proposed by Andrade & Ferreira (2010) was done successfully. The two tests can be performed in software R (R DEVELOPMENT CORE TEAM, 2017), in the context of completely randomized designs, when the validity assumptions are satisfied, as well as when the assumptions are not satisfied.Selecting an appropriate multiple comparison procedure requires extensive evaluation of the available information on the status of each test. Information on the importance of type I errors, power, computational simplicity, and so on, are extremely important to the selection process. In addition, selecting an appropriate multiple comparison procedure depends on data that conforms to validity assumptions. Routinely selecting a procedure without careful consideration of available and alternative information can severely reduce the reliability and validity of results.Thus, the implementation of these two tests provides another possibility of choice for the user. The intention is to incorporate the functions developed in an R package and test their performances for other designs and analysis schemes.