| [1] | Alavi, S.M.R. and Chinipardaz, R. (2009): Form-invariance under weighted sampling, Statistics, 43, 81 – 90. |
| [2] | Barlow, R.E. and Proschan, F. (1981): Statistical Theory of Reliability and Life Testing, Silver Spring, MD. |
| [3] | Correa, J.A. and Wolfson, D.B. (2007): Length-bias: some Characterizations and applications, Journal of Statistical Computation and Simulation, 64, 209 – 219. |
| [4] | Cullen, M.J., Walsh, J., Nicholson, L.V., and Harris, J.B. (1990): Ultrastructural localization of dystrophin in human muscle by using gold immunolabelling, Proceedings of the Royal Society of London, 20, 197-210. |
| [5] | Ducey, M.J. (2009): Sampling trees with probability nearly proportional to biomass, For. Ecol. Manage., 258, 2110 – 2116. |
| [6] | Ducey, M.J. and Gove, J.H. (2015): Size-biased distributions in the generalized beta distribution family, with applications to forestry, Forestry- An International Journal of Forest Research. 88, 143 – 151. |
| [7] | Drummer, T.D. and MacDonald, L.L. (1987): Size biased in line transect sampling, Biometrics, 43, 13 – 21. |
| [8] | Fisher, R.A. (1934): The effects of methods of ascertainment upon the estimation of frequencies, Ann. Eugenics, 6, 13 – 25. |
| [9] | Ghitany, M.E. and Al-Mutairi, D.K. (2008): Size-biased Poisson-Lindley distribution and Its Applications, Metron - International Journal of Statistics, LXVI (3), 299 – 311. |
| [10] | Gove, J.H. (2000): Some observations on fitting assumed diameter distributions to horizontal point sampling data, Can. J. For. Res., 30, 521 – 533. |
| [11] | Gove, J.H. (2003): Estimation and applications of size-biased distributions in forestry. In Modeling Forest Systems. A Amaro, D. Reed and P. Soares (Eds), CABI Publishing, pp. 201 – 212. |
| [12] | Hogg, R.V., Mckean, J.W. and Craig, A.T. (2005): Introduction to Mathematical Statistics, 6th edition, Pearson Prentice hall, New Jersey. |
| [13] | Keith, L.B. and Meslow, E.C. (1968): Trap Response by snowshoe hares, Journal of Wildlife Management, 20, 795- 801. |
| [14] | Lappi, J. and bailey, R.L. (1987): Estimation of diameter increment function or other tree relations using angle-count samples, Forest science, 33, 725 – 739. |
| [15] | Lindley, D.V. (1958): Fiducial distributions and Bayes theorem, Journal of the Royal Statistical Society, 20 (1), 102- 107. |
| [16] | McDonald, J.B. (1984): Some generalized functions for the size distribution of income, Econometrics, 52, 647 – 664. |
| [17] | Patil, G.P. (1981): Studies in statistical ecology involving weighted distributions. In Applications and New Directions, J.K. Ghosh and J. Roy (eds). Proceeding of Indian Statistical Institute. Golden Jubliee, Statistical Publishing society, pp. 478 – 503. |
| [18] | Patil, G.P. and Ord, J.K. (1976): On size-biased sampling and related form-invariant weighted distributions, Sankhya Ser. B, 38, 48 – 61. |
| [19] | Patil, G.P. and Rao, C.R. (1977): The Weighted distributions: A survey and their applications. In applications of Statistics, Ed P.R. Krishnaiah, 383 – 405, North Holland Publications Co., Amsterdam. |
| [20] | Patil, G.P. and Rao, C.R. (1978): Weighted distributions and size-biased sampling with applications to wild-life populations and human families, Biometrics, 34, 179 – 189. |
| [21] | Rao, C.R. (1965): On discrete distributions arising out of methods of ascertainment In: Patil, G.P. (eds) Classical and Contagious Discrete Distributions. Statistical Publishing Society, Calcutta, 320 – 332. |
| [22] | Sankaran, M. (1970): The discrete Poisson-Lindley distribution, Biometrics, 26, 145- 149. |
| [23] | Scheaffer, R.L. (1972): Size-biased sampling, Technometrics, 14, 635 – 644. |
| [24] | Shanker, R. (2015): Shanker distribution and Its Applications, International Journal of Statistics and Applications, 5(6), 338 – 348. |
| [25] | Shanker, R. (2016): The discrete Poisson-Shanker distribution, Jacobs Journal of Biostatistics, 1(1), 1 – 7. |
| [26] | Shanker, R., Hagos, F. and Abrehe, Y. (2015): On Size –Biased Poisson-Lindley Distribution and Its Applications to Model Thunderstorms, American Journal of Mathematics and Statistics, 5 (6), 354 – 360. |
| [27] | Singh, S.K. and Maddala, G.S. (1976): A function for the size distribution of incomes, Econometrica, 44, 963 – 970. |
| [28] | Van Deusen, P.C. (1986): Fitting assumed distributions to horizontal point sample diameters, For. Sci., 32, 146 -148. |

 Abstract
 Reference
 Full-Text PDF
 Full-text HTML

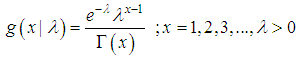
 follows a lifetime distribution named Shanker distribution introduced by Shanker (2015) having probability density function (p.d.f.)
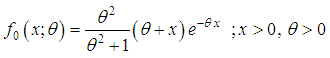
 has original probability distribution
 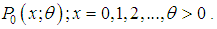 Suppose the sample units are weighted or selected with probability proportional to some measure
  where
where  is a positive integer. Then the corresponding size-biased probability distribution of order
  can be defined by its probability mass function
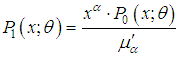 where
where 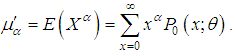 If
If  then the distribution is known as simple size-biased and is applicable for size-biased sampling in sampling theory. If
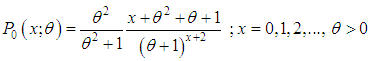
  , then the distribution is known as area-biased distribution and is applicable for area-biased sampling in forestry.The p.m.f. of the size-biased Poisson-Shanker distribution (SBPSD) with parameter
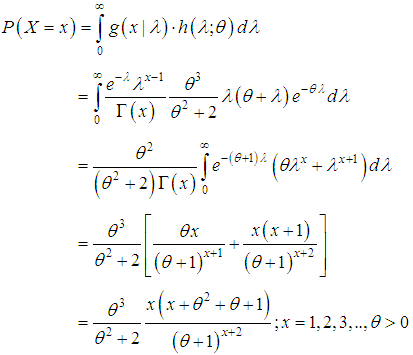
  can thus be be obtained as
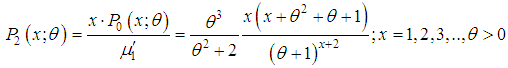
 is the mean of the Poisson-Shanker distribution (PSD) with p.m.f. (1.1).Recall that the probability mass function of size-biased Poisson-Lindley distribution (SBPLD) with parameter
  obtained by Ghitany and Mutairi (2008), is given by
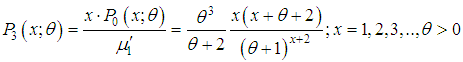


 follows size-biased Shanker distribution (SBSD) with p.d.f.
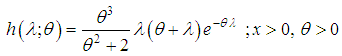
 Taking
  in place of
  we get
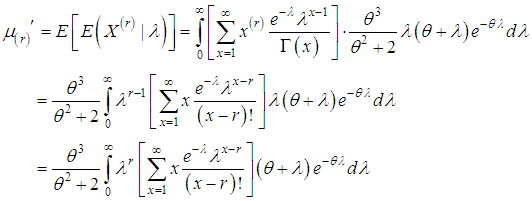
 and 4 in (2.1), first four factorial moments about origin can be obtained and then using the relationship between factorial moments about origin and moments about origin, the first four moments about origin of SBPSD (1.3) can be obtained as
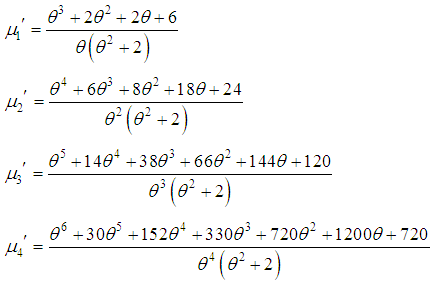 Again using the relationship between moments about mean and the moments about origin, the moments about mean of the SBPSD (1.3) are obtained as
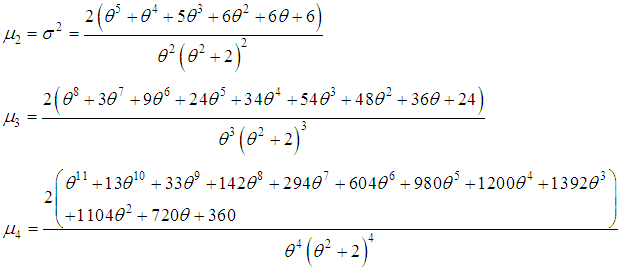 The coefficient of variation
  coefficient of Skewness
 coefficient of Kurtosis
  and index of dispersion
  of the SBPSD (1.3) are thus obtained as
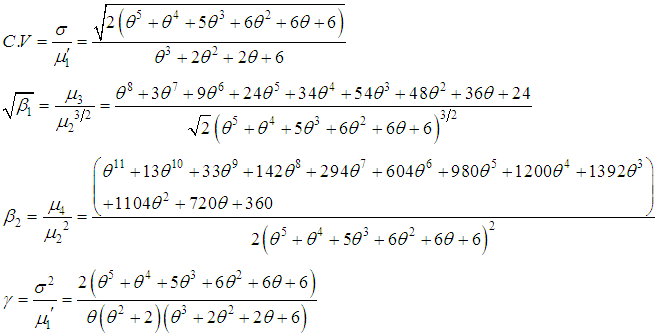 It can be easily verified that SBPSD is over-dispersed
  equi-dispersed
  and under-dispersed
  for
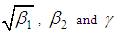
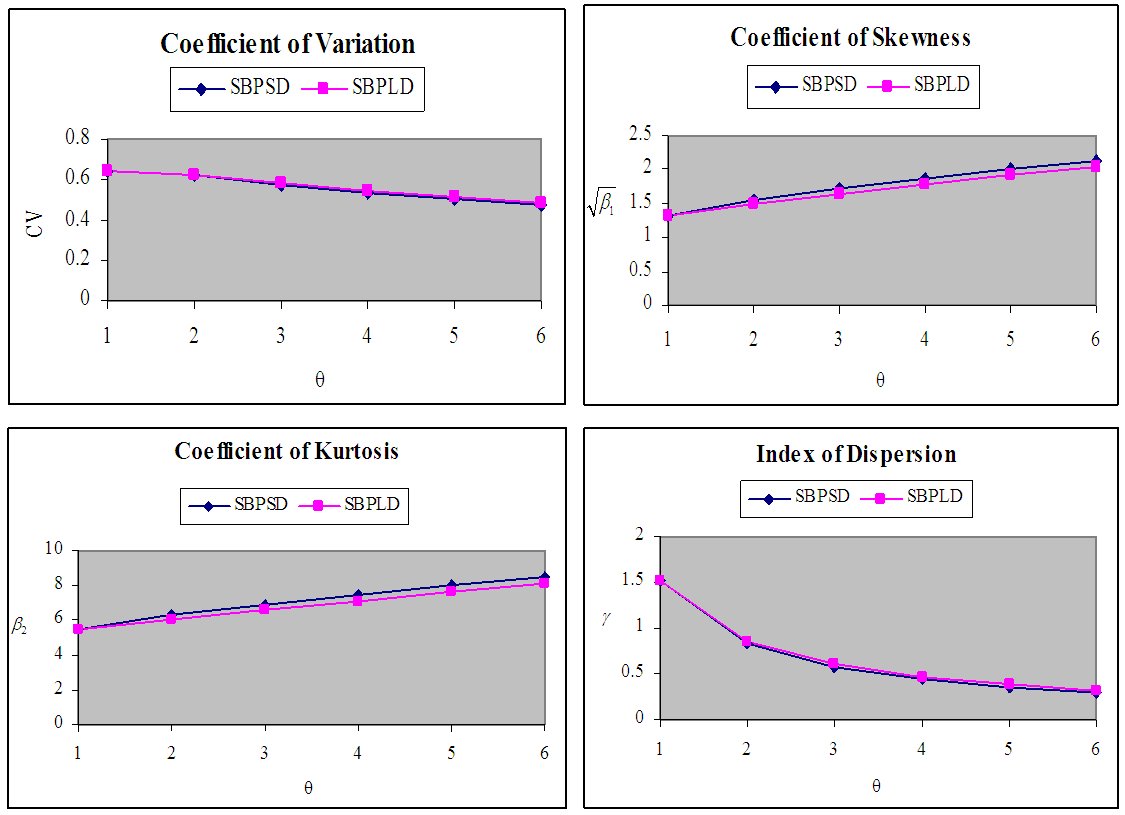
for 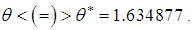 The graphs of coefficient of variation, coefficient of skewness, coefficient of kurtosis, and index of dispersion of SBPSD for varying values of parameter
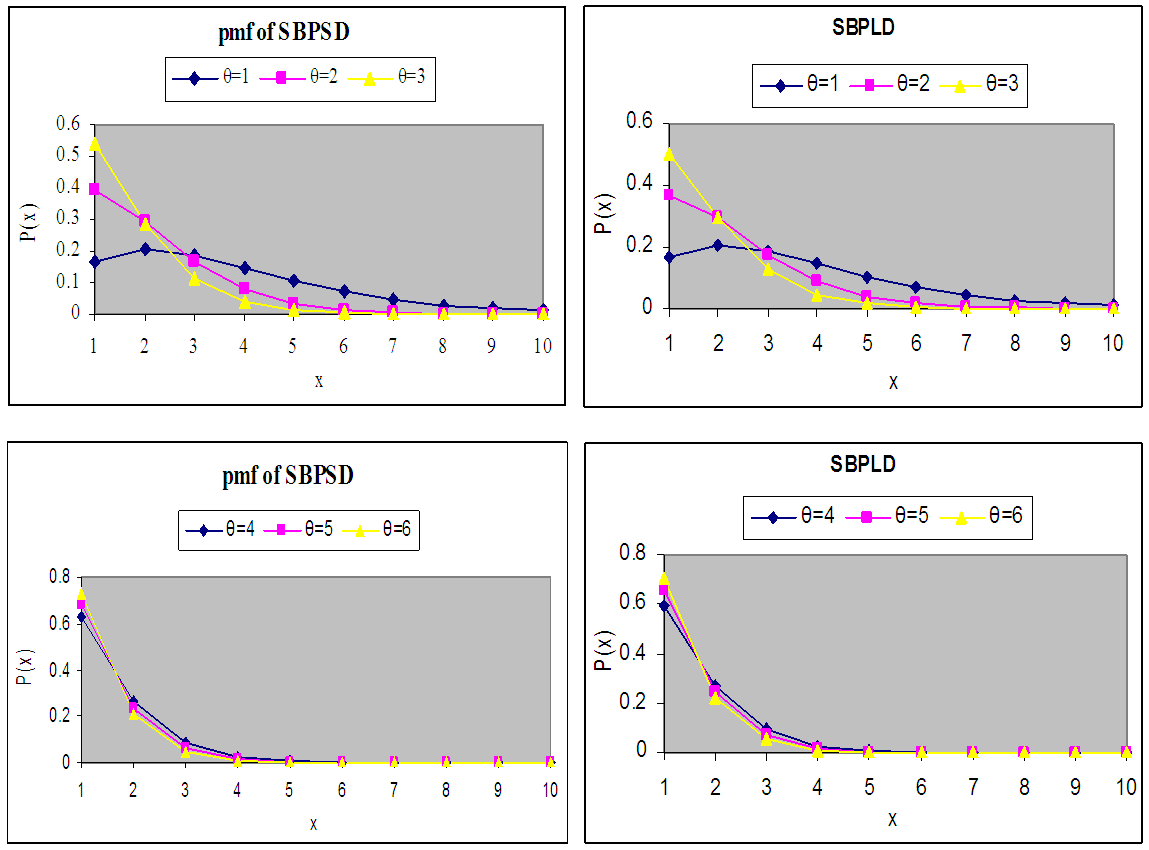
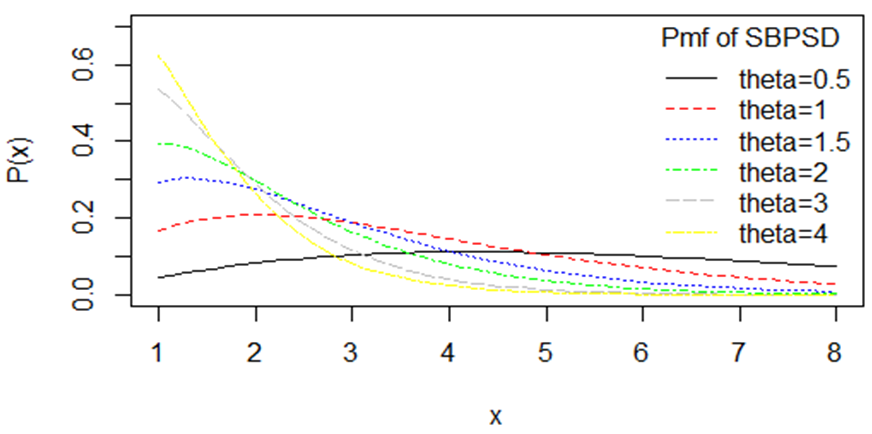
  are shown in figure 3.
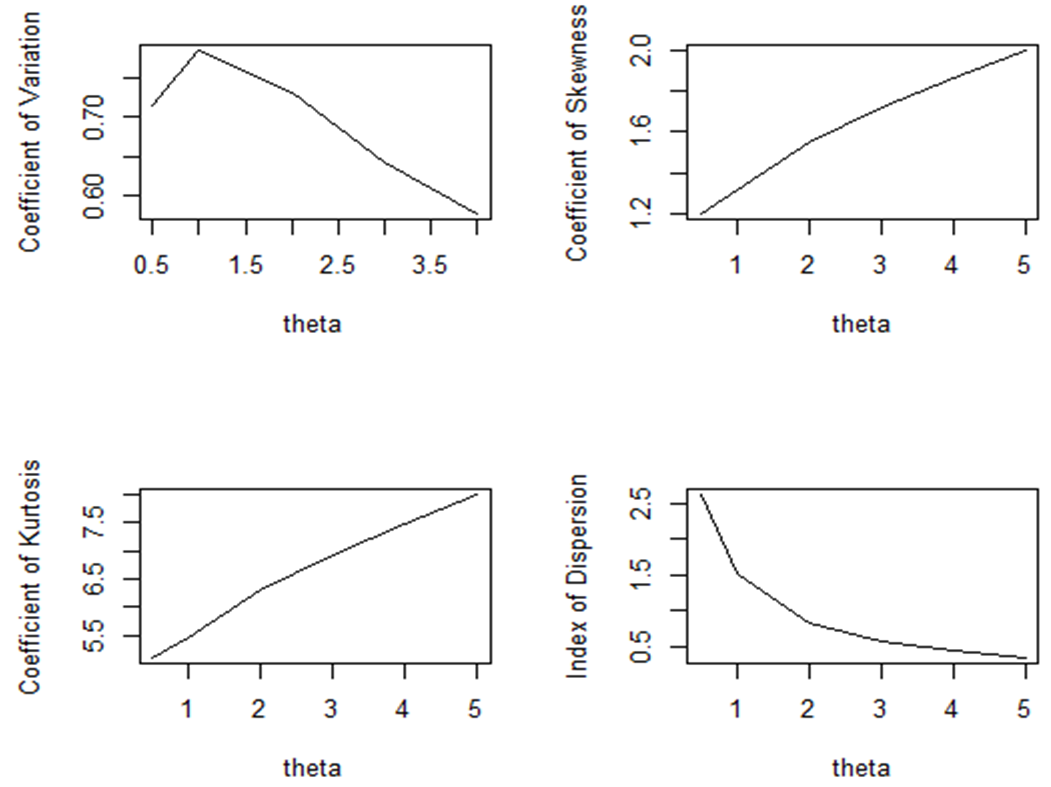
 of the SBPSD for varying values of parameter
 and
and  has been prepared for varying values of the parameter
  and presented in table 1.
 of SBPSD and SBPLD for varying values of the parameter θ
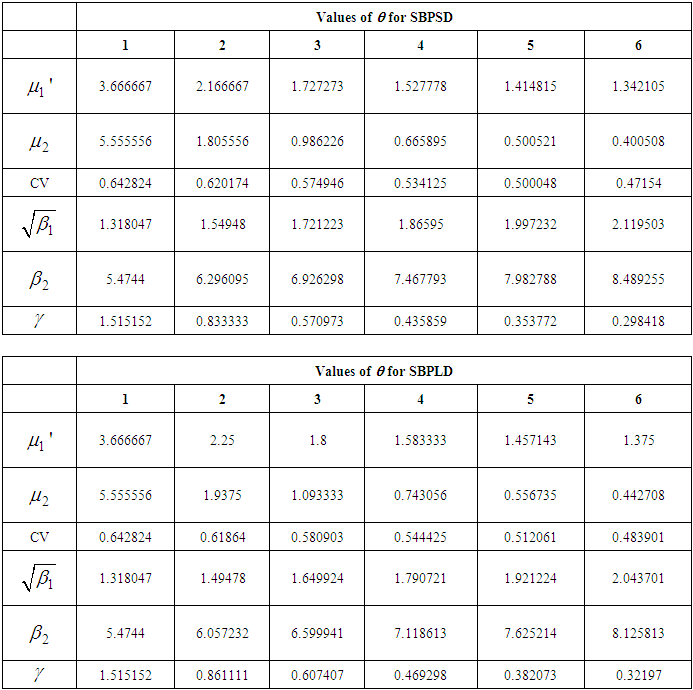
 of the SBPSD and SBPLD for varying values of parameter
 is a deceasing function of
  is log-concave. Therefore, SBPSD is unimodal, has an increasing failure rate (IFR), and hence increasing failure rate average (IFRA). It is new better than used in expectation (NBUE) and has decreasing mean residual life (DMRL). Detailed discussion and definitions of these aging concepts can be seen in Barlow and Proschan (1981).
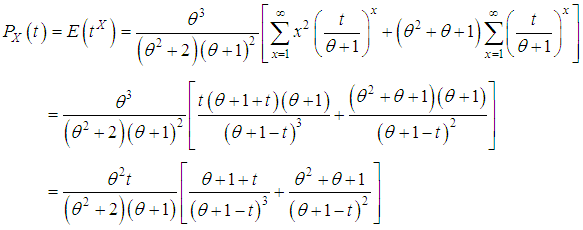 Moment Generating Function: The moment generating function of the SBPSD (1.3) is given by
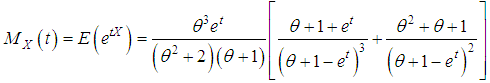
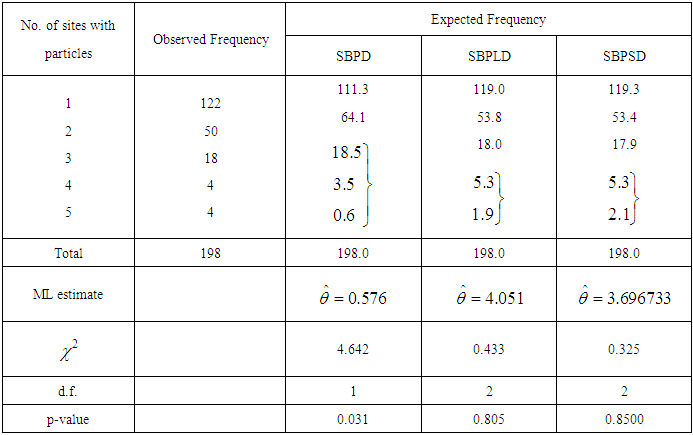
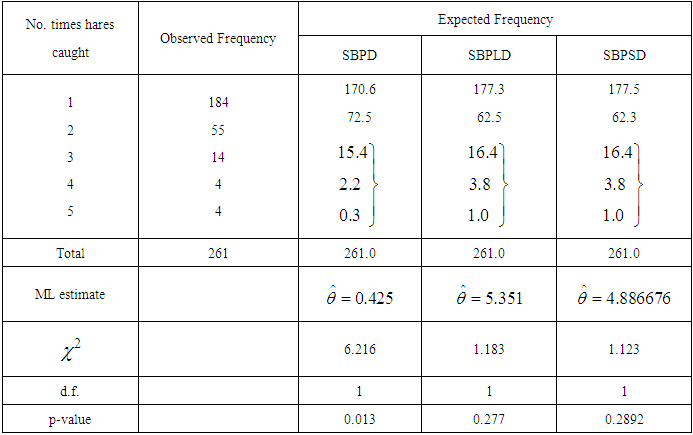
 be a random sample of size n from the SBPSD (1.3) and let
  be the observed frequency in the sample corresponding to
 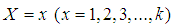 such that
  where
where  is the largest observed value having non-zero frequency. The likelihood function
  of the SBPSD (1.3) is given by
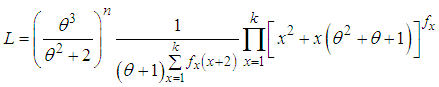 The log likelihood function is obtained as
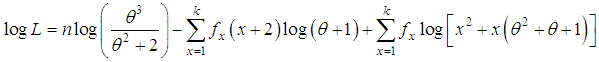 The first derivative of the log likelihood function is given by
 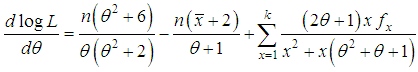 where
where  is the sample mean.The maximum likelihood estimate (MLE),
  of
of  is the solution of the equation
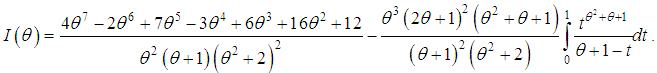
  and is given by the solution of the non-linear equation
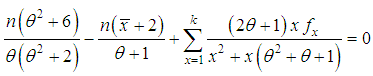
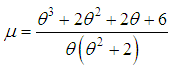
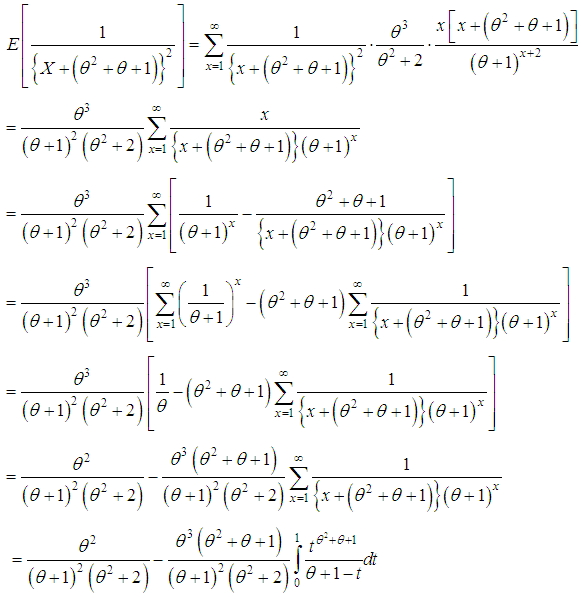
 of
of  of the SBPSD is consistent and asymptotically normal. That is,
 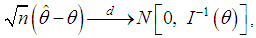 where
where 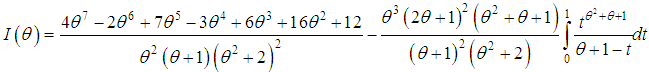 is the Fisher’s information about
  Proof: The SBPSD satisfies the regularity conditions under which the ML estimator
  of
of  is consistent and asymptotically normal [see Hogg et al (2005), chapter 6]. Finally, we have
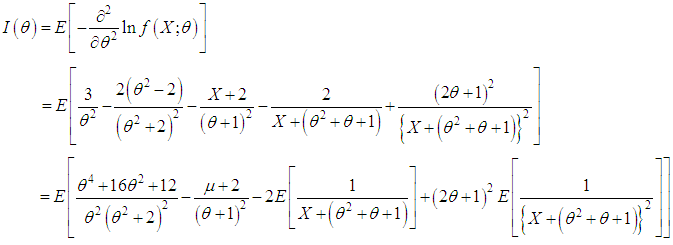

 4.2. Method of Moment Estimate (MOME): Let
  be a random sample of size n from the SBPSD (1.3). Equating population mean to the corresponding sample mean, the MOME
  of
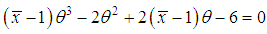
of  of SBPSD is the solution of the following cubic equation in
 is the sample mean.