-
Paper Information
- Paper Submission
-
Journal Information
- About This Journal
- Editorial Board
- Current Issue
- Archive
- Author Guidelines
- Contact Us
International Journal of Probability and Statistics
p-ISSN: 2168-4871 e-ISSN: 2168-4863
2017; 6(2): 20-32
doi:10.5923/j.ijps.20170602.02

The Effects of Addition of nc Center Points on the Optimality of Box-Benhken and Box-Wilson Second-Order Designs
 Abstract
 Reference
 Full-Text PDF
 Full-text HTML
Iwundu M. P.
Department of Mathematics and Statistics, University of Port Harcourt, Port Harcourt, Nigeria
Correspondence to: Iwundu M. P., Department of Mathematics and Statistics, University of Port Harcourt, Port Harcourt, Nigeria.
| Email: |  |
Copyright © 2017 Scientific & Academic Publishing. All Rights Reserved.
This work is licensed under the Creative Commons Attribution International License (CC BY).
http://creativecommons.org/licenses/by/4.0/

Relationships between optimal design properties and changing sizes of designs, by the addition of center points, are seen to be very strong between the Box-Benhken designs and the Box-Wilson designs defined at  and
and  Variations seem to exist with Box-Wilson designs defined at α = 1.0. In particular, the determinant values of the information matrices of the Box-Benhken designs generally decrease as
  increases. These are also true for all categories of the Box-Wilson designs. However, the minimum eigenvalue of the Box-Benhken design and the Box-Wilson design defined at
  and
and  is maximized when
  and maximized when
  for the Box-Wilson design defined at α = 1.0. For the Box-Benhken designs considered, the trace values of the variance-covariance matrices generally decrease as
  increases. This is also true for the Box-Wilson designs defined at
  and
and  For the Box-Wilson designs defined at α = 1.0, the trace values of the variance-covariance matrices increase as
  increases. The maximum scaled predictive variances associated with the Box-Benhken designs and the Box-Wilson designs generally increase as
  increases and minimized when
  for Box-Wilson design defined at
  and when
  for the Box-Benhken design and the Box-Wilson design defined at
  and
and  The trace of information matrix associated with all considered design types consistently decreases as
  increases.
Keywords: Box-Benhken designs, Box-Wilson designs, Center Point, Optimality constants
Cite this paper: Iwundu M. P., The Effects of Addition of nc Center Points on the Optimality of Box-Benhken and Box-Wilson Second-Order Designs, International Journal of Probability and Statistics , Vol. 6 No. 2, 2017, pp. 20-32. doi: 10.5923/j.ijps.20170602.02.
Article Outline
1. Introduction
- Two popularly used Response Surface Methodology (RSM) designs in modeling second order effects are the Box-Benhken and Box-Wilson designs. Each of them has less number of experimental runs when compared with the three-level full factorial designs. The Box-Benhken design abbreviated BBD was introduced by Box and Benhken (1960) and constitutes an alternative to the Box-Wilson design (otherwise called Central Composite Design (CCD)) introduced by Box and Wilson (1951). Although some categories of the Box-Wilson designs are not rotatable, Box-Benhken designs are a class of rotatable or near-rotatable second-order designs based on three-level incomplete factorial designs. They are formed by combining two-level factorial designs with incomplete block design in a particular fashion. They are designs introduced for second-order models in order to limit the growing sample size as the number of model parameters increases. When compared with the CCDs, the BBDs have the advantage of reduced design points. In general, the number of design points of the BBDs is
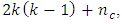 where
where  is the number of factors and
  is the number of center points. On the other hand, the number of design points of the CCDs is
 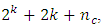 where
where  remains the number of factors and
  remains the number of center points. The CCDs can be studied for
  however, the BBDs do not exist for
  and can be studied for
  In the simplest case of
  the number of design points of the Box-Benhken design is 12 plus
  center points and the number of design points of the central composite design is 14 plus
  center points. For
  the number of design points of the Box-Benhken design is 24 plus
  center points and the number of design points of the central composite design is 24 plus
  center points. For
  the number of design points of the Box-Benhken design is 40 plus
  center points and the number of design points of the central composite design is 42 plus
  center points. For
  the number of design points of the Box-Benhken design is 60 plus
  center points and the number of design points of the central composite design is 76 plus
  center points. The advantage in reduced design size becomes more pronounced as
  increases beyond seven. For instance, when
  , the number of design points of the Box-Benhken design is 180 plus
  center points and the number of design points of the central composite design is 1,044 plus
  center points. Myres et.al (2009) observed that in many scientific studies that require Response Surface Methodology, researchers are inclined to require three evenly spaced factor levels of which Box-Benhken design is an efficient option and an important alternative to the central composite design Box-Benhken designs like some central composite designs are spherical and do not deviate substantially from being rotatable. Many standard ways of comparing designs, ranging from the use of numeric values to graphs, exist in Response Surface Methodolgy. Lucas (1976) compared Response Surface designs by their D- and G-efficiency values. A Box-Benhken design has been compared with a Uniform shell design of Doehlert (1970) in Crosier (1993). It was seen that the Box-Benhken design exhibited a very high G-efficiency value of 98.9% as against 59.7% of the Uniform shell design. Also, Box-Benhken design gave a better prediction at the perimeter of the design region while the Uniform shell design gave a better prediction near the center of the design region. Although the Uniform shell design generally requires fewer runs then CCDs and BBDs, they are not widely used in fitting second-order model. Crosier (1993) further compared the performance of three-factor central composite design having
  center points with the three-factor Box-Benhken design having
  center points. The Box-Benhken design performed better near the design center while the central composite design performed better near the perimeter. Zolgharnein et.al (2013) carried out a comparative study of Box-Benhken, central composite and Doehlert matrix for multivariate optimization. Practical applications of Box-Benhken and Central Composite designs are numerous (see e.g Tekindal et.al (2012), Igder et.al (2012), Zolgharnein et.al (2013) and Sabela et.al (2014)). In this work, the effects of addition of
  center points on the optimality of Box-Benhken and Box-Wilson second-order designs shall be the focus. The aim is to see how increasing the number of center runs added to Box-Benhken and Box-Wilson designs affects A-, D-, E-, G- and T-optimality values for the designs.
2. Methodology
- For a p parameter polynomial in k factors, each k-factor, N-point Box-Benhken and Box-Wilson second-order response surface design, written as an Nxk matrix, shall be studied for changes in A-, D-, E-, G- and T-optimality values when the center points,
 are increased. To estimate the parameters (coefficients) of the second-order polynomial, the matrix of the design shall be expanded into an Nxp model matrix having one column for each parameter of the polynomial model. The moment matrix or information matrix of the design shall be obtained. In order to compare designs of varying sizes, the information matrix shall be normalized to remove the effect of the varying design sizes. Although Myres et.al (2009) recommends the use of three to five center runs, this study shall consider
  Three categories of the Box-Wilson design shall be investigated alongside the Box-Benhken design. The categories of Box-Wilson design are the central composite designs with respective axial distance
  and
and 
 where
where  The designs shall be assessed with respect to statistical criteria, namely, A-, D-, E-, G- and T-optimality criteria, which are related to the variance-covariance matrix of the model parameter estimator. The chosen optimality criteria are commonly encountered in literatures on optimal design of experiment. Rady et al. (2009) presented a survey on these optimality criteria as well as the relationships among them. As in literature, by A-optimality, a design in which the sum of the variances of the model coefficients is minimized is sought. It is defined as
  where Min implies that minimization is over all designs and tr represents trace. By D-optimality, a design in which the determinant of the moment matrix
  is maximized over all designs is sought. Where
  represents the model matrix associate with the D-optimal design and
  represents its transpose. The criterion of D-optimality equivalently minimizes the determinant of
  By E-optimality criterion, a design which maximizes the minimum eigen value of M or equivalently minimizes the maximum eigen value of
  is sought. By E-optimality, a design which minimizes the maximum variance of all possible normalized linear combination of parameter estimates is sought. E-optimality criterion is defined by
 where
where  and
and  represent minimum eigen value and maximum eigen value, respectively. By G-optimality, a design which minimizes the maximum scaled prediction variance in the region of the design is sought. It is defined by
 By T-optimality, a design which maximizes the trace of the information matrix is sought. It is defined as
  where Max implies that maximization is over all designs and tr represents trace. The second-order model to consider is the complete model having main effects, interaction effects and quadratic effects and is given as
 To effectively compare the designs, the information matrix of any given design shall be normalized. By normalization, the effect of changing sample size shall be removed. In studying the effects of addition of
  center points on the optimality of the BBDs and CCDs, we shall consider
  , whose design sizes are moderately small and relatively close.
 3. Results
- The results of the investigation regarding the effects of center point on optimality of Box-Behnken and Box-Wilson designs are contained in Table 1. The first column entries on the table show the design type. The second column entries on the table show the number of controllable factors of experimentation. The third column entries on the table show the number of model parameters associated with the k variable model. The columns under Optimality Constant represent values obtained using A-, D-, E-, G- and T-optimality criteria. The design matrices are built from the designs and the models. For an illustration, assuming Box-Behnken design in k=3 variables, the associated 10-parameter model is

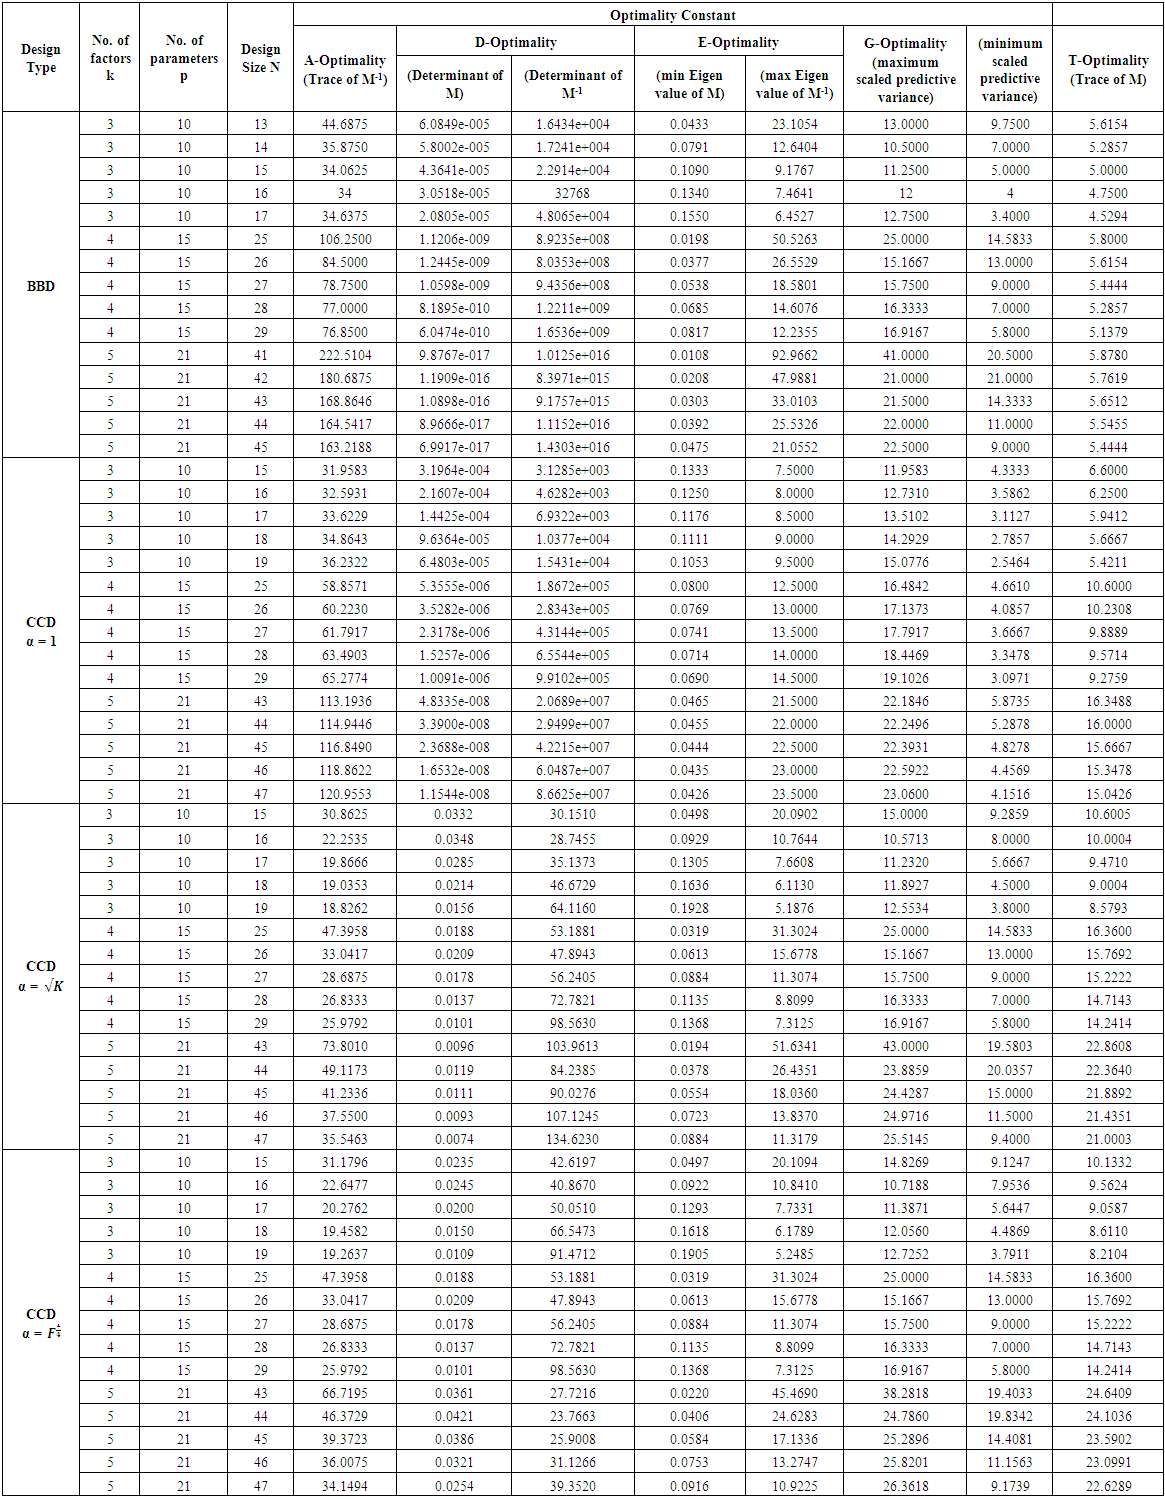 | Table 1. Optimality Constants for the BBD and CCD |
 is
is 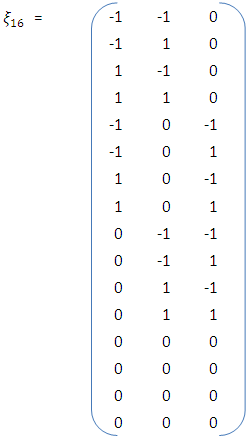 With the model and the 16-point design, the associated model matrix is
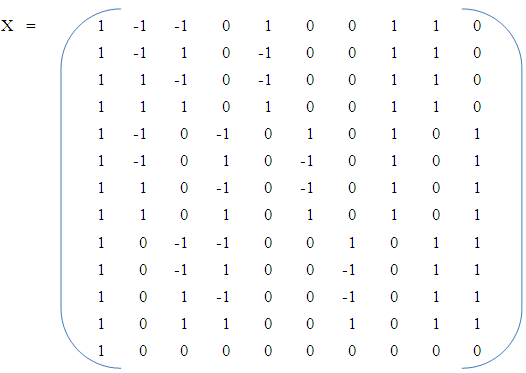 The corresponding normalized information matrix is
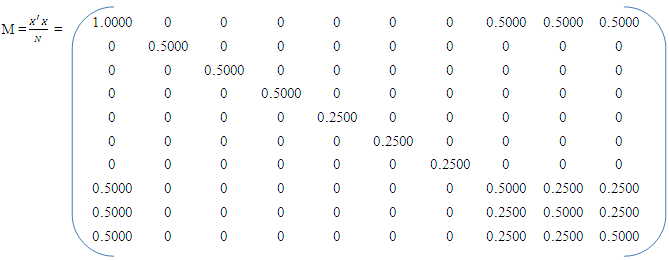 and its inverse matrix is
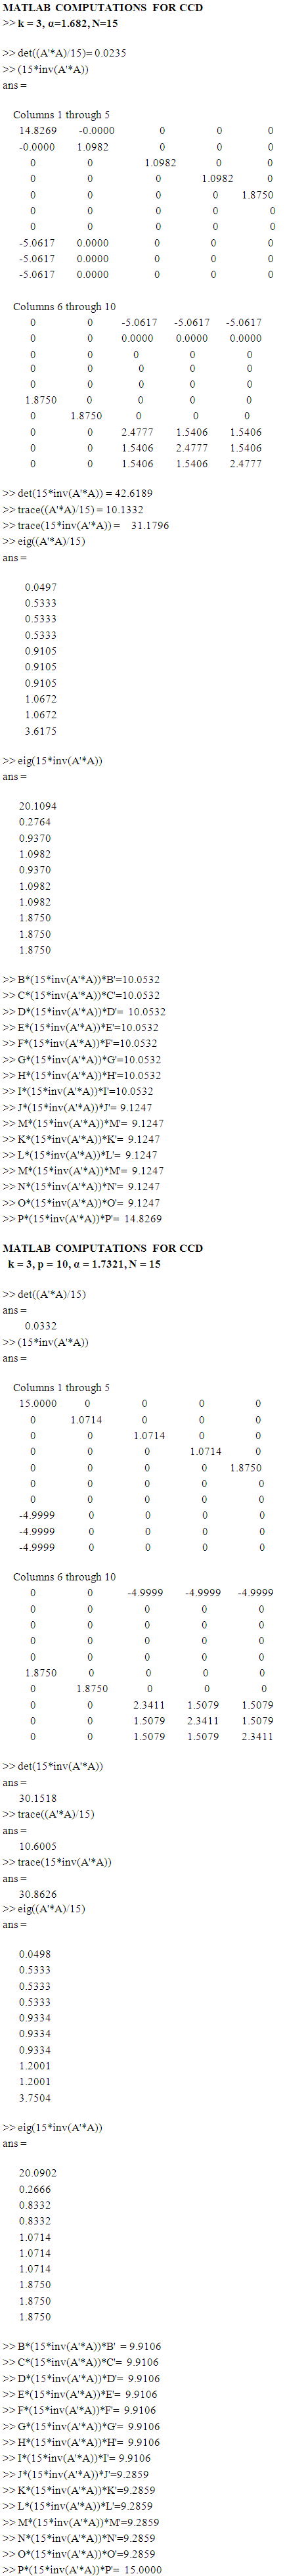
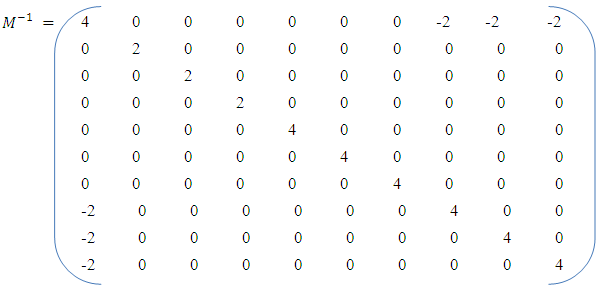 The determinant value of information matrix is 3.0518e-005.The determinant value of its inverse matrix is 32768.The trace of the information matrix is 4.7500.The trace of its inverse matrix is 34.The eigenvalues of the information matrix are 0.1340 0.2500 0.2500 0.2500 0.2500 0.2500 0.5000 0.5000 0.5000 1.8660The eigenvalues of the inverse matrix are 0.5359 2.0000 2.0000 2.0000 4.0000 4.0000 4.0000 4.0000 4.0000 7.4641Each point of the design, apart from the center point, has variance of predicted value of 12.0. The variance of predicted value at the center point is 4.0. Each design follows these unique presentations for defined k, p and N. MATLAB R2007b was used in all computations and the results are as presented in Table 1. The MATLAB outputs for BBD, k= 5, p=21, N=43, CCD, k = 3, α =1.682, N=15 and k = 3, p = 10, α = 1.7321, N = 15 have been included in the Appendix. Presentation for only three categories is purely for space management.
4. Discussion of Results
- The results on the effects of addition of
 center points on the optimality of Box-Benhken and Box-Wilson second-order designs show some interesting relationships. For the Box-Benhken designs considered, the trace of the variance-covariance matrix generally decreases as
  increases, thus showing a negative linear relationship. This is also true for the central composite designs defined at
  and
and  For the central composite design defined at α = 1.0, the trace of the variance-covariance matrix increases as
  increases, thus showing a positive linear relationship. Trace of the variance-covariance matrix for the three-variable Box-Benhken design is minimized when
 For the four-variable Box-Benhken design, trace of the variance-covariance matrix is minimized when
  and for the five-variable Box-Benhken design, trace of the variance-covariance matrix is minimized when
  For the central composite design defined at
  the trace of the variance-covariance matrix is minimized when
  However, for the central composite design defined at
  and
and  the trace of the variance-covariance matrix is minimized when
  On D-optimality criterion, the determinant of the information matrix of the Box-Benhken design generally decreases as
  increases. Equivalently, the determinant of the variance-covariance matrix of the Box-Benhken design generally increases as
  increases. These are also true for all categories of the central composite design. For all cases considered, the determinant of information matrix is maximized at
  except for the three-variable Box-Benhken design where the determinant of information matrix is maximized at
  The minimum eigenvalue of the Box-Benhken design and the central composite design defined at
  and
and  is maximized when
  and maximized when
  for the central composite design defined at α = 1.0. The maximum scaled predictive variance associated with the Box-Benhken designs and the Box-Wilson designs generally increases as
  increases and minimized when
  for CCD defined at
  when
when  for CCD defined at
  and
and  and the Box-Benhken design. For the three-variable 10-parameter Box-Benhken design, the minimum variance equals 10.5 which is approximately close to the number of model parameters. For the four-variable 15-parameter Box-Benhken design, the minimum variance equals 15.1667 which is approximately close to the number of model parameters. For the five-variable 21-parameter Box-Benhken design, the minimum variance equals 21.0 which is exactly the number of model parameters. The closeness of the minimum variance of prediction to the number of model parameter associated with the CCDs defined at
  was not obvious, however for CCDs defined at
  and
and  and for k=3 and k=4, near approximations exist. As in the literature, maximum value of the predictive variance equal tp or approximately equal to the number of model parameters show that the corresponding design is rotatable or near-rotatable. The trace of information matrix associated with all considered design types consistently decreases as
  increases. Generally, the relationships between addition of center points and the optimality properties are very strong between the Box-Benhken designs and the central composite design defined at
  and
and  This is most likely due to the sphericity and rotatabilty properties of the three design types.
5. Conclusions
- The effects of addition of
 center points on the optimality of Box-Benhken and Box-Wilson second-order designs have been investigated. Relationships are seen to exist between optimal design properties and changing size of the designs by the addition of center points. The relationships are very strong between the Box-Benhken designs and the central composite design defined at
  and
and  Variations seem to exist with central composite designs defined at
Appendix