K. Hamidi Machekposhti 1, H. Sedghi 1, A. Telvari 2, H. Babazadeh 1
1Department of Water Sciences and Engineering, Science and Research Branch, Islamic Azad University, Tehran, Iran
2Civil Engineering Department, Islamic Azad University, Ahvaz, Iran
Correspondence to: H. Sedghi , Department of Water Sciences and Engineering, Science and Research Branch, Islamic Azad University, Tehran, Iran.
| Email: |  |
Copyright © 2016 Scientific & Academic Publishing. All Rights Reserved.
This work is licensed under the Creative Commons Attribution International License (CC BY).
http://creativecommons.org/licenses/by/4.0/

Abstract
Different methods are employed in applying probability distribution in hydrology. The most common among these methods is the Probability Distribution method. In this study in order to determine suitable probability distribution for estimating of annual discharge series with different return periods, annual peak, maximum and mean discharges with a 58 years time period had been collected from Karkheh River (Jelogir Majin and Pole Zal stations in upstream of Karkheh Dam) in Khuzestan province at Iran. After outlier, homogeneity and adequacy test, data has analyzed by SMADA software and residual sum of squares (R.S.S). The best probability distribution selected according to SMADA output and R.S.S results. Log Pearson type III with R.S.S (145.91) and with R.S.S (13.67) for annul peak discharge and Log Pearson type III with R.S.S (145.91) and with R.S.S (13.67) for annul maximum discharge in Jelogir Majin and Pole Zal stations respectively, also Pearson type III and then Log Pearson type III with R.S.S (7.55 & 7.8) and R.S.S (0.79 & 0.8) demonstrated the most fitting for annual mean discharge in Jelogir Majin and Pole Zal stations respectively.
Keywords:
Probability Distribution, Log Pearson Type III, SMADA, Karkheh River
Cite this paper: K. Hamidi Machekposhti , H. Sedghi , A. Telvari , H. Babazadeh , Determination of Suitable Probability Distribution for Annual Discharges Estimation (Case Study: Karkheh River at Iran), International Journal of Probability and Statistics , Vol. 5 No. 3, 2016, pp. 73-81. doi: 10.5923/j.ijps.20160503.02.
1. Introduction
In hydrology cannot determinate time of phenomenon occurrence such as floods or discharge but can investigate previous events occurrence procedure and obtain their mean probability of occurrence. Calculation of mean probability of occurrence or floods mean return periods can help to solve many problems. For example, in the flood control projects calculated the annual mean flood damage and also design of structures dimension such as dam spillway conducts with regard to probability of floods occurrence and discharges related to them [11]. The information and data were recorded in the past will help to us until obtain some statistic parameters and then will forecast events that may occur in the future. In hydrology use of physical models not possible for future events forecasting and most use the single models that system describes based on mathematical terms and concepts. One of current methods in discharge estimation with different return periods is statistical distributions [3]. Frequency analysis of floods and precipitation extreme values, the magnitude of this phenomenon and also their frequency give appropriate information for different analysis such as determination of risk criterions and reliability in the design of structures. This analysis provides this possible until the frequency value of events that are more than their observational value estimated during the period of data record. This estimate can be expressed using the concept of event return period [5]. Theoretically, there are different probability functions that were recorded and measurement tentative. Function that has more consistent with the desired data will select as a probability distribution until can obtain hydrology variable value per each probability from it [1]. Several researches have conducted about probability distributions [2, 6, 8, 9, 10, 12, 14]. Bedustani in the research of types of frequency distributions for forecasting maximum floods values found that appropriate statistical distribution for 10-35 years data series is three parameters Log-normal distribution and for long data series more than 35 years is Log Person type III distribution [4]. Vogel and Fennrssy have done a study in 91 regions in Australia and their results showed that extreme values, pareto, Log Person type III and two parameters Log-normal distributions were suitable [13]. Khosravi et al. Determinate of Suitable Probability Distribution for Annual Mean and Peak Discharges Estimation in Minab River at Iran and they find Log Person type III distribution is suitable for annual mean and peak discharge [7]. More research was done on flood flows and manuscripts about mean and minimum flows are not comparable with floods series [10].For the water balance project for a region uses mean discharges whereas the water balance computation by use of maximum discharges more shows region water volume. It is important to find the best probability distribution in hydrology to design environment system/ planning including residential areas, industrial areas, and land to cultivate. This paper has the very unique topic which can be used in Iran widely. In every year several flood occurs in studied stations (upstream of Karkheh dam) that caused damage to houses and agricultural lands and etc. in study area. Flood control is one of the reasons construction Karkheh dam in downstream of stations. We can determine the extent of the floods until reduce this damages in area.In this research to obtain statistical distributions in discharges series with different return period, peak and maximum and also annual mean discharges from Karkheh River (Jelogir Majin and Pole Zal in upstream of Karkheh dam, Khuzestan province, Iran) was collected during 58 years period and after outlier test, homogeneity test and statistical adequacy were compared and evaluated by use of SMADA software graphical test and Residual sum of squares (R.S.S).
2. Data and Methodology
2.1. Study Area
Karkheh River in Khuzestan province with 900 km in length, it is known as the third long river in Iran, is formed from connecting Kashkan and Saymareh rivers. Statistical analysis of flows passing from Karkheh River shows that although the numbers of the year (especially in recent years) extremely reduce the water flow but it never reaches to zero and therefore Karkheh River is a perennial river. Jelogir Majin and Pole Zal stations (upstream Karkheh dam) are located between latitudes 31° 48׳ and 34° 58׳ N and longitudes 46° 57׳ and 49° 10׳ E. Upstream watershed area is 51.000 square kilometers and located at elevation of 1216 meters above sea level. This stations has equipment and Statistics relate to this stations are as well as evaluated. Figure (1) shows the study area location. | Figure 1. The study area location |
2.2. Study Method
In this study was collected peak and maximum and also annual mean discharges data during 1958-1959 until 2015-2016 periods from Iran Water Resources Management Company (IWRMC). We used annual mean discharge instead of daily, weekly, monthly discharges because our aim is checking discharge in annual period. If we can estimate the annual discharge on a stream (which we usually can from rainfall–drainage area relations, or from a water budget), then we can reduce flood damages in the area with different methods.Using of data must have three conditions of adequacy, accuracy and relevance was controlled mentioned stations data. For this purpose with regard to possible deficiencies in the statistics mentioned stations discharges, first, deficiencies of peak and maximum and also annual mean discharges was controlled, reconstructed and prolonged and data homogeneity was tested by Run Test method eventually and statistics were confirmed in 95% confidence level. We did W.R.C (Water Resources Council) method to find the outliers of data series too. The all data series during 58 year (1958 until 2015) were suitable for estimation. In order to access this discharges changes with different return periods were used theoretical probability distributions. It provides to estimate the water potential of mentioned river with different return periods.A return period is an estimate of the likelihood of an event, such as an earthquake, flood or ariver discharge flow to occur. It is a statistical measurement typically based on historic data denoting the average recurrence interval over an extended period of time, and is usually used for risk analysis (e.g. to decide whether a project should be allowed to go forward in a zone of a certain risk, or to design structures to withstand an event with a certain return period).The theoretical return period is the inverse of the probability that the event will be exceeded in any one year (or more accurately the inverse of the expected number of occurrences in a year). The estimated return period is a statistic: it is computed from a set of data (the observations), as distinct from the theoretical value in an idealized distribution. Return period is useful for risk analysis (such as natural, inherent, or hydrologic risk of failure). When dealing with structure design expectations, the return period is useful in calculating the riskiness of the structure.In this study annual Peak and maximum and also mean discharges statistics during period estimated by use of SMADA software and the most suitable of statistical distributions were determined with comparison of observational and predicted data. For determining the most suitable statistical distributions, the distribution is appropriate that has the best fitting with predicted values. One of the methods of selecting the best distribution and fitting values is Residual sum squares (R.S.S) for each distribution. R.S.S calculates using equation (1).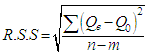 | (1) |
Where Qe is predicted value for each data, Qo is observed value for each data, n is number of data and m is number of distribution parameter that it is two parameters for Normal and two parameters Log-normal and Gumbel Extremal type I distributions and it is three parameters for Pearson type III and Log Pearson type III and three parameters Log-normal distributions. The distribution will be suitable that has lowest R.S.S value and it selects for data determination with desired return period [11].
3. Results and Discussion
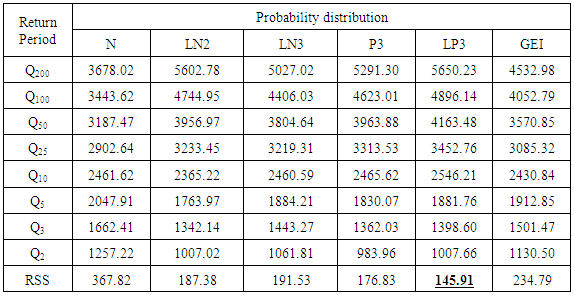
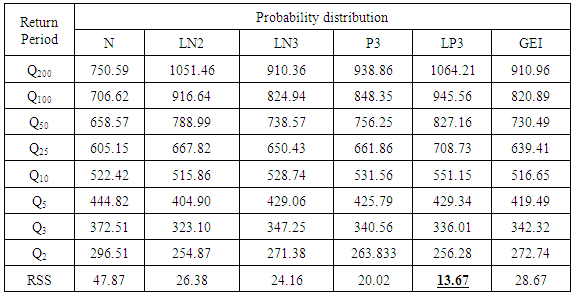
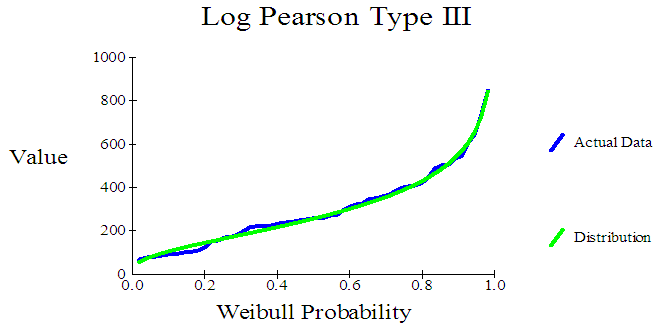
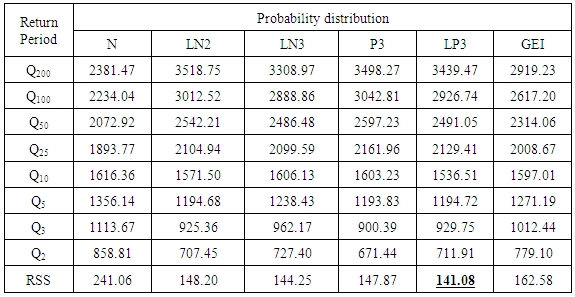
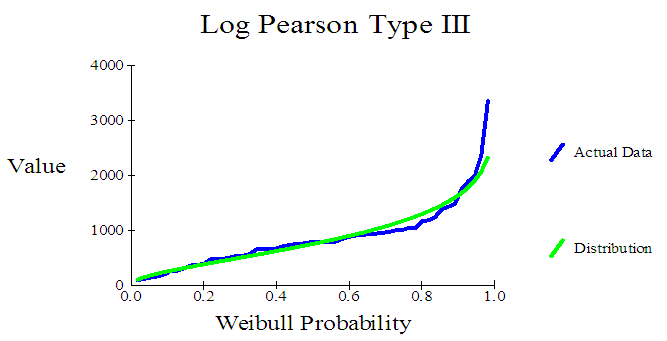
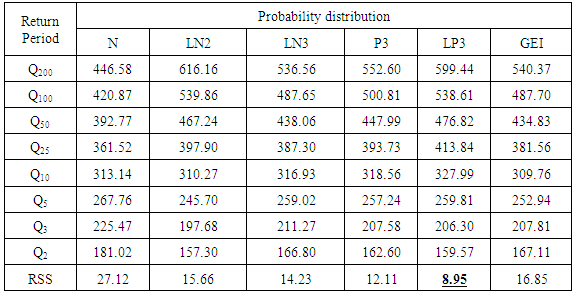
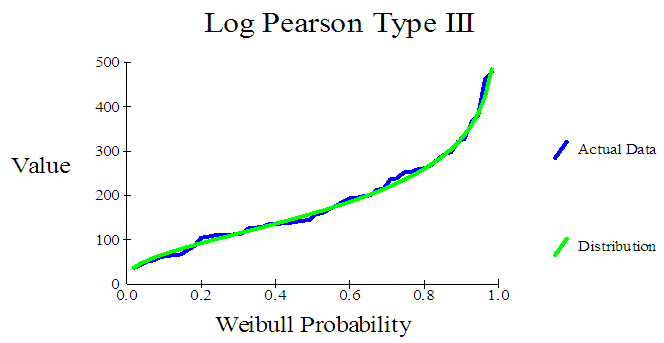
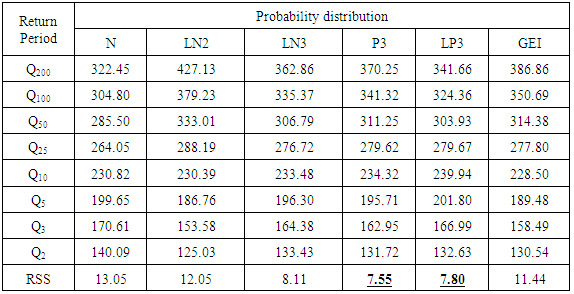
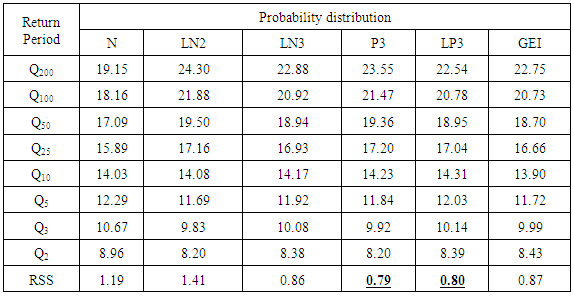
Figures 2-7 are shown fitting observational and prdicted peak and maximum and also annual mean using six common Hydrology distributions Normal (N), 2 parameters Lognormal (LN2), 3 parameters Log-normal (LN3), Pearson Type III (P3), Log Pearson Type III (LP3) and Gumbel Extremal Type I (GEI). Tables 1-6 are shown peak and maximum and also annual mean discharge values in different return periods using different distributions and also are shown R.S.S values for different distributions.Q2, Q3, etc. are Annual discharges with different return periods (m3/s). For example Q2 (m3/s) is Annual peak, maximum or mean discharges with two years return periods. And also Q3 (m3/s) is Annual peak, maximum or mean discharges with three years return periods. Evaluation of statistical distributions of peak and maximum discharges in tables 1-4 showed that N and LN2 distributions have shown the lowest fitting between observational and predicted values. In the N distribution negative values is predicted that it is not logical with regard to be perennial of Karkheh River and there is not negative values for discharge in the nature. Also, these mentioned distributions had the highest R.S.S value, therefore they are unsuitable. LN3, P3 and GEI distributions have shown relatively the best fitting in experimental and estimated curves apparently but estimated R.S.S value are high therefore they are unsuitable. In LP3 distribution, predicted values have shown best fitting with observational data and also it had the lowest R.S.S value (145.91) for peak and value 141.08 for maximum discharge in Jelogir Majin and the lowest R.S.S value (13.67) for peak and R.S.S value 8.95 for maximum discharge in Pole Zal than the other distributions. Therefore it is the most suitable distribution for estimating instantaneous peak and maximum discharges in two stations.Evaluation of statistical distributions of annual mean discharges in table 5-6 showed that N and GEI distributions have shown the lowest fitting between observational and predicted values. In these distributions are estimated negative values that it is not logical. This occurs because of these distributions are two parameters and from the coefficient of skewness factors do not use in calculating the coefficient of variation firstly, secondly the data were fitted directly and without taking the logarithm of the data.Experimental and estimated curves in three parameters Log-normal distribution had appropriate fitting but negative values in this distribution are predicted too that it is not logical. The fitting observational and predicted values of annual mean discharges using LP3, P3 and LN2 distributions showed an appropriate accordance but observational and experimental curves in P3 and LP3 had the most fitting and the lowest R.S.S value (7.55&7.80) for Jelogir Majin station and the lowest R.S.S value (0.79&0.80) for Pole Zal station than the other distributions too. Therefore they are the best distribution for estimating annual mean discharges with different return periods.Table 1. Annual peak discharges with different return period (m3/s) in Jelogir Majin station
 |
| |
|
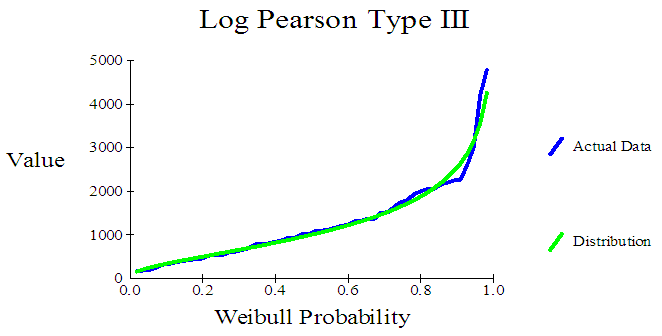 | Figure 2. Observational and predicted annual peak discharges values of log Pearson Type III distributions by SMADA in Jelogir Majin station |
Table 2. Annual peak discharges with different return period (m3/s) in Pole Zal Station
 |
| |
|
 | Figure 3. Observational and predicted annual peak discharges values of log Pearson Type III distributions by SMADA in Pole Zal Station |
Table 3. Annual maximum discharges with different return period (m3/s) in Jelogir Majin station
 |
| |
|
 | Figure 4. Observational and predicted annual maximum discharges values of log Pearson Type III distributions by SMADA in Jelogir Majin station |
Table 4. Annual maximum discharges with different return period (m3/s) in Pole Zal Station
 |
| |
|
 | Figure 5. Observational and predicted annual maximum discharges values of log Pearson Type III distributions by SMADA in Pole Zal Station |
Table 5. Annual mean discharges with different return period (m3/s) in Jelogir Majin station
 |
| |
|
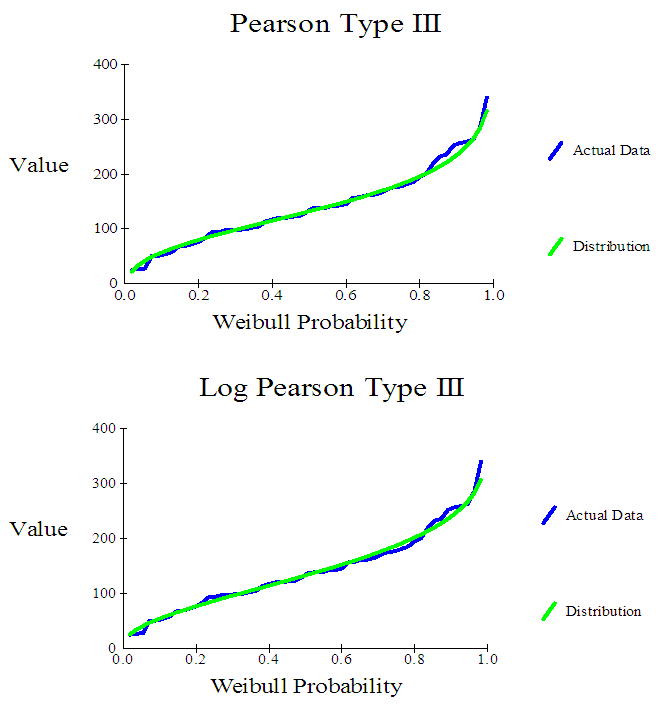 | Figure 6. Observational and predicted annual mean discharges values of Pearson and log Pearson Type III distributions by SMADA in Jelogir Majin station |
Table 6. Annual mean discharges with different return period (m3/s) in Pole Zal Station
 |
| |
|
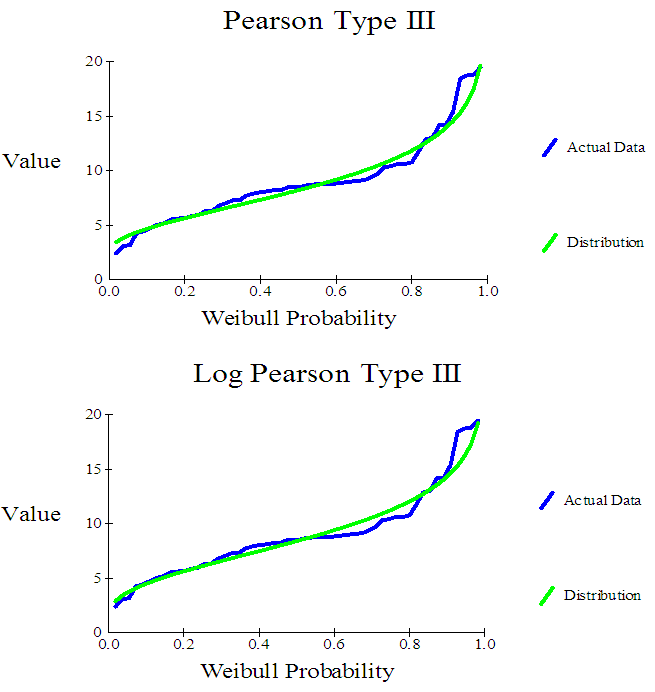 | Figure 7. Observational and predicted annual mean discharges values of Pearson and log Pearson Type III distributions by SMADA in Pole Zal Station |
4. Conclusions
Computation of flood average probability of occurrence or average return periods can help to solve many problems. For example, in the flood control projects and also design of structures dimension such as dam spillway conducts with regard to probability of floods occurrence and discharges related to them. For the water balance project for a region uses mean discharges whereas the water balance computation by use of maximum discharges more shows region water volume. We can determine the extent of the floods at the future in this studied stations until reduce damages in area.The results of statistical distributions in estimating peak discharges with different return periods showed that predicted values in Log Pearson type III distribution had the best fitting with observational data and it had the lowest R.S.S value (145.91) and (13.67) for Jelogir Majin and Pole Zal stations respectively than the other distributions too. Therefore this distribution is the most suitable for estimating peak discharges. Also, Log Pearson type III distribution is the most suitable distribution for estimating annual maximum discharges with different return periods is suitable with R.S.S values (141.08 ) and (8.95) for Jelogir Majin and Pole Zal stations respectively than the other distributions too.At the end, Log Pearson type III distribution is the most suitable distribution for estimating annual mean discharges with different return periods and then Pearson type III distribution is suitable with R.S.S values (7.55 & 7.8) and (0.79 & 0.80) for Jelogir Majin and Pole Zal stations respectively had the best fitting.In this study we find that the LP3 is very important distribution for annual discharge such as peak, maximum and mean discharges and it has the best forecasting for this series.
References
| [1] | Abdi Kardavani, A. and Fakherifar, A., 2009, Frequency distribution analysis of River peak discharges by use of linear moments, 4th National civil engineering conference, Tehran university, 1-7. |
| [2] | Abida, H. and Ellouze, M., 2007, Probability distribution of flood flow in Tunisia, Hydrology and earth system sciences discussions, 4, 957-981. |
| [3] | Alizade, A., 2011, Principles of Applied Hydrology, nineteenth edition, Mashhad University press. 807 pp. |
| [4] | Bedustani, H., 2000, Evaluation of the most suitable frequency distribution for flood forecasting and maximum precipitation with specified probability of occurrence in East Azerbaijan, M.Sc. Thesis, Tarbiat Moddares University. p148. |
| [5] | Hadian, M. Habibnezhad roshan, M. and Omidvar, A., 2011, Evaluation of different statistical distributions in instantaneous peak discharges with different return periods in Tajen watershed, 6th National science and watershed engineering conference, 1-8. |
| [6] | Hosking, J. R. M. and Wallis, J. R. M., 1993, some statistical useful in regional frequency analysis, Water Resources Research, 29, 2, 271-281. |
| [7] | Khosravi, G. H., A. Majidi, A. and Nohegar, A., 2012, Determination of Suitable Probability Distribution for Annual Mean and Peak Discharges Estimation (Case Study: Minab River- Barantin Gage, Iran), International Journal of Probability and Statistics, 1(5): 160-163. |
| [8] | Kjeldsen, T. R. Smithers, J. C. and Schulze, R. E., 2001, Regional Flood Frequency Analysis in the KwaZulu-Natal Province, South Africa, Using the Index-Flood Method, Journal of Hydrology, 255, 194-211. |
| [9] | Lindly, D. V., 1983, Reconciliation of probability distributions, Operation research, 31, 866-880. |
| [10] | Mahdavi, M. Salajegheh, A. Keshtkar, A. R. Fahmi, H. and Sharifi, F., 2006, A Study of the Appropriate Probability Distributions for Annual Flow Series, Using L-Moment Method in Arid and Semi-arid Regions, Iranian journal of natural resources, 59, 1, 74-87. |
| [11] | Mahdavi, M., 2010, Applied Hydrology, Vol. 2, Tehran University press. p437. |
| [12] | Tavakoli, M. and Rostaminia, M., 2006, Modeling the regional flood in Ilam province basins, Journal of Agricultural Science, 12, 2, 347-357. |
| [13] | Vogel, R. M. and Fennrssy, N., 1993, L-moment diagrams should replace product moment diagrams, Water Resources Research, 29, 6, 1745- 1752. |
| [14] | Vogel, R. and Wilson, I., 1996, Probability Distribution of Annual Maximum, Mean & Minimum Stream Flows in the United States, Journal of Hydrologic Engineering, 12, 69-76. |

 Abstract
 Reference
 Full-Text PDF
 Full-text HTML