Rama Shanker
Department of Statistics, Eritrea Institute of Technology, Asmara, Eritrea
Correspondence to: Rama Shanker , Department of Statistics, Eritrea Institute of Technology, Asmara, Eritrea.
| Email: |  |
Copyright © 2016 Scientific & Academic Publishing. All Rights Reserved.
This work is licensed under the Creative Commons Attribution International License (CC BY).
http://creativecommons.org/licenses/by/4.0/

Abstract
In this paper, Poisson-Sujatha distribution has been obtained by compounding Poisson distribution with Sujatha distribution introduced by Shanker (2015 a). The first four moments about origin and the moments about mean has been obtained. The expression for coefficient of variation, skewness and kurtosis has been obtained. Important mathematical and statistical properties of the distribution have been derived and discussed. The estimation of its parameter has been discussed using both maximum likelihood estimation and the method of moments. The proposed distribution has been fitted using maximum likelihood estimate to some count data - sets to test its goodness of fit and the fit is compared with that obtained using other one parameter discrete distributions.
Keywords:
Sujatha distribution, Compounding, Moments, Mathematical and statistical properties, Estimation of parameter, Goodness of fit
Cite this paper: Rama Shanker , The Discrete Poisson-Sujatha Distribution, International Journal of Probability and Statistics , Vol. 5 No. 1, 2016, pp. 1-9. doi: 10.5923/j.ijps.20160501.01.
1. Introduction
The probability density function (p.d.f) of one parameter Sujatha distribution introduced by Shanker (2015 a) for modeling real lifetime data sets from engineering and biomedical science is given by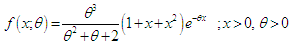 | (1.1) |
Its corresponding cumulative distribution function (c.d.f) is given by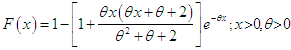 | (1.2) |
It has been shown by Shanker (2015 a) that Sujatha distribution is a three component mixture of an exponential distribution with scale parameter  , a gamma distribution having shape parameter 2 and a scale parameter
  , and a gamma distribution having shape parameter 3 and a scale parameter
  with their mixing proportions
 and
and  respectively. Shanker (2015 a) has discussed its various mathematical and statistical properties including its shape, moment generating function, moments, skewness, kurtosis, hazard rate function, mean residual life function, stochastic orderings, mean deviations, distribution of order statistics, Bonferroni and Lorenz curves, Renyi entropy measure, stress-strength reliability , some amongst others. Further, Shanker (2015 a) has also discussed its estimation of parameter using maximum likelihood estimation and method of moments along with applications for modeling lifetime data and observed that it gives much closer fit than Akash and Shanker distributions introduced by Shanker (2015 b, 2015 c), Lindley (1958) and exponential distributions. It would be recalled that Shanker (2015 b, 2015 c) has proposed Akash and Shanker distributions along with their various interesting mathematical and statistical properties to model lifetime data arising from engineering and biomedical sciences and showed that these distributions provide much closer fit than Lindley and exponential distributions. In the present paper, a Poisson mixture of Sujatha distribution introduced by Shanker (2015 a) has been obtained. The first four moments about origin and the moments about mean have been obtained and thus the expression for coefficient of variation, skewness and kurtosis has been given. The estimation of its parameter has been discussed using maximum likelihood estimation and method of moments. The distribution has been fitted using maximum likelihood estimate to some count data sets to test its goodness of fit over Poisson distribution and Poisson-Lindley distribution (PLD), a Poisson-mixture of Lindley distribution (1958), introduced by Sankaran (1970).
2. Poisson-Sujatha Distribution
Suppose the parameter  of the Poisson distribution follows Sujatha distribution (1.1). Then the Poisson mixture of Sujatha distribution (1.1) can be obtained as
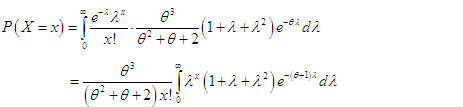 | (2.1) |
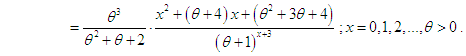 | (2.2) |
We name this distribution “Poisson-Sujatha distribution (PSD)”. The graphs of the probability mass function (pmf) of PSD for varying values of its parameter  are shown in the figure 1.
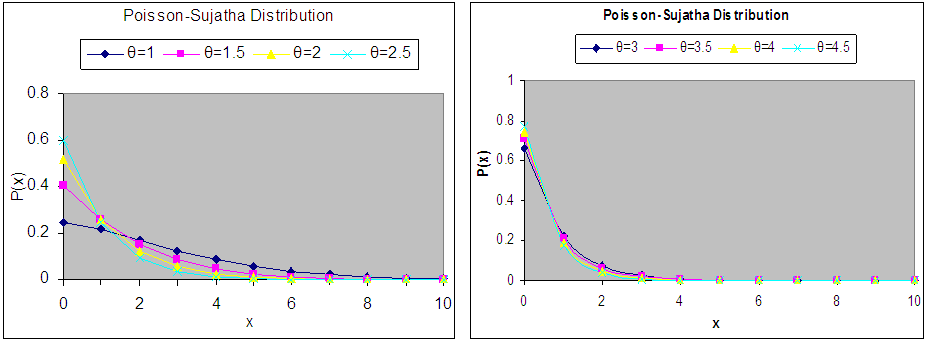 | Figure 1. Graphs of probability mass function of PSD for varying values of the parameter  |
3. Moments and Related Measures
The  th factorial moment about origin of Poisson-Sujatha distribution (2.2) can be obtained as
  Using (2.1) the
  th moment about origin of PSD (2.2) can be obtained as
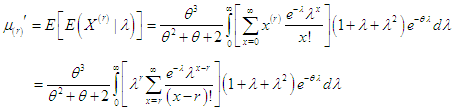 Taking
  in place of
  within bracket, we get
 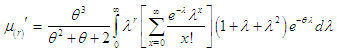 The expression within the bracket is clearly unity and hence we have
 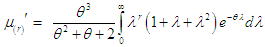 Using gamma integral and some algebraic simplification, we get finally a general expression for the
  th factorial moment of PSD (2.2) as
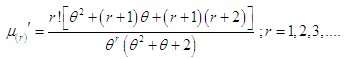 | (3.1) |
Substituting 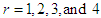 in (3.1), the first four factorial moments can be obtained and using the relationship between factorial moments and moments about origin, the first four moments about origin of the PSD (2.2) are obtained as
 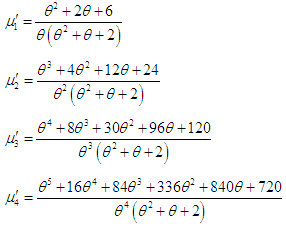 Using the relationship between moments about mean and the moments about origin, the moments about mean of the PSD (2.2) are thus given by
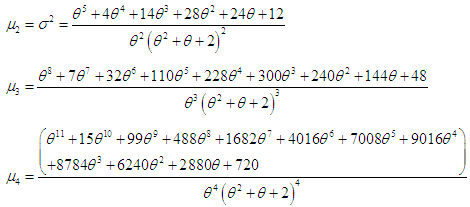 The coefficient of variation
  coefficient of Skewness
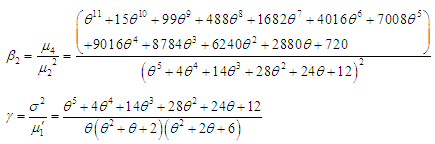
  coefficient of Kurtosis
  and index of dispersion
  of the PSD (2.2) are thus obtained as
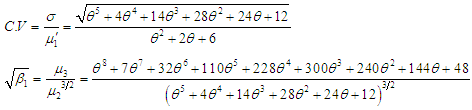
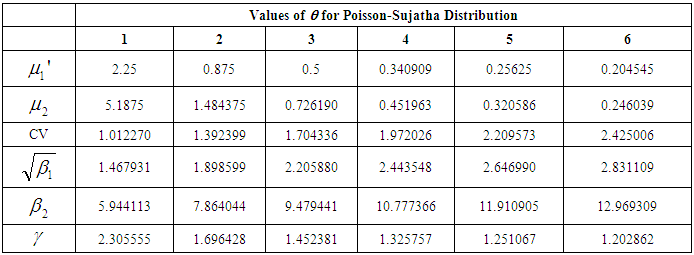
 To study the nature and behavior of
 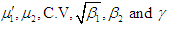 of PSD (2.2), numerical values of these characteristics for varying values of the parameter
  have been presented in table 1. It is clear that
  are decreasing whereas
  are increasing for increasing values of the parameter
  .
.Table 1.
 |
| |
|
Graphs to study the nature and behavior of coefficient of variation, coefficient of skewness, and coefficient of kurtosis of PSD (2.2) for varying values of the parameter  have been shown in the figure 2. It is obvious from the graphs that the coefficient of variation, coefficient of skewness, and coefficient of kurtosis of PSD are increasing for increasing values of the parameter
  .
.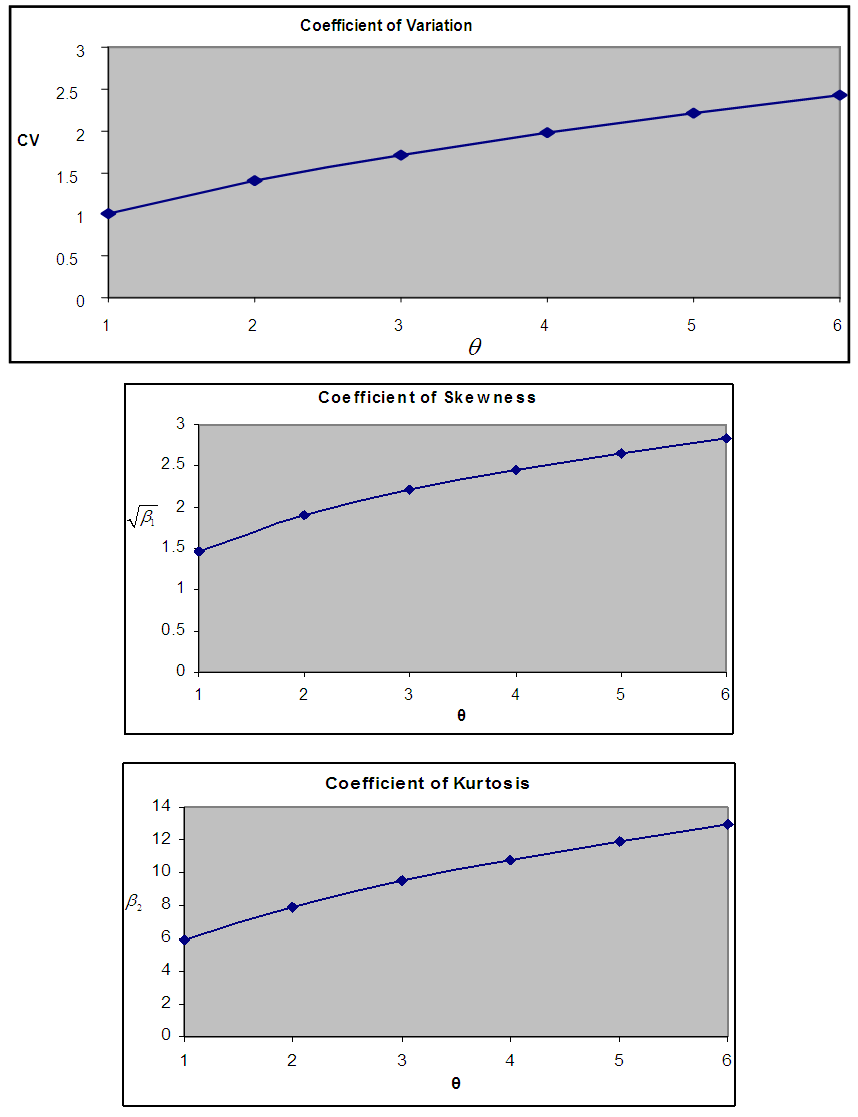 | Figure 2. Graphs of coefficient of variation, coefficient of skewness and coefficient of kurtosis of PSD for varying values of the parameter  |
4. Mathematical and Statistical Properties
4.1. Over-Dispersion
The PSD (2.2) is always over- dispersed  We have
 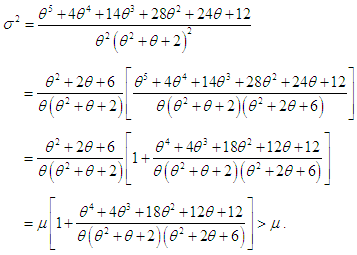 This shows that PSD (2.2) is always over-dispersed.
4.2. Increasing Hazard Rate (IHR) and Unimodality
The PSD (2.2) has an increasing hazard rate and unimodal. Since 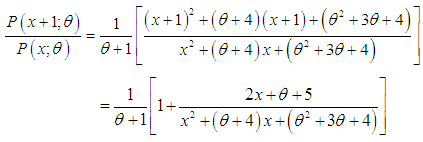 is decreasing function in
  is log-concave. Therefore, the PSD has an increasing hazard rate and unimodal. The interrelationship between log-concavity, unimodality and increasing hazard rate (IHR) of discrete distributions has been discussed in Grandell (1997).
4.3. Generating Functions
The probability generating function of the PSD (2.2) can be obtained as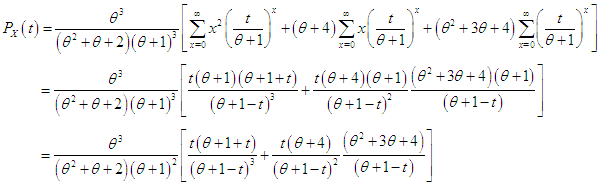 The moment generating function of the PSD (2.2) is thus obtained as
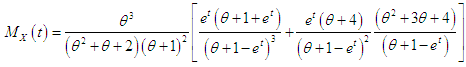
5. Estimation of the Parameter
5.1. Maximum Likelihood Estimate (MLE) of the Parameter
Let  be a random sample of size
  from the PSD (2.2) and let
  be the observed frequency in the sample corresponding to
  such that
  where
where  is the largest observed value having non-zero frequency. The likelihood function
  of the PSD (2.2) is given by
 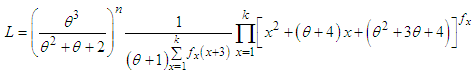 The log likelihood function is thus obtained as
 The first derivative of the log likelihood function is given by
 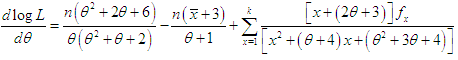 where
where  is the sample mean.The maximum likelihood estimate (MLE),
  of PSD (2.2) is the solution of the equation
  and is given by the solution of the non-linear equation
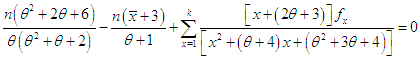 This non-linear equation can be solved by any numerical iteration methods such as Newton-Raphson, Bisection method, Regula – Falsi method etc.
5.2. Method of Moment Estimate (MOME) of the Parameter
Let  be a random sample of size
  from the PSD (2.2). Equating the first moment about origin to the corresponding sample moment, the MOME
  of PSD (2.2) is the solution of the following cubic equation
 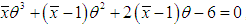 where
where  is the sample mean.
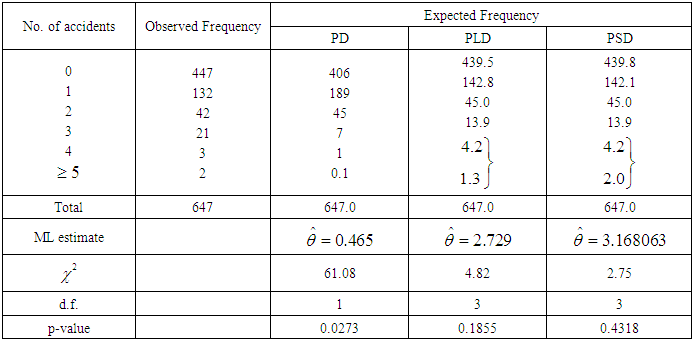
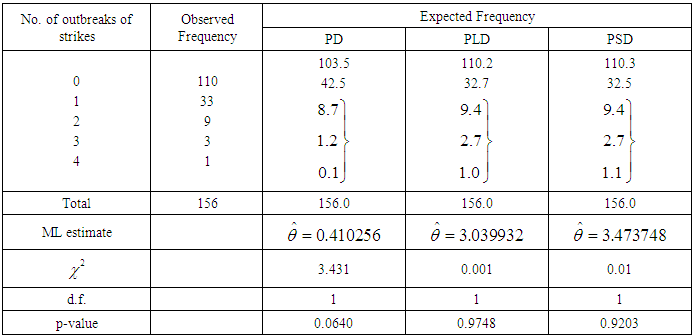
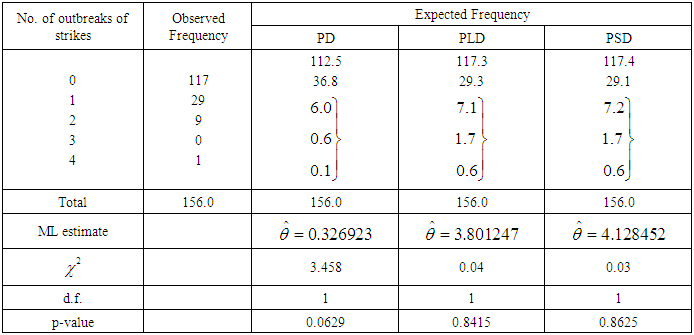
6. Applications and Goodness of Fit
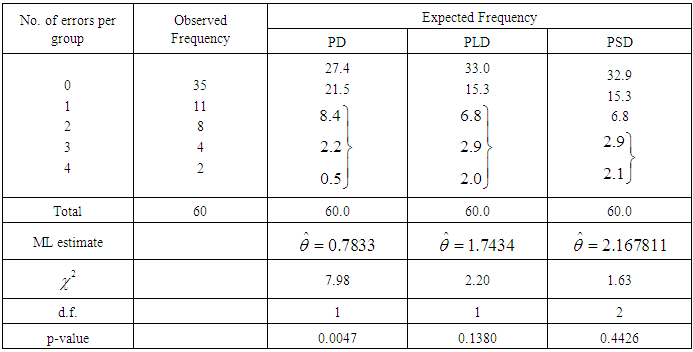
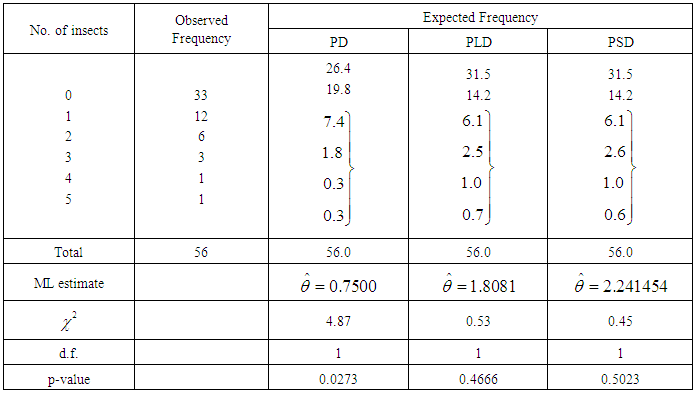
The PSD has been fitted to a number of count data - sets to test its goodness of fit over Poisson distribution (PD) and Poisson-Lindley distribution (PLD. The maximum likelihood estimate (MLE) has been used to fit the PSD. Five observed data-sets, for which the PD, PLD and PSD has been fitted, are presented. The first data-set is due to Kemp and kemp (1965) regarding the distribution of mistakes in copying groups of random digits, the second data-set is due to Beall (1940) regarding the distribution of Pyrausta nublilalis, the third data-set is the number of accidents to 647 women working on high explosive shells in 5 weeks, available in Sankaran (1970), the fourth and fifth data-sets are relating to the number of outbreaks of strike in U.K during 1948-1959 available in Consul (1989).It is obvious from the fitting of PD, PLD, and PSD that the PSD gives much closer fit than PD and PLD in tables 1,2,3, and 5, whereas in table 4 PLD gives better fit than PD and PSD. It is to be noted that the fitting of PSD (2.2) in table 1 is also better than the generalized Poisson-Lindley distribution of Mahmoudi and Zakerzadeh (2010). Further, the fitting of PSD in table 3 is better than the fitting of negative binomial distribution (NBD) and the generalized Poisson-Lindley distribution of Mahmoudi and Zakerzadeh (2010).Table 1. Distribution of mistakes in copying groups of random digits
 |
| |
|
Table 2. Distribution of Pyrausta nublilalis in 1937
 |
| |
|
Table 3. Accidents to 647 women working on high explosive shells
 |
| |
|
Table 4. Number of outbreaks of strike in U.K during 1948-1959, Consul (1989)
 |
| |
|
Table 5. Number of outbreaks of strike in U.K during 1948-1959, Consul (1989)
 |
| |
|
7. Conclusions
In the present paper Poisson-Sujatha distribution (PSD) has been introduced by compounding Poisson distribution with Sujatha distribution proposed by Shanker (2015 a). Expression for rth factorial moment has been derived and the first four moments about origin and the moments about mean has been obtained. The expression for coefficient of variation, skewness and kurtosis has also been given. The estimation of its parameter has been discussed using maximum likelihood estimation and the method of moments. The PSD has been fitted using maximum likelihood estimate to some count data - sets to test its goodness of fit over Poisson distribution (PD) and Poisson-Lindley distribution (PLD) and it is found that Poisson-Sujatha distribution (PSD) is better than Poisson and Poisson-Lindley distributions for most of the count data-sets.
ACKNOWLEDGMENTS
The author is grateful for the reviewer’s constructive comments.
References
| [1] | Beall, G. (1940): The fit and significance of contagious distributions when applied to observations on larval insects, Ecology, 21, 460-474. |
| [2] | Consul, P.C. (1989): Generalized Poisson Distributions, Dekker, New York. |
| [3] | Grandell, J. (1997): Mixed Poisson Processes, Chapman & Hall, London. |
| [4] | Kemp, C.D. and Kemp, A.W. (1965): Some properties of the Hermite distribution, Biometrika, 52, 381-394. |
| [5] | Lindley, D.V. (1958): Fiducial distributions and Bayes theorem, Journal of the Royal Statistical Society, 20 (1), 102-107. |
| [6] | Mahmoudi E. and Zakerzadeh, H. (2010): Generalized Poisson-Lindley distribution, Communications in Statistics-Theory and Methods, 39, 1785 – 1798. |
| [7] | Sankaran, M. (1970): The discrete Poisson-Lindley distribution, Biometrics, 26, 145-149. |
| [8] | Shanker, R. (2015 a): Sujatha distribution and Its Applications, Accepted for publication in “Statistics in Transition new Series”. |
| [9] | Shanker, R. (2015 b): Akash distribution and Its Applications, International Journal of Probability and Statistics, 4(3), 65 – 75. |
| [10] | Shanker, R. (2015 c): Shanker distribution and Its Applications, International Journal of Statistics and Applications, 5(6), 338 – 348. |

 Abstract
 Reference
 Full-Text PDF
 Full-text HTML