Lai Huat Ang1, Masitah Shahrill2
1Meragang Sixth Form Centre, Ministry of Education, Bandar Seri Begawan, BT2728, Brunei Darussalam
2Sultan Hassanal Bolkiah Institute of Education, Universiti Brunei Darussalam, Bandar Seri Begawan, BE1410, Brunei Darussalam
Correspondence to: Masitah Shahrill, Sultan Hassanal Bolkiah Institute of Education, Universiti Brunei Darussalam, Bandar Seri Begawan, BE1410, Brunei Darussalam.
| Email: |  |
Copyright © 2014 Scientific & Academic Publishing. All Rights Reserved.
Abstract
The concepts of Probability are fundamental to the study of Mathematics, especially at the secondary school level. The main aim of this study is to investigate and identify specific students’ misconceptions by secondary school students when learning Probability in Brunei Darussalam. In total, 177 Years 10 and 11 students from two schools participated in the research study. The two instruments used for this study were ‘Misconception on Probability’ two-tier multiple choice questionnaire and interviews. Carelessness and Incorrect method were grouped as error-typed whereas, Representativeness, Equiprobability bias, Beliefs and Human control were the four identified specific misconceptions on Probability.
Keywords:
Misconceptions, Probability, Secondary mathematics level
Cite this paper: Lai Huat Ang, Masitah Shahrill, Identifying Students’ Specific Misconceptions in Learning Probability, International Journal of Probability and Statistics , Vol. 3 No. 2, 2014, pp. 23-29. doi: 10.5923/j.ijps.20140302.01.
1. Introduction
When learning Mathematics, the covered mathematical theories are mostly provable. In teaching addition, it is easily verified that 3 + 5 = 8 is true by combining three objects with another five objects and add up to get eight objects in total. If students are being taught on calculating the volume of a cube, they can assure that the cube with sides measuring 3 cm by 3 cm by 3 cm is indeed measures 27 cm3 by combining 27 pieces of 1 cm3 cubes into one. Even in trigonometry problems, if the distance of two objects is 5 m, this can be confirmed by constructing diagrams, trying out in the real experiment or recalculating it using another formula. However, this proving method is not always applicable in Probability. For example, in a scenario where event A is more likely to occur than event B, but if event B happens ten times in a row, then this can easily contradict our initial assumption. Randomness and “luck” comes into play in above situation thus prevent us from understanding the reality of the situation with assurance [7].Therefore, what is Probability? What does it mean to say that the Probability of an event is 0.25 or 25%? Is this the likelihood in which the event happens? To what extent should we believe it will happen or has happened? Or is it the level to which some people believe it will happen? Many debates have been argued regarding these types of Probability questions. In general, Hirsch and O’Donnell (2001) defined the Probability as the study of likelihood and uncertainty, and it involves in most everyday decisions. It is important to be able to reason effectively about Probability as it is used by many professions. According to Garfield (2002), statistical reasoning is a topic of interest to many professions such as making judgments and decisions by psychologists, doctors interpreting risks of medical outcomes, political analysts’ work of interpreting polls and elections, and journalists explaining and critiquing statistical information in the media. Konold (1995) further added that everyday reasoning also depended on reasoning about probabilities, and people use different heuristics methods to judge Probability.
2. The Types of Misconceptions on Probability
Several research studies from different theoretical perspectives seemed to show that students tend to have perceptions which hinder their learning of Probability concepts. Some common ways of thinking which impede the learning of Probability are Representativeness, Equiprobability bias, Beliefs and Human control.Representativeness: Kahneman and Tversky (1973) published a research paper on misconceptions that people have on Probability. They referred to the misconception as ‘representativeness.’ In their study, the representativeness misconception referred to the tendency of students to incorrectly think that samples which correspond to the population distribution are more probable than samples which do not. For example in tossing a coin, students with this misperception will think that a series of coin tosses that has approximately equal numbers of heads and tails is more probable than a series with many more tails than heads. However, the Probability for both series is the same.In another study, students make decisions about the likelihood of an event based upon how similar the event is to the population from which it is drawn or how similar the event is to the process by which the outcome is generated [10]. For example, a string of tails does not appear to be representative of the random process of flipping a coin, and so those who are having representativeness would expect heads to be more likely on subsequent tosses until the results evened out.Equiprobability bias: Students with this misconception tend to assume that random events are equally probable by nature. Or in another words, they view the chances of getting different outcomes as equally likely events. For example, Lecoutre (1992) stated that three sixes or one six on three rolls of a die are viewed as equally likely to occur. In addition, according to Lecoutre and Rezrazi (1998), this misconception attributes the same Probability in a random experiment to different events regardless of their actual chances. In another words, the equiprobability is the tendency of students to view several outcomes of an experiment as equally likely. For example, students with equiprobability bias misconception think that when two dice are rolled, all the sums possible are equally probable. They do not realize that the sum of 6 or 7 for the two dice is more likely than the sum of 2 or 12.Beliefs: According to some research, a number of children think that eventual outcome of an event depends on a force which is beyond their control. Sometimes this force is God or some other force such as wind, other times luck or wishes [9].Human control: According to Nicolson (2005), research designed to explore children’s ability to generalise the behaviour of random generators such as dice, coins and spinners show that some children think that their results depend on how one throws or handles these different devices.The concepts of Probability are fundamental to the study of Mathematics, especially at the upper secondary (Years 9 to 11) and pre-university (Years 12 to 13) levels. In Brunei Darussalam in particular, the study of pre-university Probability and Representation of Data, for example, depends heavily on Probability concepts. Hence it is important to detect if misconceptions exists at the initial secondary school stage of their learning in Probability. The findings in this study may help teachers become increasingly aware of any misconceptions held by their students and to rectify the problem before students proceed to the pre-university level and subsequently any further studies at the university levels.
3. Design of the Research
The approach to data collection and analysis are both qualitative and quantitative in design. It can utilize statistical information gathered from the proposed research instruments as well as making subjective assessments of the same research data. The quantitative design methodology involves an appropriate questionnaire designed to investigate the ability to answer Probability questions and misconceptions for secondary school students.The research question for this study is “What are the specific misconceptions that students encountered when learning Probability?” This research question will be answered using the test items together with the classification of data from interviews conducted on both schools.
3.1. The Sample
The two schools – School X and School Y – were conveniently selected for this study. A total of 177 students, 71 Year 10 students from School X and 106 Year 11 students from School Y participated in the study. The students at both these year levels would have developed a well-informed understanding towards Mathematics, from their six years of primary schooling and three or four years of lower secondary schooling. In addition, all these students scored at least a credit grade or higher in their previous Year 9 national lower secondary assessment in Mathematics and subsequently placed for their upper secondary in the ‘Science’ stream. This streaming indicated they belonged to the elite science stream category with abilities ranging from average to highly abled students.From the overall sample, 17 students, eight from School X and nine from School Y, formed a special interview sample, from which the questionnaire interview data were obtained.
3.2. Instruments Used in the Study
The students were given a questionnaire titled, ‘Misconceptions on Probability Questionnaire’. The questionnaire used in this study was adapted and modified from Hirsch and O’Donnell’s (2001) ‘A test on representativeness’ questionnaire. Furthermore, according to Hirsch and O’Donnell, a measure of the consistency of classification for the items intended to identify students who held misconceptions to be 0.84. Therefore, this questionnaire is suitable for use in the main study.Students responded to an 11-item questionnaire to identify misconceptions of Probability. Each item was divided into two parts. In the first part of an item, students chose the correct answer to a problem stem from among five options. In the second part, students justified their answer in part one by selecting from a number of explanations. As mentioned earlier, the questionnaire is a two-tier type. The first part asked students for an assessment of Probability. Students were provided with several possible outcomes and were asked “Which event is least likely?” or “Which event is most likely?” An example of the first part, taken from Question 7 or Q7, is given in Figure 1 below. A student who selected (a) H T H T as being ‘most likely’ is thought to hold a misconception of representativeness because choosing option (a) would likely to indicate a belief for the student that the result of repeatedly tossing a coin must be a random mixture or heads and tails. However, if students calculated the Probability of each event correctly, they would have found that all the above sequences are equally likely. 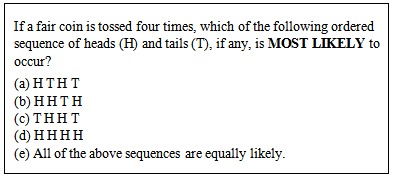 | Figure 1. The Probability part of Q7 |
Meanwhile, the second part of each item asked students to identify a specific reason for their answer to the first part of the item. According to Hirsch and O’Donnell (2001), the second part of each item was constructed based on previous research and clinical interviews with students on common explanations for misconceptions of Probability. The second part of the above example is shown in Figure 2.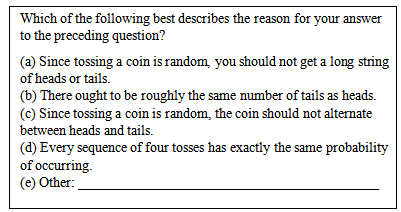 | Figure 2. The justification part of Q7 |
The event used in the questionnaire varied for each item, that is, coin tossing, rolling a die or selecting a fruit, and also the use of most likely or least likely in the question. Furthermore, the length of outcomes sequences from the coin tosses or dice rolls also varied from four to as many as eight. Length of the sequences of outcomes, judgments of most or least likely and different events are known to influence judgments of Probability.Interview sessions in English medium were conducted using a list of steps and questions as a guideline. The aim of the interview session was to find out how much pre-existing knowledge do the students generally have about Probability, to determine the source of difficulties they encountered in the questionnaire, and to analyse the misconceptions the students formed on this particular topic. In total, 17 students were selected based on the score and justification of their questionnaires. Each student was given a new copy of the questionnaire. The students were asked to redo at least two items selected by the authors, based on their potential for revealing the student’s misconceptions or errors made. Since English language is not the students’ first language, they were allowed to use both English and Malay Languages during the interview sessions.
3.3. Limitation of the Study
The present study has the following limitation. The sample in this study consisted of three classes of Year 10 and five classes of Year 11 students, totaling only 177 students in two government schools in Brunei Darussalam. The decision to use these eight classes was due to their availability during the research study period. The sample of this study was considered small for a country that has thousands of upper secondary school students. Being a small exploratory study, the findings cannot therefore be generalized to the entire Year 10 or Year 11 population of Brunei Darussalam’s upper secondary Mathematics students. Nevertheless, it was anticipated that with the valuable information obtained on (a) students’ knowledge of Probability, and (b) students’ specific misconceptions on Probability, this study will reveal the extent of students’ misconceptions when learning Probability and whether it will hinder them from answering the Probability questions correctly. From this perspective, the findings of this research study may also assist the curriculum developers at the Ministry of Education to design and develop new strategies for making Mathematics learning, specifically the topics on Statistics and Probability, more meaningful to students in all secondary schools throughout the country.
4. Results
The analysis tools used in this research is statistical package for the social sciences version 19.0 (SPSS 19.0). In addition, p value of less than 0.001 (p < 0.001) is regarded to be statistically significance.
4.1. The Misconception Responses on the Probability Questionnaire
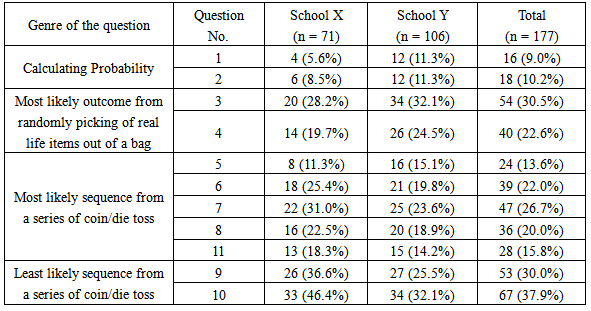
Table 1 shows the number of students who gave misconception responses to each of the question asked on Probability. Low percentages of misconception responses (9% and 10.2%) were recorded on questions under ‘Calculating Probability’. This indicated that only a minority of the students have misconception on the Probability tree diagram.Questions on ‘Most likely outcome from randomly picking of real life items out of a bag’ show a big increase over the previous genre; specifically Q3 where nearly a third of the total participants have showed misconception. Students from School Y had higher misconception responses percentage on Q4 than those students from School X.There were five questions categorised under ‘Most likely sequence from a series of coin/die toss’ genre, namely Q5, Q6, Q7, Q8 and Q11. Student from School X had higher percentage of misconception responses on Q6, Q7, Q8 and Q11 than student from School Y. Question 5 identified the least overall percentage among the five questions of this genre.Table 1. Misconception Responses by the Students in each School
 |
| |
|
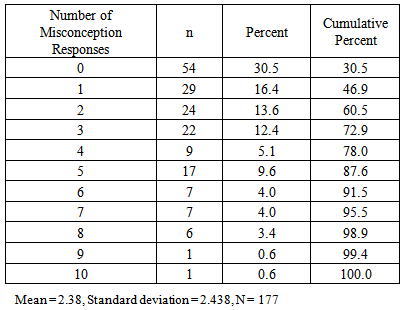
Whereas Q9 and Q10 were formed to test least likely sequence from a series of coin or die toss. 53 students (30%) out of the total 177 gave misconception response on Q9. Q10 recorded the highest overall percentage of misconception responses (37.9%) among all genres. From the 71 participants of School X, they have, on average, 2.54 number of misconception response with a standard deviation of 2.329 number of misconception responses on the Misconceptions on Probability questionnaire. Meanwhile for School Y, their 106 participants obtained an average of 2.28 number of misconception responses with standard deviation of 2.514 number of misconception responses.The test items consisted of 11 justification parts that require responses from the participants. Table 2 shows the distribution of the misconception responses of the question in the questionnaire. The mean and standard deviation of the number of misconception responses are 2.38 and 2.438 respectively.Table 2. Distribution of Misconception Responses of the Students in the Questionnaire
 |
| |
|
In summary, students in the sample can be seen to give more misconception responses to questions under ‘Least likely sequence from a series of coin/die toss’ genre when compared with questions from other genres. The authors found that students had least misconception responses on questions under ‘Calculating Probability’. It was also found that students from School X gave lower misconception responses percentage on early questions and it worsened as they went on.
4.2. Results from Students’ Interview Transcripts
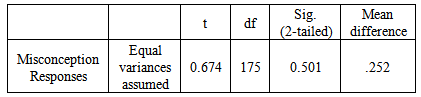
Initially, an Independent sample T-test between School X and Y was tested by the authors to see any significant difference for their number of misconception responses. Entries in Table 3 provided the results of independent sample T-test between School X and School Y’s misconception responses. The value of the independent sample T-test found that students in School X have no significant difference (p = 0.501, p > 0.05) at 95% confidence interval with student in School Y in terms of their number of misconception responses. Therefore, the authors can treat the interview data as a whole. Separate treatment is not required. Table 3. Analysis of Independent Sample T-test between School X and School Y’s Misconception Responses
 |
| |
|
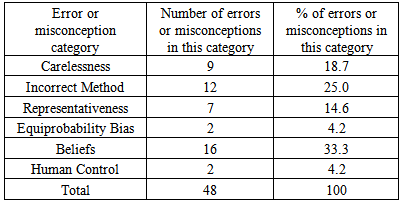
Before giving the error and misconception classifications, it will be useful to comment on the use of the misconception classification in the context of student’s written and verbal responses to questions asked during the interview sessions. Carelessness: An answer for any question would be classified as Carelessness if the student managed to get both question and justification parts correct during the interview. For instance, a student answered both parts incorrectly during the administration of questionnaire session but he/she managed to answer them perfectly with positive assurance. Incorrect method: This would occur if a student attempted the question wrongly but from his verbal explanation did not show any misconception. The authors will classify that question as ‘Incorrect method’. Representativeness: A student is considered to have Representativeness on that type of question if he/she incorrectly thinks that samples which correspond to the population distribution are more probable than samples which do not. For example, a student expects THHTT is more likely result than TTTTT in a series of coin tosses and explained that tossing coin is random so it is impossible to get a long string of tails.Equiprobability bias: A student is considered to have Equiprobability bias on that particular type of question if he/she views the chance of getting different outcomes as equally likely events. For instance, a student expects the same number of tails and heads if a fair coin is tossed many times or he/she explains a mixture of different numbers if a fair die is rolled six times hence equal chance should be given to all events. Beliefs: A student under Belief classification thinks that outcome of an event depends on a force which is beyond their control. Some examples of this force are God or luck.Human control: This would happen if a student think that the outcomes of any event depend on how on the person throws or handles the devices.Table 4 summarises the error or misconception classification identified from the 17 students who were interviewed. After the questionnaire had been given to the students, 17 students were selected for interview based on their poor total score of first part of the questionnaire and also high number of misconception responses in their justification. All students were interviewed individually. Carelessness and incorrect method are grouped as Error since it involves students’ working technique while the remaining is under Misconception category. Altogether the interviewees made 21 errors, there were 27 misconception responses with 9 questions that were unable to be explained by the students. Table 4. Classification of errors or misconceptions identified from the 17 students who were interviewed
 |
| |
|
There were 9 errors categorised as ‘Carelessness’ whereby these ‘Carelessness’ errors were made during the first in-class attempt of the questionnaire. During the interviews, the students were able to provide correct answers and justification for the questions, were able to convince the authors that they had known how to obtain the correct answers when they originally attempted the questions. Out of the total errors, 12 were grouped as ‘Incorrect method’. These ‘Incorrect method’ errors occurred when interviewees attempted wrongly on the question part. When they were asked to explain, in their own words, what the questions were asking. They managed to elaborate most of the key points of the question. The authors were convinced that there were no misconceptions behind their explanation. In some cases, students explained they were lack of revision on Probability when attempting the questionnaires during the class and interview time so they could not answer the questionnaire items correctly.From the total of 27 misconception responses, 7 were classified as ‘Representativeness’ misconception. A Representativeness misconception was deemed to have occurred if a student thought that samples which correspond to the population distribution are more probable than samples which do not. For example, for Q5 that stated: 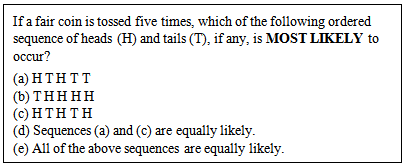 | Figure 3. The Probability part of Q5 |
Student 9 selected option (d) as her answer and justified that tossing a coin is a random event, it is really rare you get four heads in a row and she further added that there ought to be equal number of heads and tails. Another response which can be used to illustrate a Representativeness misconception is when Student 11 tried to explain the reason he chose option (d) for his Q4. He said that “since red balls have been selected for three times in a row, it won’t come out again.” But according to Q4, each ball is picked and put back in the box, so all the different coloured balls should have equal chance of being picked. Equiprobability bias misconception occurred when the students viewed the chance of getting different outcomes as equally likely events. There were only two out of the total misconception responses were identified during the interview. One response can be used to show an Equiprobability bias misconception is shown in Figure 4. It is part of a conversation transcript between the first author and Student 6. They were discussing on Q8. 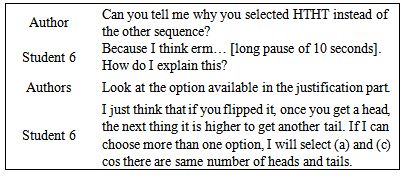 | Figure 4. Conversation illustrating Equiprobability bias misconception |
Over half (16 out of 27) of the misconception responses were classified in the Beliefs category. A Beliefs misconception would occur if a student thinks that other natural factors affected the outcomes of an event. For example, God or maybe based on their own experience when handling the event device. There were many cases in the interview where students justified their answer by giving “based on my own experience” as their reason. For instance, Student 13 described that she never tosses four heads in a row for a coin toss, so she did not selected option (d) as her answer for Q7. Finally, two of the total misconception responses were classified as ‘Human control’. The general belief is that results or outcomes depend on how one throws or handles these different devices. For example, Student 10 explained that the outcome of item (3) depend on the person who picks the fruit out of the bag. According to him, a person can feel the texture of the fruits before deciding which one to select. Furthermore, similar student justified that the Probability to get a head on a coin toss is not necessarily half because there is chance where the coin does not land on either head or tail. He further added that if the face up is head before tossing a coin, it would land on its similar face at the right timing and rhythm. This is an interesting finding from a student who is fond of this topic Probability.
5. Conclusions
This study presented the investigation in identifying the specific misconceptions faced by students in Probability. This study was conducted in two secondary schools in Brunei Darussalam. Data from two vantage points were taken into account in order to obtain an answer to the research question. The two vantage points were the number of misconception responses on the justification part of the questionnaire and the interviews from 17 students (eight from School X and nine from School Y). The authors found that the frequency of misconception responses by the students from the questionnaire was not as bad as was expected. From Table 1, since the results of misconception responses were grouped according to the genre of the question, it can be seen that ‘Least likely sequence from a series of coin/die toss’ genre had the highest misconception responses when compared to other genres. For future researches, it is recommended to provide more questions on this type of genre as it can help to identify students with possible misconception on Probability. However, this is the limitation of the questionnaire. It can identify students with misconceptions but in order to further specify the type of misconceptions, face to face interview may be needed.Before the analysis of the interview data, the authors ran an Independent sample T-test to find if there are any significant difference on the number of misconception responses among the two schools. From the T-test, it was found that students in School X had no significant difference (p = 0.501, p > 0.05) at 95% confidence interval in comparison to students in School Y in terms of their number of misconception responses. Hence the authors were able to treat the interview data collected regarding misconception from both schools as a whole, and separated treatment was not needed. The idea of classification of errors or misconceptions was invented by the authors. It is utilized by the authors to divide the misconception responses into six categories. Carelessness and Incorrect method were grouped as error-typed categories where students’ initial misconception responses were due to their carelessness when attempting the questionnaire or the lack of understanding on the topic itself. Misconception is not involved in these two categories. On the other hand, Representativeness, Equiprobability bias, Beliefs and Human control are the four different misconceptions categories on Probability. With verbal and written input from the students, the authors were able to specifically identify each type of misconceptions. From this research study, the authors were able to identify students with misconceptions on Probability and understand their difficulties when learning Probability. However, the students’ problems may remain in their learning process and progress unless steps of treating these problems can be implemented. During the research study interview sessions, the first author spent a few minutes in explaining to the students regarding their misconceptions. Some interviewees then realised their misconceptions and attempted the probability questionnaire correctly. It is highly recommended that introduction of intervention classes be done to treat any misconceptions that may still exist.
References
| [1] | Garfield, J. (2002). The challenge of developing statistical reasoning. Journal of Statistics Education [online] 10(3). Available:http://www.amstat.org/publications/jse/v10n3/garfield.html. |
| [2] | Hirsch, L., & O’Donnell, A. M. (2001). Representativeness in statistical reasoning: Identifying and accessingmisconceptions. Journal of Statistics Education [online] 9(2). Available: http://www.amstat.org/publications/jse/v10n3/garfield.html. |
| [3] | Kahneman, P., & Tversky, A. (1973). On the psychology of prediction. Psychology Review, 80, 237-251. |
| [4] | Konold, C. (1995). Issues in assessing conceptual understanding in probability and statistics. Journal of Statistics Education [online] 3(1). Available:http://www.amstat.org/publications/jse/v3n1/konold.html. |
| [5] | Lecoutre, M. (1992). Cognitive models and problem spaces in purely random situations. Educational Studies in Mathematics, 23, 557-568. |
| [6] | Lecoutre, M. P., & Rezrazi, M. (1998). Learning and transfer in isomorphic uncertainty situations: The role of the subjects cognitive activity. Statistical Education – Expanding the network, Proceedings of the fifth International Conference on Teaching of Statistics, (Pereira-Mendoza, L., Seu, L., Wee, T., and Wong, W. K. eds.), Vooburg, Netherlands: ISI Permanent Office, 3, pp. 1105-1111. |
| [7] | Lefebvre, C. (2010). Probability vs. typicality: Making sense of misconceptions. Published Master’s Thesis, Concordia University, Montreal, Quebec, Canada. |
| [8] | Nicolson, C. P. (2005). Is chance fair? One student’s thoughts on probability. Teaching Children Mathematics, 12(2), 83-89. |
| [9] | Truran, K. M. (1994). Children’s understandings of random generators. Mathematics Without Limits, Proceedings of the 31st Annual Conference of the Mathematical Association of Victoria, (Beesey, C., and Rasmussen, D. eds.), Melbourne: Mathematics Association of Victoria, pp. 356 – 362. |
| [10] | Tversky, A., & Kahneman, D. (1974). Judgment under uncertainty: Heuristics and biases. Science, 185, 1124-1131. |
 Abstract
 Reference
 Full-Text PDF
 Full-text HTML