Rama Shanker 1, A. Mishra 2
1Department of Statistics, Eritrea Institute of Technology, Asmara, Eritrea
2Department of Statistics, Patna University, Patna, India
Correspondence to: Rama Shanker , Department of Statistics, Eritrea Institute of Technology, Asmara, Eritrea.
| Email: |  |
Copyright © 2012 Scientific & Academic Publishing. All Rights Reserved.
Abstract
In this paper, a size- biased quasi Poisson-Lindley distribution, of which the size-biased Poisson-Lindley distribution of Ghitany and Al Mutairi[4] is a particular case, has been obtained by size biasing the quasi Poisson - Lindley distribution of Shanker and Mishra[14]. A general expression for the  factorial moment of this distribution has been derived and hence its first four moments have been obtained. The method of maximum likelihood and the method of moments of estimation of its parameters have been discussed. The distribution has been fitted to some data sets to test its goodness of fit.
Keywords:
Poisson-Lindley Distribution, Size-biased Distribution, Estimation of Parameters, Goodness of Fit
Cite this paper: Rama Shanker , A. Mishra , On a Size-Biased Quasi Poisson-Lindley Distribution, International Journal of Probability and Statistics , Vol. 2 No. 2, 2013, pp. 28-34. doi: 10.5923/j.ijps.20130202.03.
1. Introduction
Size-biased distributions arise in practice when observations from a sample are recorded with unequal probabilities, having probability proportional to some measure of unit size. Fisher[3] first introduced these distributions to model ascertainment bias which were later formalized by Rao[11] in a unifying theory. Van Deusen[16] discussed size-biased distribution theory and applied it to fitting distributions of diameter at breast height (DBH) data arising from horizontal point sampling (HPS). Later, Lappi and Bailey[7] used size-biased distributions to analyze HPS diameter increment data. Most of the statistical applications of these distributions, especially to the analysis of data relating to human population and ecology can be found in Patil and Rao ([9],[10]). Gove[5] reviewed some of the recent results on size-biased distributions pertaining to parameter estimation in forestry, with special emphasis on Weibull family.If a random variable X have distribution f (x, ) then a simple size-biased distribution is given by its probability function f *(x;
  ) =
) = where
where  , is the mean of the distribution. Ghitany and Al Mutairi[4] obtained a size-biased Poisson - Lindley distribution (SBPLD) given by its probability mass function (p.m.f.)
 | (1.1) |
by size biasing the Poisson -Lindley distribution (PLD) of Sankaran[12] having pmf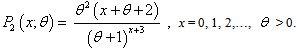 | (1.2) |
It is to be mentioned that Sankaran[12] obtained the distribution (1.2) by mixing the Poisson distribution with the Lindley (1958) distribution having pdf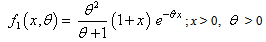 | (1.3) |
The first four moments about origin of the SBPLD (1.1) have been obtained as | (1.4) |
 | (1.5) |
 | (1.6) |
 | (1.7) |
and so its variance as | (1.8) |
Recently, Shanker and Mishra[14] obtained a quasi Poisson-Lindley distribution (QPLD) given by its pmf | (1.9) |
It can be seen that the PLD (1.2) is a particular case of it at  . Shanker and Mishra[14] have shown that (1.9) is a better model than the PLD of Sankaran[12] for analyzing different types of count data. This distribution arises from the Poisson distribution when its parameter
  follows the Shanker and Mishra[13] quasi Lindley distribution having its probability density function (p.d.f)
 | (1.10) |
In this paper, a size-biased quasi Poisson-Lindley distribution (SBQPLD) of which the SBPLD (1.1) is a particular case, has been obtained. A general expression for the  factorial moment of this distribution has been obtained and hence its first four moments about origin of this distribution have been obtained. The method of maximum likelihood and the method of moments of estimation of its parameters have been discussed. The distribution has been fitted to some data- sets and it has been found that to almost all these data-sets it provides closer fits than the SBPLD. This shows that the SBQPLD is more flexible than the Ghitany et al[4] SBPLD for analyzing different types of count data.
2. A Size-Biased Quasi Poisson-Lindley Distribution (Sbqpld)
The pmf of size-biased quasi Poisson-Lindley distribution (SBQPLD) with parameters  and
and  is obtained as
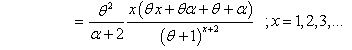
  | (2.1) |
Taking the pmf  from (1.9) and its mean
  of Shanker and Mishra[14], we get
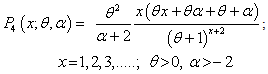 | (2.2) |
It can be easily seen that (2.2) reduces to (1.1) at  .The SBQPLD can also be obtained from the size-biased Poisson distribution when its parameter
  follows a size-biased quasi Lindley distribution with p.d.f.
 | (2.3) |
We have 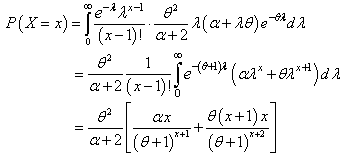 | (2.4) |
 | (2.5) |
which is the SBQPLD. To know the behaviors of the pmf of the SBQPLD, plots of its pmf have been drawn for different values of its parameters in figure 1. As  | (2.6) |
is a decreasing function of  ,
,  is log-concave. Therefore, the SBQPLD is unimodal, has an increasing failure rate (IFR) and hence increasing failure rate average (IFRA). It is new better than used (NBU), new better than used in expectation (NBUE) and has decreasing mean residual life (DMRL). Details about the definitions of these aging concepts can be seen in Barlow and Proschan[1].
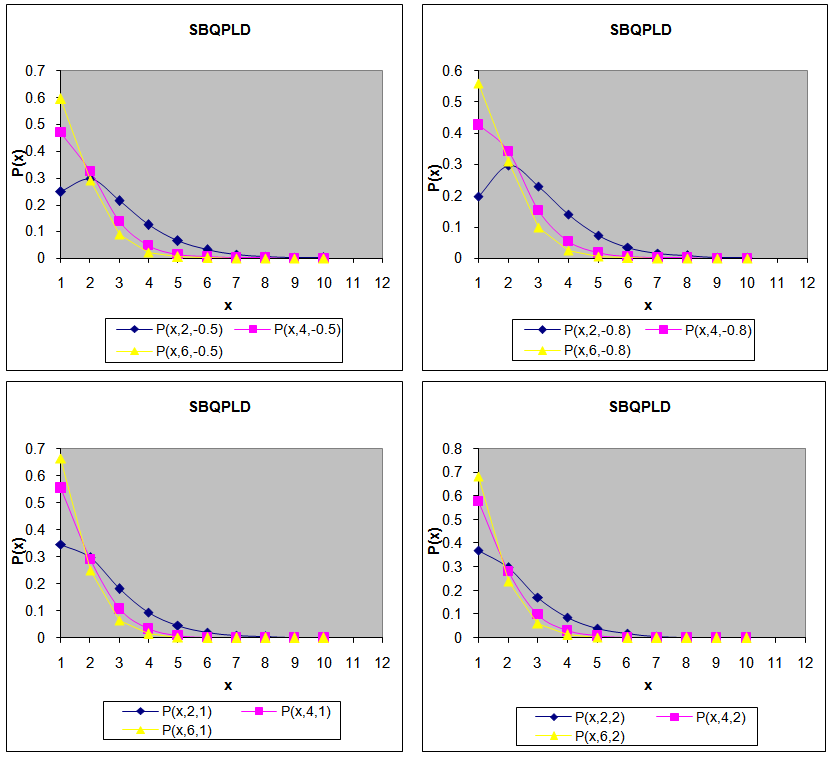 | Figure 1. Plots of SBQPLD for different values of parameters θ and α |
3. Moments
The rth factorial moment of the SBQPLD (2.2) can be obtained as | (3.1) |
where  .From (2.4), we get
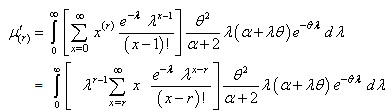 | (3.2) |
Taking (x+r) in place of x, we get The expression within bracket is clearly (
 and hence we have
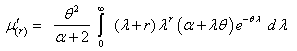 | (3.3) |
Using gamma integral, we get finally, after a little simplification, a general expression for the rth factorial moment of the SBQPLD as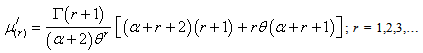 | (3.4) |
After obtaining the first four factorial moments, by substituting r = 1,2,3 and 4 in (3.4) and then using the relationship between factorial moments and moments about origin, the first four moments about origin of the SBQPLD were obtained as | (3.5) |
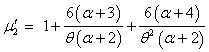 | (3.6) |
 | (3.7) |
 | (3.8) |
It can be easily verified that at  , these moments reduce to the respective moments, (1.4) to (1.7) of the SBPLD.
4. Estimation of Parameters
4.1. Maximum Likelihood Estimates
Let ( ) be a random sample of size n from the SBQPLD (2.2) and let
  be the observed frequency in the sample corresponding to
 such that
  , where
  is the largest observed value having non-zero frequency. The likelihood function,
  of the SBQPLD is given by
 | (4.1) |
and so the log likelihood function is obtained as | (4.2) |
The two log likelihood equations are thus obtained as 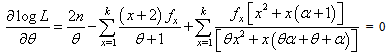 | (4.3) |
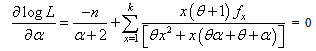 | (4.4) |
The two equations (4.3) and (4.4) are difficult to solve directly. However, the Fisher’s scoring method can be applied to solve these equations. For, we have | (4.5) |
 | (4.6) |
 | (4.7) |
using which the equations  | (4.8) |
can be solved for the estimates,  and
and  . where
  and
and  are the initial values of
  and
and  respectively. These equations are solved numerically and iteratively till sufficiently close estimates
  and
and  are obtained.
4.2. Method of Moments
The SBQPLD has two parameters to be estimated and so its first two moments are required to get the estimates of its parameters by the method of moments.From (3.5) and (3.6) we have | (4.9) |
which gives a quadratic equation in  as
as  | (4.10) |
Replacing the first two population moments by the respective sample moments in (4.9) an estimate k of K can be obtained and using it in (4.10), an estimate  of
of  can be obtained.Again, substituting the value of
  in (3.3) and replacing the population mean by the sample mean
  , an estimate of
  is obtained as
  | (4.11) |
5. Goodness of Fit
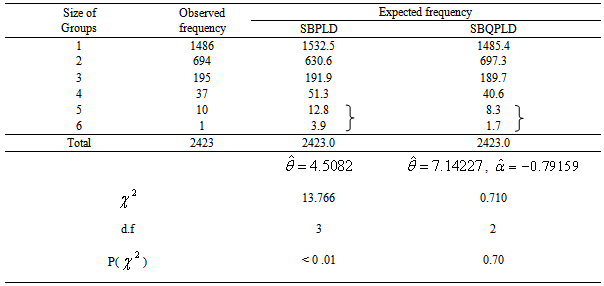
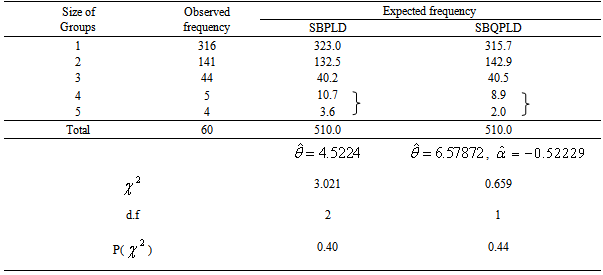
The SBQPLD has been fitted to a number of data- sets related to a number of observations of the size distribution of ‘freely –forming’ small groups in various public situations reported by James[6], Coleman and James[2], and Simonoff[15] and it was found that to all these data -sets, the SBQPLD provides closer fits than the SBPLD. The fittings of the SBQPLD to only three such data-sets have been presented in the following tables. The expected frequencies according to the SBPLD have also been given in these tables for ready comparison with those obtained by the SBQPLD. The estimates of the parameters have been obtained by the method of maximum likelihood using the Fisher’s scoring method.It can be seen that the SBQPLD gives much closer fits than the SBPLD and thus provides a better alternative to the SBPLD.Table 1. Counts of groups of people in public places on a spring afternoon in Portland
 |
| |
|
Table 2. Counts of Shopping Groups-Eugene, Spring, Department Store and Public Market
 |
| |
|
Table 3. Counts of Play Groups-Eugene, Spring, Public Playground D
 |
| |
|
6. Conclusions
In this paper, a size-biased quasi Poisson-Lindley distribution (SBQPLD), of which the size-biased Poisson-Lindley distribution (SBPLD) is a particular case, has been introduced to model count data. A general expression for the  factorial moment of this distribution has been obtained and hence its first four moments about origin of this distribution have been obtained. The method of maximum likelihood and the method of moments of estimation of its parameters have been discussed. The distribution has been fitted to some data- sets and it has been found that to all these data- sets it provides closer fits than the SBPLD. The SBQPLD has been found more general in nature and wider in scope than SBPLD. It provides closer fits to observed data-sets than those provided by the SBPLD and hence it should be preferred to the SBPLD while modeling count data-sets.
ACKNOWLEDGEMENTS
The authors express their thankfulness to the learned referee for his valuable comments and suggestions which improved the quality of the paper.
References
| [1] | Barlow,R.E. and Proschan, F. (1981): Statistical Theory of Reliability and Life Testing, Silver Spring, MD |
| [2] | Coleman, J.S. and James, J. (1961): The equilibrium size distribution of freely forming groups, Sociometry, Vol. 24, pp. 36 – 45 |
| [3] | Fisher, R.A. (1934) : The effects of methods of ascertainment upon the estimation of frequency, Ann. Eugenics, Vol. 6, pp. 13-25. |
| [4] | Ghitany, M.E., Al-Mutairi, D.K. (2008 ): Size-biased Poisson-Lindley distribution and its applications, Metron, Vol. LXVI, No. 3, pp. 299 – 311 |
| [5] | Gove, H. J. (2003): Estimation and application of size-biased distributions in forestry, In Modeling Forest systems, A. Amaro, D. Reed and P. Soares, CAB International, Wallingford, U.K., 201-212. |
| [6] | James, J. (1953): The Distribution of Free-Forming Small Group Size, American Sociological Review, Vol. 18, pp. 569 – 570. |
| [7] | Lappi, J. and Bailey, R. L. (1987): Estimation of diameter increment function or other relations using angle-count samples, Forest Science, Vol. 33, 725-739. |
| [8] | Lindley, D.V.(1958) Fiducial distributions and Bayes’ theorem, Journal of the Royal Statistical Society, Series B, Vol. 20, pp. 102- 107 |
| [9] | Patil, G. P. and Rao, C. R. (1977): The weighted distributions: A survey and their Applications, In Applications of Statistics, (Ed. P. R. Krishnaiah), 383-405, North Holland Publications Co., Amsterdam. |
| [10] | Patil, G. P. and Rao, C. R. (1978): Weighted distributions and size-biased sampling with applications to wild life populations and human families, Biometrics, Vol. 34 179-189. |
| [11] | Rao, C. R. (1965): On discrete distributions arising out of methods on ascertainment, Classical and Contagious Discrete Distribution, Patil, G.P. (Ed), Statistical Publishing Society, Calcutta, pp. 320-332 |
| [12] | Sankaran, M (1970): The discrete Poisson-Lindley distribution, Biometrics, Vol. 26, pp. 145 – 149. |
| [13] | Shanker, R. and Mishra, A. (2013 a): A quasi Lindley distribution, African Journal of Mathematics and Computer Science Research, Vol 6 (4), 64 – 71. |
| [14] | Shanker, R. and Mishra, A. (2013 b): A quasiPoisson-Lindley distribution (Communicated) |
| [15] | Simonoff, J.S. (2003): Analyzing Categorical Data, New York Springer. |
| [16] | Van Deusen, P.C. (1986): Fitting assumed distributions to horizontal point sample Diameters, Forest Science, Vol. 32, 146-148. |
 Abstract
 Reference
 Full-Text PDF
 Full-text HTML