Salifu T. Azeko1, 2, Suleman Nasiru2, Benjamin Agyei-Tuffour1, 3, Emmanuel K. Arthur1, John D. Obayemi1
1Department of Materials Science and Engineering, African University of Science and Technology (AUST), P.M.B 681, Garki, Abuja F.C.T, Nigeria
2Department of Statistics, University for Development Studies (UDS), Navrongo-campus, P. O. Box 24, Navrongo, Ghana
3Department of Materials Science and Engineering, Private Mail Bag, University of Ghana, Legon, Accra, Ghana
Correspondence to: Salifu T. Azeko, Department of Materials Science and Engineering, African University of Science and Technology (AUST), P.M.B 681, Garki, Abuja F.C.T, Nigeria.
| Email: |  |
Copyright © 2012 Scientific & Academic Publishing. All Rights Reserved.
Abstract
Decrements have become a great concern in the society. There have been a lot of reported deaths cases worldwide. This calls for the need to find the probabilities of decrements and the appropriate solutions to addressing this problem. The current research proposed a modification of the multiple decrements model that can be used in determining the probabilities of deaths and survivals in Northern Ghana. The region was demarcated into north and east and south and west zones. Simple Random Sampling (SRS) and Systematic Sampling (SS) were then employed to collect the data. It was realized that, all other causes of decrements recorded the highest net probabilities of decrements of 0.81553 as expected. More so, cardiovascular and accident recorded the second and third net probabilities of decrements of 0.06953 and 0.05993 respectively. Malaria and cancer recorded the least net probabilities of decrements of 0.0401 and 0.01491 respectively. The age group 35-49 recorded the highest force of decrement of 0.2904, whilst the age groups 20-34 and 50-59 respectively recorded the second and third force of decrement of 0.2098 and 0.1235.
Keywords:
Multiple Decrement, Probability of Decrement, Probability of Survival, Force of Decrement, Simple Random Sampling, Systematic Sampling, Times Series
Cite this paper: Salifu T. Azeko, Suleman Nasiru, Benjamin Agyei-Tuffour, Emmanuel K. Arthur, John D. Obayemi, Modification of a Multiple Decrement Model and Its Significance: A case study of Northern Ghana, International Journal of Probability and Statistics , Vol. 2 No. 2, 2013, pp. 21-27. doi: 10.5923/j.ijps.20130202.02.
1. Introduction
Multiple Decrements can be referred to as the life expectancy of the termination of an individual member in a cohort. This may be due to certain factors that slowly wear down the individual[1, 2]. The idea of multiple decrements came about using the knowledge of competing risks and stochastic process in the form of models[3]. This has led to the similarities between multiple decrements and stochastic processes since both of them follow similar patterns. The death of an individual is inevitable and occurs randomly and accidentally, hence treated as a stochastic process[4, 5, 6]. Actuary applies the principle of multiple decrements in the construction of life tables. This enables them to predict the actual time an individual attained a certain age before termination in a cohort[7]. The probability of survival is calculated using the death and survival functions to predict the number of years a person will live before death[3]. Recently, multiple decrements are used in health application[8]. They are referred to in the public health sector as the cause of death either by cardiovascular disease, cancer, accident or any other cause(s). Mortality rates are always important to health planners and this makes them interested in analysing the cause of deaths associated with it[3]. They also study the survivorship and the joint distribution of time before death and cause of death. According to Make Ham and Nesbitt[9, 10], the earliest researches were able to determine the maximum age an individual could attain before failure (death). This group of researchers were named the founding fathers for the Actuarial theory of multiple decrements for their numerous efforts and contributions to the society. The data collection system in the United States can be used as a case study in determining decrements. It showed that, older women were easily prone to illness than older men. For this reason, older women frequently go for medical examinations than their male counterparts[11]. However, older women happen to survive more years than their male counterparts, which could be attributed to disparities in biological, physiological and other factors which are yet to be known. With this data system, a model will be more applicable in studying the effects and causes of decrements with their probabilities for older men and women and other related problems.One of the most dreadful diseases in Africa is Malaria. This disease is widespread in about ninety (90) different countries in the world and of which Africa constitutes nearly half of it. Studies conducted in 1995 in the northern part of Ghana showed the possibility of many people being saved by diseases[12]. This was because, at a given age and cause specific mortality conditions within a specified time, life expectancy is likely to increase. By applying this principle, one third of the death was noticed to be malaria and terminated thereby increasing the life expectancy of the population. However, this approach is useful in determining only one cause of death within a specified period of time. It is therefore important to determine a universal multiple decrement model that will be used for all cause of deaths within a given period of time.The current research recommended the modification of a multiple decrement model that can be applied in determining the probabilities of deaths and survivals in Northern Ghana. Once a particular cause of decrement is identified, the model will be used in determining the trend of deaths with their various probabilities of decrements. This research considered causes of decrements as a result of cardiovascular, cancer, accident, malaria and any other causes.
2. Materials and Methods
Qualitative and quantitative approach was used in this research to obtain the stipulated objectives.
2.1. Data Collection Procedure
Data collection was designed to cover the entire terrains of northern Ghana. This involves the use of data such as interviews and field surveys. It was ensured that every area in the region was covered by the appropriate sampling technique used. The region was divided into two sectors namely; north and east and south and west zones respectively. Interviews were carried out based on the houses in the region using simple random sampling (SRS) in the north and east zones and systematic sampling (SS) in the south and west zones. The SRS is a type of sampling technique where every member/element in the population has the same chance (non-zero probability) of being selected into the sample[13, 14]. This technique gives its members an equal opportunity of being selected in the population, thereby giving every member the same probability of being selected. In this method, houses within the north and east zones of the region were chosen randomly with a sample size of hundred (100) and interviews were carried out to determine the number of decrements and the cause of deaths with their corresponding age groups.The SS is a sampling technique that ensures that every unit in the population has an equal chance of being selected into the sample[15, 16, 17]. With this technique, the first unit is determine randomly and the remaining ones identified by a sampling interval. In this method, the entire houses in the south and west zones of the region were first arranged serially in a row with a group of sample size of fifty (50). SRS was then applied in the first group to select the first sampling unit. Once the first sampling unit was chosen, the remaining houses were selected from the other groups with an interval of ten (10) houses. This continued until the last house was obtained. In each house of the sampling unit, interviews were carried out to determine the number and cause of decrement with their corresponding age groups. The field surveys that were used in this research include: data collected at the Bolgatanga central hospital, Asankune Memorial clinic and Afrikids clinic all in the Northern Ghana.
2.2. Model Development and Data Analysis
In proposing a universal multiple decrements model, it is necessary to take into consideration the causes of decrements. In this model, we design to depend only on a particular disease that causes decrements in the region. A decrement model can be defined using the single decrement function below[3]:  | (1) |
From the above equation, the net probability of decrement,  can be obtained as
 | (2) |
where,  = net probabilities of survival
 = net probabilities of decrement or absolute rate of decrement
 = force of decrement due to cause jn = time period (interval)The Probability of Decrement due to Cause j is given as
 | (3) |
Where,  = Single decrement cause of a particular age group
 = The total cause of decrement for all age group
 | (4) |
Where j = Cause of decrement and could be assigned to values of 1, 2, 3,4 or 5 depending on whether death was caused by cardiovascular, cancer, accident, malaria or any other cause(s) respectively. The probability of decrement for all causes can be defined as  , which is given below as
 | (5) |
From equation (3), the probability of survival for all causes can be defined as | (6) |
The force of decrement due to cause j in the cohort  is given by the formula below[3]:
 | (7) |
The above equations were used to calculate the net probabilities of decrement and survival as well as force of decrement for the various causes of deaths. Minitab Model 15, Princeton, New Jersey, USA was used in analysing the estimates derived from the equations as stated above.
3. Results and Discussion
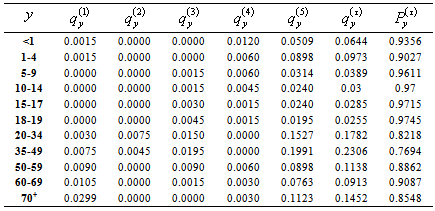
Tables 1, 3 and 4 present the net probabilities of decrements and survivals as well as the force of decrement respectively in Northern Ghana. The results revealed that, cardiovascular disease with the net probability of decrement of 0.06953 is the highest aside ‘’all other causes’’ of decrement. The least probable decrement was cancer with net probability of decrement of 0.0149. Also, accident and malaria decrement net probabilities were 0.05993 and 0.0401 while ‘’All other causes’’ recorded 0.81553 respectively. The result obtained for the decrement of all other causes was as expected; however, it appears a significant number of people die as a result of cardiovascular related problems. For instance, out of a population of ten thousand (10,000) people, six hundred and ninety-five (695) of them die as a result of cardiovascular disease. Also, the number of deaths recorded for accident was high and out of a population of 10,000 people, five hundred and ninety-nine (599) individuals die as a result of it. An overall of 7% of the mortality rate in the region did not survive in 2008, due to deaths recorded by cardiovascular and accident only. The net probability of survival as indicated in Table 3 was obtained using equation (1), to derive the various probabilities.Inasmuch as decrement is of great concern, it is also imperative that one consider the pattern within their respective age groups. The age group in which decrement occurred most in the region is 35-49. This class of individuals recorded a net probability of decrement of 0.2399, constituting 24% of the total death cases recorded in 2008 within Northern Ghana. The age groups 20-34 and 50-59 recorded the second and third deaths with net probabilities of decrements of 0.1769 and 0.1115 respectively. From the analysis above, it is noticed that the age group 20-49 died most with probabilities of decrements of 0.4168, constituting an overall of 42% of the mortality rate recorded in the region of Northern Ghana.| Table 1. Net Probability of Decrement |
|

| n q'y(1) | n q'y(2) | n q'y(3) | n q'y(4) | n q'y(5) | | <1 | 0.0015 | 0 | 0 | 0.0128 | 0.041 | | 1-4 | 0.0015 | 0 | 0 | 0.0056 | 0.0701 | | 5-9 | 0 | 0 | 0.00155 | 0.0052 | 0.03095 | | 10-14 | 0 | 0 | 0.00154 | 0.0036 | 0.02223 | | 15-17 | 0 | 0 | 0.00307 | 0.0014 | 0.02136 | | 18-19 | 0 | 0 | 0.0041 | 0.001 | 0.01878 | | 20-34 | 0.00312 | 0.00908 | 0.01809 | 0 | 0.14657 | | 35-49 | 0.0082 | 0.00583 | 0.02002 | 0 | 0.2058 | | 50-59 | 0.01004 | 0 | 0.01004 | 0.0057 | 0.08575 | | 60-69 | 0.01105 | 0 | 0.00152 | 0.0023 | 0.07028 | | 70+ | 0.03412 | 0 | 0 | 0.0025 | 0.10271 |
|
|
Table 2. Probability of Decrement
 |
| |
|
| Table 3. Net Probability of Survival |
|

| n p 'y(1) | n p' y(2) | n p 'y(3) | n p' y(4) | n p' y(5) | | <1 | 0.9985 | 1 | 1 | 0.9872 | 0.959 | | 1-4 | 0.9985 | 1 | 1 | 0.9944 | 0.9299 | | 5-9 | 1 | 1 | 0.99845 | 0.9948 | 0.96905 | | 10-14 | 1 | 1 | 0.99846 | 0.9964 | 0.97777 | | 15-17 | 1 | 1 | 0.99693 | 0.9986 | 0.97864 | | 18-19 | 1 | 1 | 0.9959 | 0.9999 | 0.98122 | | 20-34 | 0.99668 | 0.99092 | 0.98191 | 1 | 0.85343 | | 35-49 | 0.9918 | 0.99417 | 0.97998 | 1 | 0.7942 | | 50-59 | 0.98996 | 1 | 0.98996 | 0.9943 | 0.91425 | | 60-69 | 0.98895 | 1 | 0.99848 | 0.9977 | 0.92972 | | 70+ | 0.96588 | 1 | 1 | 0.9975 | 0.89729 |
|
|
Table 4. Force of Decrement
 |
| |
|
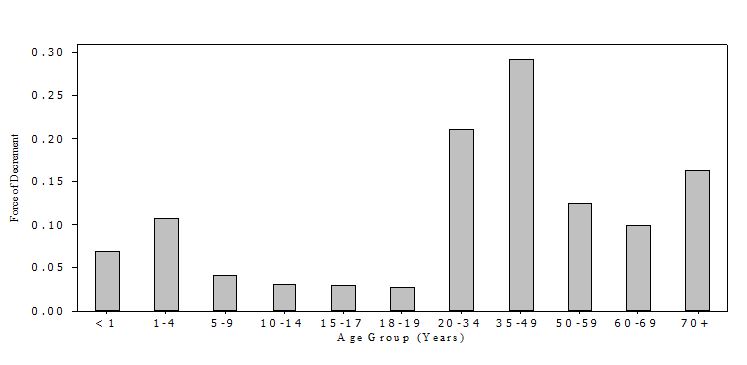 | Figure 1. A Plot Depicting the Force of Decrement with its Corresponding Age Group |
This portion of the people constitutes the youthful age group in the region. This implies that, more deaths of this age group will lead to a decreased in the labour force and will have an adverse effect on the development projects in the region and the country at large.More so, the result for the force of decrement is derived from equation (7) as illustrated in Table 4. The results clearly show that, age group 35-49 recorded a force of decrement values of 0.2904, representing 29% of the total mortality rate as shown in Figure 1. The age group 20-34 and 50-59 recorded as expected, the second and third force of decrement values of 0.2098 and 0.1235 respectively. The results obtained for the force of decrement did not deviate much from the probability of decrement of the various causes of death as illustrated in Table 2.The time series plot as illustrated in Figure 2 was obtained using Minitab software package (Minitab Model 15, Princeton, New Jersey, USA). The plot presented the causes of decrements with their respective ages. It was observed that, the trend of decrements for the total deaths recorded in the region occurred most at the age group of 35-49, constituting 23% of the total mortality rate. Also, decrements caused by accident and cardiovascular is quite alarming and hence, the need to find solutions to the problems.Furthermore, the low value of Anderson-Darling (AD) statistic and a probability value (p-value) greater than α = 0.05 as illustrated in Figure 3, implies how well the Weibull distribution fits the force of decrement data. Few of the force of decrement obtained were not too close to the fitted line, since the number of observations is small. Also, at the 50th and 60th percentiles, the force of decrement fitted the Weibull line. This revealed that, the force of decrement is a major factor in determining the magnitude of decrement in the region.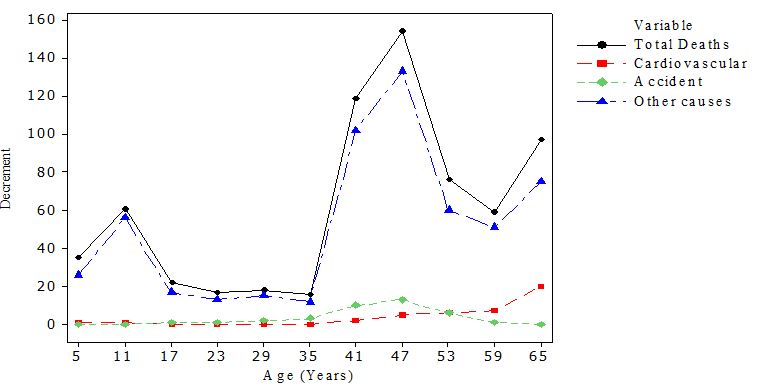 | Figure 2. Times Series Plot showing Decrement Pattern with Respect to Age |
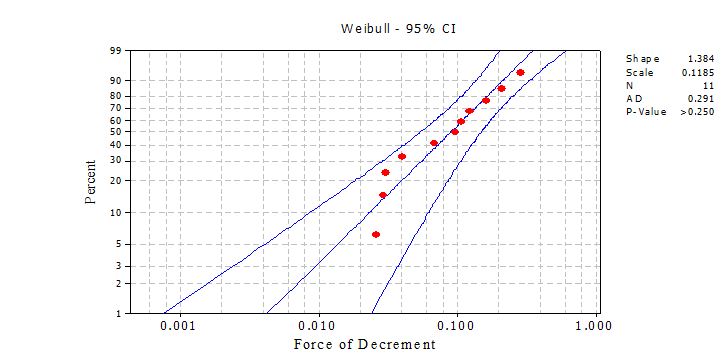 | Figure 3. Probability Plot for Force of Decrement using Weibull Distribution |
 | Figure 4. Fitted Line Plot Illustrating Force of Decrement versus Probability of Decrement |
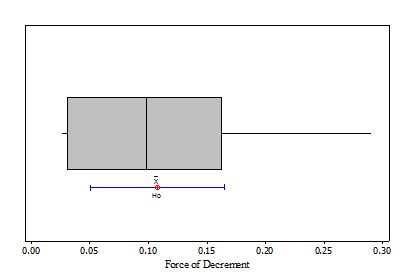 | Figure 5. Boxplot showing Force of Decrement with the mean and median as well as the first and third quartile |
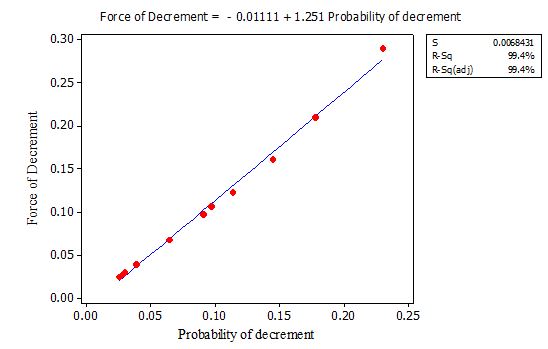
The null hypothesis (Ho) falls within the 95% confidence interval as illustrated in Figure 5. There is not enough evidence to reject Ho, since it lies within the critical (acceptance) region. The force of decrement is concluded as a contributing factor in determining the severity of decrement in northern part of Ghana.Last but not the least, the fitted line plot as illustrated in Figure 4 presented the correlation between force of decrement and probability of decrement. A positive linear correlation exists between the two estimates. Hence, increase in the force of decrement leads to increase in the probability of decrement and vice versa. The plot further gave good results for the values of R-square and R-square adjusted. This revealed that, force of decrement and probability of decrement are very significant and essential in determining the magnitude of decrement in Northern Ghana.
4. Implications
The multiple decrements model proposed in the research was able to predict, the net probabilities of decrements and survivals as well as the force of decrement in Northern Ghana. The results clearly show that, cardiovascular and accident recorded the highest net probabilities of decrements, with the exception of all other causes in the region. The age group 20-49 recorded the highest net probabilities and force of decrement of 0.4168 and 0.5002, constituting 42% and 50% respectively of the total mortality rate in Northern Ghana. Further research needs to be carried out in other regions in Ghana to ascertain the net probabilities and force of decrement patterns, due to its non- static and differences in environmental conditions.
5. Conclusions
This study has explored the use of a multiple decrement model in determining the probabilities of deaths and survivals in Northern Ghana. The study revealed cardiovascular and accident as the potential cause of decrement in the region in 2008. Also, the force and probability of decrements were found to be the major factors in determining the magnitude of decrement in the region. However, there is the need to ascertain the net probabilities of decrements and survivals for a longer period of time and also in other parts of Ghana, to determine the actual trend of decrements. The law of large numbers as well as the central limit theorem can be used to obtain the exact probabilities of decrements and survivals in Ghana and this gives the true representation of the population.
ACKNOWLEDGEMENTS
This research was supported by the Bolgatanga Central Hospital, Asankune Memorial Clinic and Afrikids clinic all within the region. The Authors are grateful to them for providing data used in the research.
References
| [1] | Dejian Lai, Robert J Hardy. Potential gains in life expectancy or years of potential life lost: impact of competing risks of death. International Journal of Epidemiology, 28:894-898, 1999. |
| [2] | Tsai S P, Lee E S, Hardy R J. The effects of a reduction in leading causes of deaths: potential gains in life expectancy. Am J Public Health, 68:966-71, 1978. |
| [3] | Newton L. Bowers, Hans U. Gerber, James C. Hickman, Donald A. Jones, Cecil A. Nesbitt. Actuarial Mathematics, 2nd edition |
| [4] | Howard M. Taylor, Samuel Karlin. An introduction to Stochastic Modeling, 3rd Edition |
| [5] | Chiang C L. Introduction to Stochastic Processes in Biostatistics. New York: John Wiley, 1968. |
| [6] | Salifu Tahiru Azeko, John Obayemi, Ali Azeko Salifu. Multiple decrements in the Bolgatanga Municipality of Ghana. Lambert Academic Publishing, 2012. |
| [7] | Lee W C. Quantifying the future impact of disease on society: life table-based measure of potential life lost. Am J Public Health, 87: 1456-60, 1997. |
| [8] | TZY-MeyKuo, C. M. Suchindran, Helen P. Koo.The Multistate Life Table Method: An Application to Contraceptive Switching Behavior. Demography, 45(1): 157-171, Feb, 2008. |
| [9] | Make ham, W.M. On an application of the theory of the composition of decremental forces, Journal of the Institute of Actuaries (London), 18, 317-322, 1874. |
| [10] | C. J. Nesbitt and M. L. Van Eenam.Rate functions and their Role in Actuarial Mathematics, pp. 202—222. |
| [11] | Lois M. Verbrugge. Multiple Roles and Physical Health of Women and Men.Journal of Health and Social Behaviour, Vol. 24. No. 1, 1983. |
| [12] | Ayaga A. Bawah, Fred N. Binka. How Many Years of Life Could Be Saved If Malaria Were Eliminated from a Hyperendemic Area of Northern Ghana? No. 203, 2005. |
| [13] | M. S. Avadhani, B. V. Sukhatme. Simplified procedures for designing controlled Simple Random Sampling. Austrlian Journal of Statistics, vol. 10, issue 1, p 1-7, 1968. |
| [14] | Cem Kadilar, HulyaCingi. Ratio estimators for the population variance in simple and stratified random sampling. Applied mathematics and computational, vol. 73 issue 2, p1047-1059, 2006. |
| [15] | Cochran, W. G. Relative accuracy of systematic and stratified random samples for a certain class of populations. Annals of Mathematical Statistics, 17: 164-177, 1946. |
| [16] | Das, A.C. Two-dimensional Systematic Sampling and the associated Stratified and random sampling. Sankhya, 10: 95-108, 1950. |
| [17] | Zarkovic, S. S. On the efficiency of sampling with various probabilities and the selection of units with replacement. Metrika, 3: 53-60, 1960. |
 Abstract
 Reference
 Full-Text PDF
 Full-text HTML