-
Paper Information
- Previous Paper
- Paper Submission
-
Journal Information
- About This Journal
- Editorial Board
- Current Issue
- Archive
- Author Guidelines
- Contact Us
International Journal of Probability and Statistics
p-ISSN: 2168-4871 e-ISSN: 2168-4863
2012; 1(5): 160-163
doi: 10.5923/j.ijps.20120105.03
Determination of Suitable Probability Distribution for Annual Mean and Peak Discharges Estimation (Case Study: Minab River- Barantin Gage, Iran)
 Abstract
 Reference
 Full-Text PDF
 Full-Text HTML
Gh. Khosravi1, A. Majidi1, A. Nohegar2
1Watershed management, Natural Resources Faculty, Hormozgan University, Iran
2Natural Resources Faculty, Hormozgan Agricultural Sciences & Natural Resources University, Iran
Correspondence to: A. Majidi, Watershed management, Natural Resources Faculty, Hormozgan University, Iran.
| Email: |  |
Copyright © 2012 Scientific & Academic Publishing. All Rights Reserved.
Different methods are employed in applying probability distribution in hydrology. The most common among these methods is the Probability Distribution method. In this study in order to determine suitable probability distribution for estimating of annual discharge series with different return periods, annual mean and peak discharges over a 30 years’ time period had been collected from Minab river (Barantin gage) in Hormozgan province, Iran. After homogeneity and adequacy test, data has analyzed by SMADA software and residual sum of squares (R.S.S). The best probability distribution selected according to SMADA output and R.S.S results. Log Pearson type III with R.S.S (124.4) for annul peak discharge and Log Pearson type III and then Pearson with R.S.S (1.16) and (1.9) demonstrated the most fitting respectively, for annual mean discharge.
Keywords: Probability Distribution, Log Pearson Type III, SMADA, Brantin-Minab , Iran
Cite this paper: Gh. Khosravi, A. Majidi, A. Nohegar, "Determination of Suitable Probability Distribution for Annual Mean and Peak Discharges Estimation (Case Study: Minab River- Barantin Gage, Iran)", International Journal of Probability and Statistics, Vol. 1 No. 5, 2012, pp. 160-163. doi: 10.5923/j.ijps.20120105.03.
Article Outline
1. Introduction
- In hydrology cannot determinate time of phenomenon occurrence such as floods or discharge but can investigate previous events occurrence procedure and obtain their mean probability of occurrence. Calculation of mean probability of occurrence or floods mean return periods can help to solve many problems. For example, in the flood control projects calculated the annual mean flood damage and also design of structures dimension such as dam spillway conducts with regard to probability of floods occurrence and discharges related to them[10]. The information and data were recorded in the past will help to us until obtain some statistic parameters and then will forecast events that may occur in the future. In hydrology use of physical models not possible for future events forecasting and most use the single models that system describes based on mathematical terms and concepts. One of current methods in discharge estimation with different return periods is statistical distributions[3]. Frequency analysis of floods and precipitation extreme values, the magnitude of this phenomenon and also their frequency give appropriate information for different analysis such as determination of risk criterions and reliability in the design of structures. This analysis provides this possible until the frequency value of events that are more than their observational value estimated during the period of data record. This estimate can be expressed using the concept of event return period[5]. Theoretically, there are different probability functions that were recorded and measurement tentative. Function that has more consistent with the desired data will select as a probability distribution until can obtain hydrology variable value per each probability from it[1]. Several researches have conducted about probability distributions [8,6,13,7, 9,11,2]. Bedustani in the research of types of frequency distributions for forecasting maximum floods values found that appropriate statistical distribution for 10-35 years data series is three parameters Log-normal distribution and for long data series more than 35 years is Log Person type III distribution[4]. Vogel and Fennrssy have done a study in 91 regions in Australia and their results showed that extreme values, pareto, Log Person type III and two parameters Log-normal distributions were suitable[12]. More research was done on flood flows and manuscripts about mean and minimum flows are not comparable with floods series[9]. For the water balance project for a region uses mean discharges whereas the water balance computation by use of maximum discharges more shows region water volume. In this research to obtain statistical distributions in discharges series with different return period, instantaneous peak and annual mean discharges from Minab River (Berentin gage, Hormozgan province, Iran) was collected during 30 years period and after homogeneity test and statistical adequacy were compared and evaluated by use of SMADA software graphical test and Residual sum of squares (R.S.S).
2. Data and Methodology
2.1. Study Area
- Minab River in Hormozgan province is formed from connecting Roodan and Jaghin rivers. Statistical analysis of flows passing from Minab River shows that although the numbers of months of the year (especially in recent years) extremely reduce the water flow but it never reaches to zero and therefore Minab river is a perennial river. Berentin gage is located between 57°11'29" E and 27°16'21" N. Upstream watershed area of Berentin gage is 10200 square kilometers and located at altitude of 130 meters above sea level. This gage has equipment and Statistics relate to this gage is as well as evaluated. Figure (1) shows the study area location.
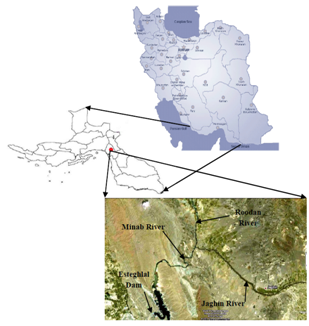 | Figure 1. The study area location |
2.2. Study Method
- In this study was collected instantaneous peak and annual mean discharges data during 1981-1982 until 2010-2011 periods and with regard to used data must have three conditions of adequacy, accuracy and relevance[10] was controlled mentioned gage data. For this purpose with regard to possible deficiencies in the statistics mentioned gage discharges, first, deficiencies of instantaneous peak and annual mean discharges was controlled, reconstructed and prolonged and data homogeneity was tested by Run Test method eventually and statistics were confirmed in 95% confidence level. In order to access to instantaneous peak and annual mean discharges changes with different return periods was used theoretical probability distributions. It provides to estimate the water potential of mentioned river with different return periods. In this method instantaneous peak and annual mean discharges statistics during period estimated by use of SMADA software and the most suitable of statistical distributions were determined with comparison of observational and predicted data. For determining the most suitable statistical distributions, the distribution is appropriate that has the best fitting with predicted values. One of the methods of selecting the best distribution and fitting values is Residual sum squares (R.S.S) for each distribution. R.S.S calculates using equation (1).
 | (1) |
3. Results and Discussion
- Tables (1&2) show instantaneous peak and annual mean discharge values in different return periods using different distributions. Figure (2) is shown fitting observational and predicted instantaneous peak using Log Pearson III distribution and figure (3) is shown fitting observational and predicted annual mean discharges values using 2parameters log-normal as examples. And finally, table (3) is shown R.S.S values for different distributions.
| ||||||||||||||||||||||||||||||||||||||||||||||||||||||||||||||||||
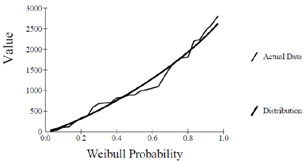 | Figure 2. Observational and predicted instantaneous peak discharges values of log Pearson III distribution by SMADA |
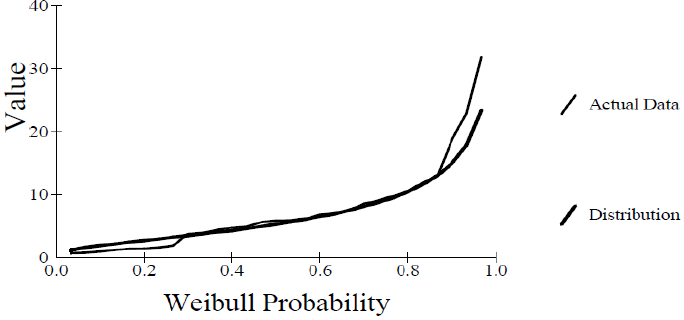 | Figure 3. Observational and predicted annual mean discharges values of 2parameters log-normal distribution by SMADA |
| ||||||||||||||||||||||||||
4. Conclusions
- Computation of flood average probability of occurrence or average return periods can help to solve many problems. For example, in the flood control projects and also design of structures dimension such as dam spillway conducts with regard to probability of floods occurrence and discharges related to them. For the water balance project for a region uses mean discharges whereas the water balance computation by use of maximum discharges more shows region water volume. The results of statistical distributions in estimating instantaneous peak discharges with different return periods showed that predicted values in Log Pearson type III distribution had the best fitting with observational data and it had the lowest R.S.S value (124.4) than the other distributions too. Therefore this distribution is the most suitable for estimating instantaneous peak discharges. Also, Log Pearson type III distribution is the most suitable distribution for estimating annual mean discharges with different return periods and then Pearson type III distribution is suitable with R.S.S values (1.16 & 1.9) had the best fitting respectively.
References
| [1] | Abdi Kardavani, A. and Fakherifar, A., 2009, Frequency distribution analysis of River peak discharges by use of linear moments, 4th National civil engineering conference, Tehran university, 1-7. |
| [2] | Abida, H. and Ellouze, M., 2007, Probability distribution of flood flow in Tunisia, Hydrology and earth system sciences discussions, 4, 957-981. |
| [3] | Alizade, A., 2011, Principles of Applied Hydrology, nineteenth edition, Mashhad University press. 807pp. |
| [4] | Bedustani, H., 2000, Evaluation of the most suitable frequency distribution for flood forecasting and maximum precipitation with specified probability of occurrence in East Azerbaijan, M.Sc. Thesis. Tarbiat Moddares University. p148. |
| [5] | Hadian, M. Habibnezhad roshan, M. and Omidvar, A., 2011, Evaluation of different statistical distributions in instantaneous peak discharges with different return periods in Tajen watershed. 6th National science and watershed engineering conference. 1-8. |
| [6] | Hosking, J. R. M. and Wallis, J. R. M., 1993, Some statistical useful in regional frequency analysis, Water Resources Research, 29, 2, 271-281. |
| [7] | Kjeldsen, T. R. Smithers, J. C. and Schulze, R. E., 2001, Regional Flood Frequency Analysis in the KwaZulu-Natal Province, South Africa, Using the Index-Flood Method, Journal of Hydrology, 255, 194-211. |
| [8] | Lindly, D. V., 1983, Reconciliation of probability distributions, Operation research, 31, 866-880. |
| [9] | Mahdavi, M. Salajegheh, A. Keshtkar, A. R. Fahmi, H. and Sharifi, F., 2006, A Study of the Appropriate Probability Distributions for Annual Flow Series, Using L-Moment Method in Arid and Semi-arid Regions, Iranian journal of natural resources, 59, 1, 74-87. |
| [10] | Mahdavi, M., 2010, Applied Hydrology, Vol. 2, Tehran University press. p437. |
| [11] | Tavakoli, M. and Rostaminia, M., 2006, Modeling the regional flood in Ilam province basins, Journal of Agricultural Science, 12, 2, 347-357. |
| [12] | Vogel, R. M. and Fennrssy, N., 1993, L-moment diagrams should replace product moment diagrams, Water Resources Research, 29, 6, 1745- 1752. |
| [13] | Vogel, R. and Wilson, I., 1996, Probability Distribution of Annual Maximum, Mean & Minimum Stream Flows in the United States, Journal of Hydrologic Engineering, 12, 69-76. |