Navid Feroze1, Muhammad Aslam2
1Department of Mathematics and Statistics, Allama Iqbal Open University, Islamabad, Pakistan
2Department of Statistics, Quaid-i-Azam University, Islamabad, Pakistan
Correspondence to: Navid Feroze, Department of Mathematics and Statistics, Allama Iqbal Open University, Islamabad, Pakistan.
| Email: |  |
Copyright © 2012 Scientific & Academic Publishing. All Rights Reserved.
Abstract
The Bayesian analysis of the scale parameter of error function distribution has been considered in this paper. A class of informative and non-informative priors has been assumed to derive the corresponding posterior distributions. The Bayes estimators and associated risks have calculated under different loss functions. The Bayesian credible intervals have been constructed under each prior. The performance of the Bayes estimators have been evaluated and compared under a comprehensive simulation study. The purpose is to find out the combination of a loss function and a prior having the minimum Bayes risk and hence producing the best results. The study depicts that in order to estimate the said parameter use of entropy loss function under informative priors can be preferred.
Keywords:
Squared Error Loss Function (SELF), Quadratic Loss Function (QLF), Entropy Loss Function (ELF), Precautionary Loss Function (PLF), Credible Intervals
Cite this paper:
Navid Feroze, Muhammad Aslam, "A Note on Bayesian Analysis of Error Function Distribution under Different Loss Functions", International Journal of Probability and Statistics, Vol. 1 No. 5, 2012, pp. 153-159. doi: 10.5923/j.ijps.20120105.02.
1. Introduction
The error function distribution is one of the most widely used distributions in statistics. Estimating its parameter using Bayesian inference is extremely useful. Eberly and Casella[1] discussed the construction of Bayesian credible intervals using Rao–Blackwellized construction which offers smallest standard error of estimate. Korsgaard et al.[2] considered the multivariate normal distribution and concentrated on the model where residuals associated with liabilities of the binary traits have been assumed to be independent. A Bayesian analysis using Gibbs sampling has been outlined for the model where this assumption has been relaxed. Wang[3] proposed a criterion to choose a loss function in Bayesian analysis. Liang[4] introduced and derived Dempster EM-Algorithm for the two-component normal mixture models to obtain the iterative computation estimates, also used data augmentation and general Gibbs sampler to get the sample from posterior distribution under conjugate prior. Wang[5]developed the new method, called matrix-variate graphical models (MGGMs), which involves simultaneously modeling variable and sample dependencies with the matrix-normal distribution. Khan and Islam[6] evaluated the maintenance performance of the system when time is continuous and consider half-normal failure lifetime model as well as repair time model. However, error function distribution has rarely received the attention of the analysts. But it is always of interest to study the behaviour and properties of the estimators for the parameters of the new/deprived distributions. So, the problem of estimation of the parameter of the error function distribution under a Bayesian framework has been addressed in this paper. A class of priors have been assumed under various loss functions to estimate the parameter of the distribution.
2. Model and Likelihood Function
The probability density function of error function distribution is: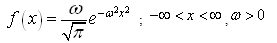 It is a special case of normal distribution with mean zero and considering
  where
where  is the standard deviation of the normal distribution. The likelihood function for a random sample of size ‘n’ is
3. Bayesian Analysis under the Assumption of Uniform Prior
The uniform prior is assumed to be:  The posterior distribution under the assumption of uniform prior is:
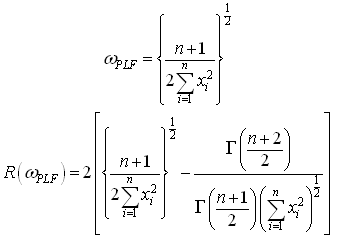
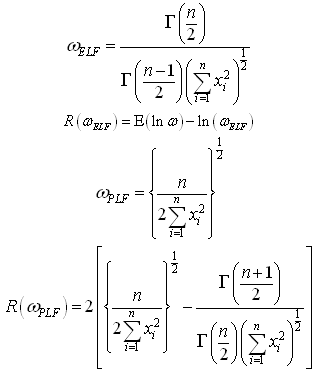
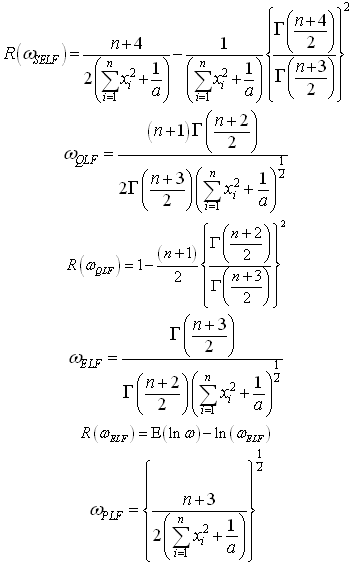
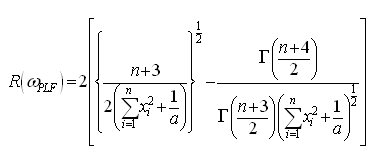
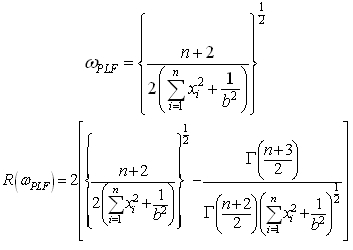
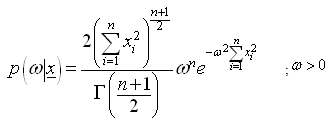 The Bayes estimators and risks under SELF, QLF, ELF and PLF are respectively presented in the following.
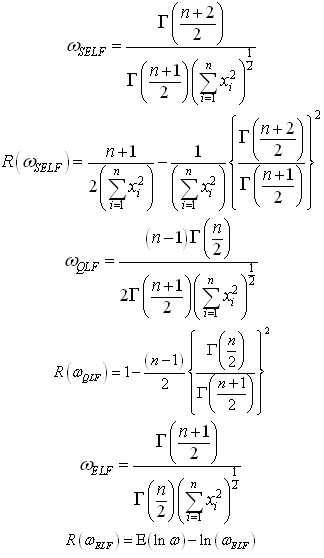
4. Bayesian Analysis under the Assumption of Jeffreys Prior
The Jeffreys prior is defined as: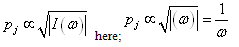 The posterior distribution under Jeffreys prior is:
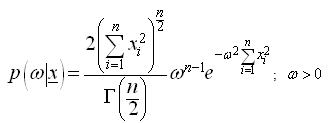 The Bayes estimators and risks under SELF, QLF, ELF and PLF are respectively given in the following.
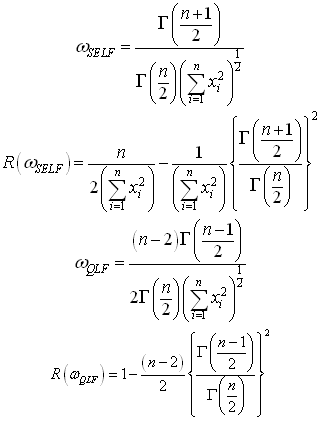
5. Bayesian Analysis under the Assumption of Maxwell Prior
The Maxwell prior is assumed to be: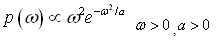 Where
Where  is hyper-parameterThe posterior distribution under Maxwell prior is:
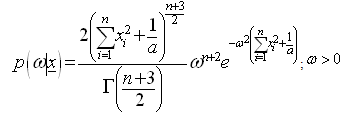 The Bayes estimators and risks under SELF, QLF, ELF and PLF are respectively shown in the following.
6. Bayesian Analysis under the Assumption of Rayleigh Prior
The Rayleigh prior is assumed to be: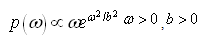 Where
Where  is hyper-parameter.The posterior distribution under Rayleigh prior is:
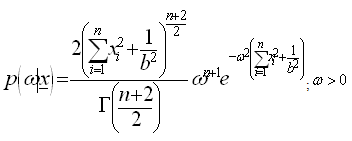 The Bayes estimators and risks under SELF, QLF, ELF and PLF are respectively presented in the following.
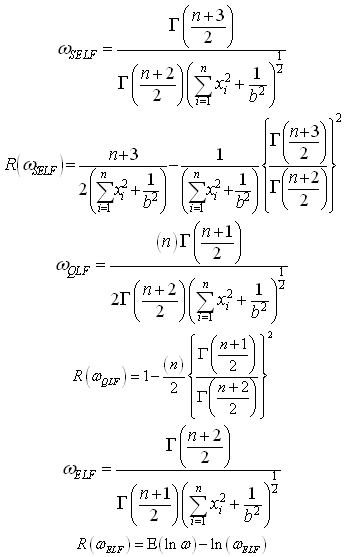
7. Bayesian Analysis under the Assumption of Chi Prior
The chi prior is assumed to be: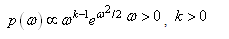 Where ‘k’ is hyper-parameter.The posterior distribution under chi prior is:
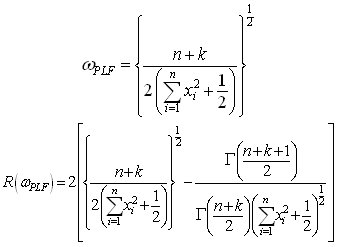
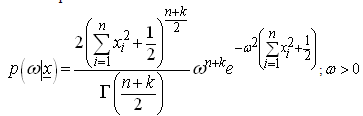 The Bayes estimators and risks under SELF, QLF, ELF and PLF are respectively derived in the following.
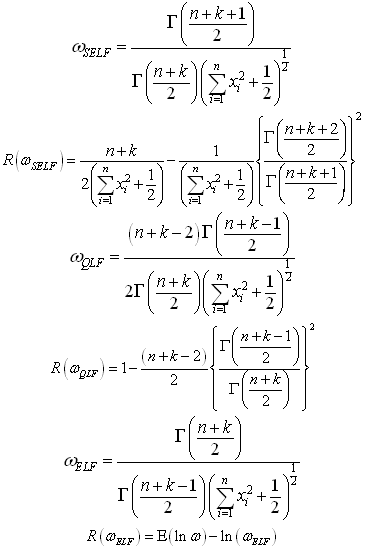
8. Bayesian Analysis under the Assumption of Normal Prior Considering Location Parameter to be Zero
The normal prior is assumed to be: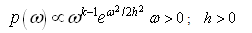 Where ‘h’ is hyper-parameter.The posterior distribution under normal prior is:
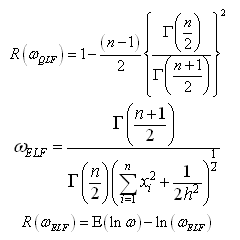
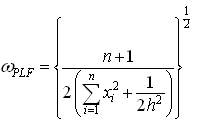
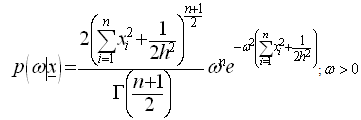 The Bayes estimators and risks under SELF, QLF, ELF and PLF are respectively presented in the following.
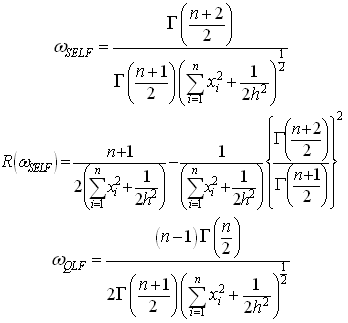
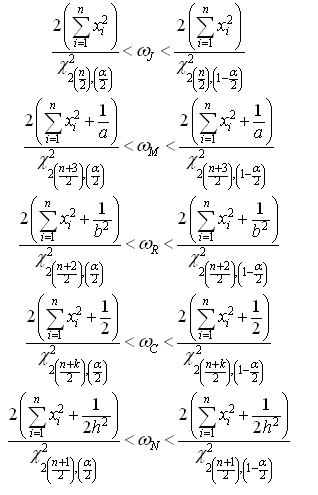
9. Bayesian Credible Intervals under Different Priors
The Bayesian credible intervals, as discussed by Saleem and Raza[7], under uniform, Jeffreys, Maxwell, Rayleigh, chi and normal priors are respectively constructed in the following.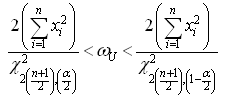
10. Simulation Study
Simulation study has been carried out using n = 50, 100, 200 and 300 for ; however, the results are presented for
 . While, the discussions have been made for all
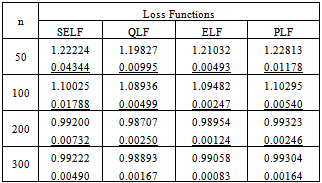
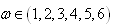 . Different values of the hyper-parameters have been used and the results for the values giving better convergence and the minimum risks have been presented. In order to have more precise estimates, the results have been replicated sufficiently. The risks associated with Bayes estimates have been underlined in the tables. Similarly, the differences between lower and upper limits of credible intervals have been underlined.
Table 1. Bayes estimates and risks under uniform prior
 |
| |
|
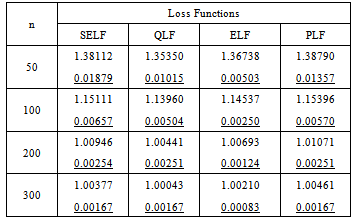
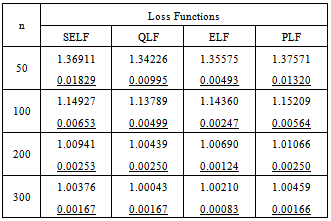
Table 2. Bayes estimates and risks under Jeffreys prior
 |
| |
|
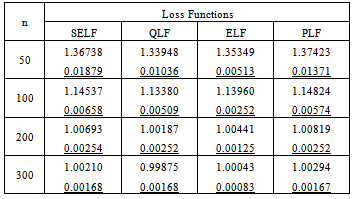
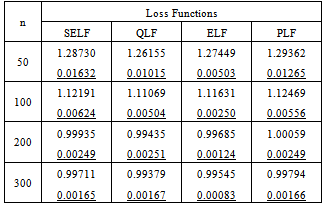
Table 3. Bayes estimates and risks under Maxwell prior
 |
| |
|
Table 4. Bayes estimates and risks under Rayleigh prior
 |
| |
|
Table 5. Bayes estimates and risks under chi prior
 |
| |
|
From the above study it can be seen that by increasing the sample size the estimated value of the parameter converges to the true value of the parameter and magnitude of risk associated with each estimate decreases. The increasing values of the parameter impose a negative impact on rate of convergence under each prior; similarly, the performance of squared error loss function and precautionary loss function is badly affected. However, the performance of quadratic loss function and entropy loss function is independent of choice of parametric value. In comparison of non-informative priors the uniform prior gives the better estimates as the corresponding risks are smaller for each loss function. While in case of informative priors the Maxwell prior for QLF and ELF, Chi prior for SELF and Rayleigh prior for PLF provide the best results. Similarly, estimates under entropy loss function give the minimum risks among all loss functions for each prior. It can also be assessed that the performance of estimates under informative priors is better than those under non-informative priors. Some prior elicitation technique may further strengthen this argument. Hence, the use of Maxwell prior under entropy loss function can be preferred to estimate the parameter of the error function distribution using a Bayesian framework.Table 6. Bayes estimates and risks under normal prior
 |
| |
|
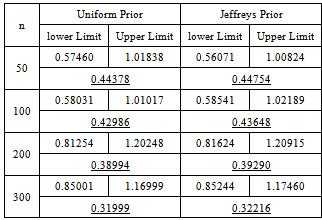
Table 7. 95% credible intervals under uniform and Jeffreys priors
 |
| |
|
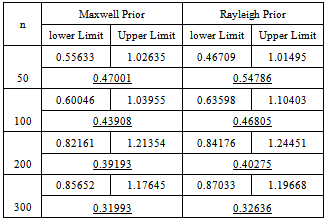
Table 8. 95% credible intervals under Maxwell and Rayleigh priors
 |
| |
|
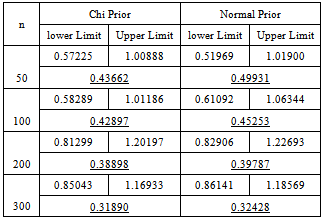
Table 9. 95% credible intervals under chi and normal priors
 |
| |
|
In case of interval estimation, the credible intervals under uniform prior are again narrower than those under Jeffreys prior. Using informative priors, the intervals under chi prior are having the minimum width. So for Bayesian interval estimation of the parameter of error function distribution, the use of chi prior can be preferred.
11. Conclusions and Recommendations
The study has been conducted to estimate the parameter of the error function distribution using four different loss functions and under six informative and non-informative priors. The study indicates that for Bayesian point estimation, the use of entropy loss function under Maxwell prior can be preferred. While for interval estimation, the chi prior can affectively be employed. The study can be extended by using more priors and loss functions. Some censoring procedures and finite mixture of components of error function distribution can also be used.
References
| [1] | L. E Eberly, G. Casella, “Estimating Bayesian credible intervals”, Journal of Statistical Planning and Inference, vol.112, pp.115-132, 2003. |
| [2] | R. I. Korsgaard, S. M. Lunda, D. Sorensen, et al., “Multivariate Bayesian analysis of Gaussian, right censored Gaussian, ordered categorical and binary traits using Gibbs sampling”, Genet. Sel. Evol., vol.35, pp. 159-183, 2003. |
| [3] | H. Wang, “Bayesian analysis of Gaussian graphical models for correlated sample”, Preprint submitted to Elsevier, 2011. |
| [4] | L. Liang, “On simulation methods for two component normal mixture models under Bayesian approach”, Uppsala Universitet, Project Report, 2009. |
| [5] | L. Wang, “A note on the choice between two loss functions in Bayesian analysis”, Soochow Journal of Mathematics, vol.31, no.3, pp. 30-307, 2005. |
| [6] | M. A. Khan, H. M. Islam, “Bayesian analysis of system availability with half-normal life time”, Quality Technology & Quantitative Management, vol.9, no.2, pp. 203-209, 2012. |
| [7] | M. Saleem, A. Raza, “On Bayesian analysis of the exponential survival time assuming the exponential censor time”, Pakistan Journal of Science, vol.63, no.1, pp. 44-48, 2011. |
 Abstract
 Reference
 Full-Text PDF
 Full-Text HTML