-
Paper Information
- Previous Paper
- Paper Submission
-
Journal Information
- About This Journal
- Editorial Board
- Current Issue
- Archive
- Author Guidelines
- Contact Us
International Journal of Psychology and Behavioral Sciences
p-ISSN: 2163-1948 e-ISSN: 2163-1956
2022; 12(1): 10-17
doi:10.5923/j.ijpbs.20221201.03
Received: Apr. 30, 2022; Accepted: May 18, 2022; Published: May 24, 2022

A Study on Individual Differences in Sensory Sensitivity: ABO Blood Type and Personality in Japan
 Abstract
 Reference
 Full-Text PDF
 Full-text HTML
Masayuki Kanazawa
Human Sciences ABO Center, Tokyo, Japan
Correspondence to: Masayuki Kanazawa, Human Sciences ABO Center, Tokyo, Japan.
| Email: |  |
Copyright © 2022 The Author(s). Published by Scientific & Academic Publishing.
This work is licensed under the Creative Commons Attribution International License (CC BY).
http://creativecommons.org/licenses/by/4.0/

It is estimated that genetic factors account for roughly 50% of an individual’s personality. However, statistical analysis has so far failed to show a substantial and consistent relationship between personality tests and genes. Meanwhile, about half or more of Japanese, Korean, and Taiwanese people feel that the relationship between genetically determined ABO blood type and personality is legitimate. In this pilot study, data from a medium-scale survey (N = 1,937) were analyzed using a combination of traditional and alternative statistical methods to examine the relationship. The results showed a clear relationship between ABO blood type and self-reported personality traits on several single question items, consistent with the predicted ones. The same traits were also observed in the “no knowledge” group, although the differences were smaller. People in this group might have less interest in and sensitivity to personality. The impact of the interest level on personality was also discussed.
Keywords: Individual differences, Sensory sensitivity, Blood type, Personality, Big five
Cite this paper: Masayuki Kanazawa, A Study on Individual Differences in Sensory Sensitivity: ABO Blood Type and Personality in Japan, International Journal of Psychology and Behavioral Sciences, Vol. 12 No. 1, 2022, pp. 10-17. doi: 10.5923/j.ijpbs.20221201.03.
Article Outline
1. Introduction
1.1. Background
- The question of “nature or nurture” has long been an important topic of debate among scientists. According to the results of many studies conducted so far, each is now considered to account for about half of an individual’s personality [1-2]. However, the specific effects of individual genes are still unclear, and there is still no scientific consensus.For personality, a meta-analysis of studies involving over 260,000 participants was published in 2017 [3]. This study statistically re-analyzed the relationship between the “Big Five” personality test and genes, and found that six genes affected personality. However, the maximum magnitude R2, or the coefficient of determination, was very small at under 0.04%. This value is usually considered to be an error.Nevertheless, among the many human genes, ABO blood type is one of the exceptions. It was discovered by the Austrian pathologist Landsteiner in 1901. Because the genes can be identified by a simple test, hundreds of studies have been conducted to date, and several 10,000-population or over large-scale surveys reported statistical differences, mainly in Japan [4-7]. One reason is that these studies usually used single-item scales such as simple traits. Another reason is that many Japanese people know their ABO blood type, due to blood testing at birth and blood donation, among other reasons. Meanwhile, as mentioned earlier, many studies that have examined the relationship between blood type and personality using the Big Five test [8-10], the most common test in contemporary psychology, have yielded very few consistent results [11-18].
1.2. Blood Type Personality Theory
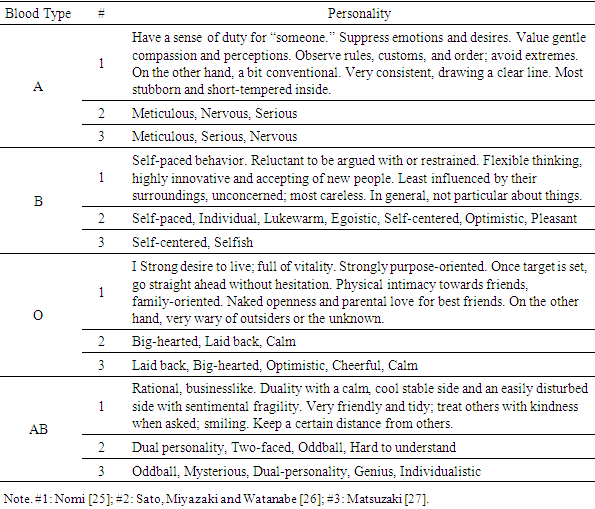
- Presently, the relationship between blood type and personality has been studied at a global scale, and Furukawa, a Japanese educational psychologist, conducted the first academic examination using statistics as a base in 1927 [18-23]. However, Nomi, an independent Japanese researcher, created the paradigm that has most influenced current research [22-25]. Questionnaires by psychologists reported the following personality traits associated with each blood type. Sato, Miyazaki and Watanabe [26] conducted a survey of 197 undergraduate students and the results of free responses. Matsuzaki [27] extracted personality traits of each blood type from multiple books and asked 140 undergraduate students whether they were applicable. In general, these results were consistent with Nomi’s studies. The results are shown in Table 1.
|
1.3. Results of Academic Studies
- As mentioned above, half or more of Japanese, Koreans, and Taiwanese people believe that the relationship between blood type and personality is legitimate [4,12,18,28]. In such cases, self-report question items should show the same differences in responses as blood type traits due to the “self-fulfillment phenomenon” or the “contamination by knowledge” [29-30]. Moreover, no difference has been found for respondents without knowledge of blood types’ influence on personality traits, with only one exception [4]. Therefore, the current consensus is that these differences are caused by the self-fulfillment phenomenon or the contamination by knowledge. Although this has not been completely validated because there are few follow-up examinations.On the contrary, research using the Big Five personality tests has shown no consistent differences in Japan, Korea, or Taiwan. The same is true for the rest of the world. This also has been taken as evidence that the relationship is superficial. For example, in a 2005 Korean study, there was no difference in the Big Five personality test of 200 participants [12]. Interestingly, there appeared to be statistically significant differences in some individual items on this Big Five personality test, which were similar to blood type traits [31].
1.4. Contemporary Trends and Issues
- Theoretically, in self-report questionnaires such as the Big Five, answers should show the same differences as blood type traits because of the “self-fulfillment phenomenon” or the “contamination of knowledge.” In other words, according to the findings of conventional theories of personality measurement, the results of personality tests based on self-report items should always show the same differences. Accordingly, the aforementioned 2005 Korean study, there were differences in the items considered to be blood type traits [12,31], although there was no difference in the personality factors of the Big Five personality test. Meanwhile, since these blood type traits are not exactly the same as shown in table 1, careful consideration is required to draw a conclusion.Therefore, in this study, we examined those items more accurately. Personality traits of blood type are often expressed as adjectives, as shown in Table 1. There are many variants of the Big Five personality tests, and some of the question items are expressed as adjectives. We checked several Japanese versions, and found that some of the question items were exactly the same as ones of Table 1. Two Big Five personality tests using these adjectives disclose the question items [32-33]. Therefore, we analyzed the results obtained for each individual item, not only the five personality factors unlike the previous surveys.Additionally, there is an issue of “personality sensitivity.” No difference among the respondents with no knowledge may not really mean that there was no difference; there remains a possibility that their “personality sensitivity” was considerably lower so that the differences could not be detected by their self-reports. However, little research has been done on this kind of sensitivity. For example, in the Big Five personality tests, if two persons have the same scores, they are considered to have the same personalities, but little research has been done regarding this phenomenon [34-35]. On the contrary, other senses, such as taste, there would certainly exist individual differences, and the measurement methods have been standardized worldwide by ISO.
2. Participants
- The data used in this study were collected by means of crowdsourcing. The survey was conducted in 2021 with a sample size of 2,000 Japanese individuals between the ages of 20 and 59. The participants were asked to rate a total of 29 Big Five personality question items [34], plus “interest in human personality,” each with scores from 1 to 5 for their own personality traits (the larger the number, the more fitting the trait). Additionally, respondents were also asked 2 questions; scores of 1 to 4 denoting the strength of the relationship between blood type and personality (the larger the number, the closer the relationship) and 1 to 4 of their own familiarity with blood type personality theory (the larger the number, the more knowledgeable the participant was).Since this study is not medical research involving human subjects, the Research Ethics Review Committee determined that there were no ethical issues when using only information that was already unlinkable and anonymized. All question items were checked at the previously stated crowdsourcing company which has passed the Japanese privacy review process (JIS Q 15001). The company confirmed that there was no problem with these items. It provides customers with anonymized data and obtains informed consent from participants (respondents) prior to its surveys. Each participant’s blood type of was determined by self-report, because most Japanese people know their blood type; until recently, in Japan, it had been a common practice to test the blood type of newborns. In this survey, 63 out of all the 2,000 respondents, or 3.2% of the total, did not know their blood type. Thereby the data of the remaining 1,937 participants with known blood types were used. All samples were equally allocated by age in 10-year increments, and gender.
3. Hypotheses and Methods
3.1. Hypotheses
- We organized the issues mentioned above and formulated the following hypotheses on the relationship between ABO blood type and personality: Hypothesis 1:In the Big Five personality test, there are few differences in personality factors.Hypothesis 2:Individual question items on the Big Five personality test which are exactly same as the blood type traits will yield differences as indicated.Hypothesis 3:For the individual question items that match the blood type traits, the differences will be found only for the respondents who are familiar with blood type personality theory.Hypothesis 4:Respondents who are interested in personality will score higher because they have higher personality sensitivity.
3.2. Big Five Personality Test Used
- Several adjective-based Big Five scales have been developed so far. In Japan, the 60-item, 7-point BFS, which was developed by Wada [33] is the most commonly used. Later, a simplified version of this test with 29 items and a 5-point scale was developed [32]. Both tests were sufficiently reliable, with Cronbach's alphas of 0.75 to 0.87 for the usual Big Five personality test, the NEO-FFI [36]. For this reason, we chose the latter, which is more convenient to survey.Of these 29 question items, the following two were completely consistent with the blood type traits in Table 1.Self-centered (Trait of blood type B)Meticulous (Trait of blood type A)
3.3. Methods
- For Hypothesis 1, an ANOVA for blood type and the Big Five personality factors was conducted.For Hypothesis 2, an ANOVA for blood type and the individual question items of the Big Five personality test was conducted. Two items were completely consistent with the blood type traits in Table 1.For Hypothesis 3, a cross-tabulation was conducted on the familiarity in the blood type personality theory, or the extent of their knowledge. For Hypothesis 4, An ANOVA was conducted on personality sensitivity with the 29 question items. These question items were divided into non-reverse (positive) and reverse (negative) item groups, which would differ in properties.We adopted 0.05 as the level to infer significance. The distributions of participants’ blood types were almost equal to the Japanese average [37]. Jamovi 1.2.27.0 (jamovi Project) was used for statistical analysis. The effect sizes [38] were also calculated.
4. Results
4.1. Hypothesis 1: ANOVA for the Big Five Personality Factors and Blood Type
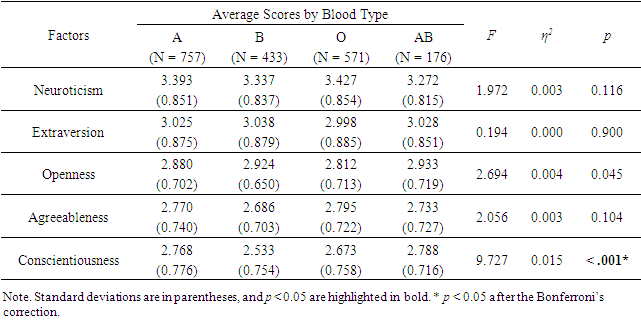
- Only one factor was statistically significant at p < 0.05, and after the Bonferroni’s correction. The magnitude of η2 was at most 0.015, and the effect size was small (Table 2).
|
4.2. Hypothesis 2: ANOVA for Blood Type and Each Individual Question Item
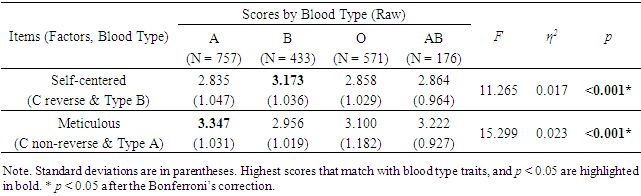
- Both of the items which are consistent with the blood type traits in Table 1 were statistically significant at p < 0.05, and after the Bonferroni’s correction. The magnitude of η2 was at most 0.023, and the effect size was small (Table 3).
|
|
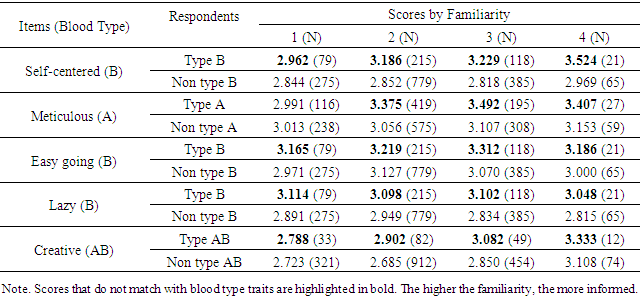
4.3. Hypothesis 3: Cross-tabulation of Blood Type and Each Individual Question Item by Familiarity
- As for the knowledge about the blood personality theory, we conducted a cross-tabulation of the blood type and each individual item according to the extent of familiarity (extent of knowledge) with the theory. Respondents were asked to select either 1: “I don't know at all,” 2: “I know a little,” 3: “I know some,” or 4: “I know a lot.” The items calculated were all five of the items that were statistically significant in the result of Hypothesis 2, and the cross-tabulation grouping was between the blood types that fit those traits and the other blood types.The results showed that in all but one case, regardless of familiarity, the scores of the blood types that fit the traits were higher than that of the other blood types (Table 5). Thus, Hypothesis 3 was not verified.
|
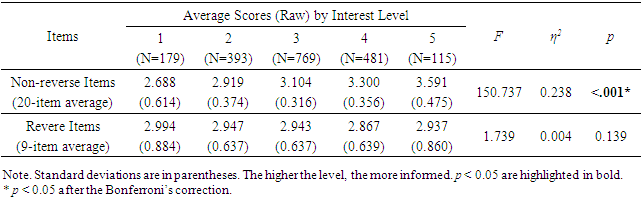
4.4. Hypothesis 4: ANOVA for Non-reverse Items and Reverse Items
- Table 6 and Chart 1 show the result of an ANOVA for non-reverse items and reverse items. The increase in non-reverse (positive) items with interest in a person's personality was significant at p < 0.001, while it was not significant for reverse (negative) items. The number of statistically “insignificant” items in personality sensitivity was 4 out of 20 for the non-reverse items, and 7 out of 9 for the reverse items.
|
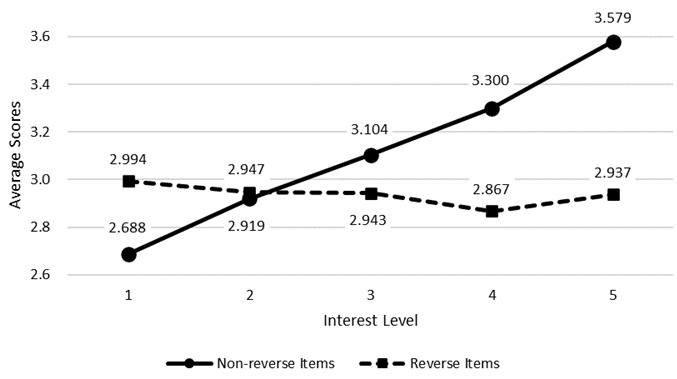 | Chart 1. ANOVA for Non-reverse Items and Reverse Items |
5. Discussion
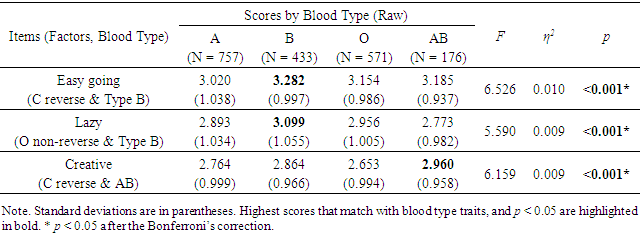
- As mentioned earlier, Korean studies [12,31] showed that there was no difference in the personality factors of the Big Five personality test, while there was a difference in the items considered to be blood type traits. Our study confirmed this phenomenon.Of the 29 items in our study [32], five individual items (Conscientiousness: four items; Openness: one item) showed differences that matched blood type traits. Of the six items related to Openness, only one item showed a significant difference, so the difference of this factor was not significant. On the other hand, of the seven items related to Conscientiousness, four items showed significant differences; therefore, the difference in this factor was significant. Thus, the number of statistically significant differences on personality factors was found to be reduced in the Big Five personality test compared to the raw data (Tables 2, 3 & 4).These five items that showed blood type differences were analyzed by familiarity (extent of knowledge) with the blood type personality theory. The results showed these differences in 31 out of 32 cases, thereby almost all the scores were consistent with the blood type traits. This suggests that blood type traits are not affected by the knowledge of or familiarity with blood type personality traits. In other words, these results disprove the idea of “self-fulfillment phenomenon” and the “contamination by knowledge,” and that differences in traits can appear even without blood type personality knowledge.In addition, according to the result of the non-reverse items, respondents who are interested in personality will score higher since they have higher personality sensitivity. However, this was not displayed in the non-reverse items.To summarize the results of this study:Blood type makes a difference in only a few specific items of personality tests.Therefore, there appears no or little statistical difference in terms of personality factors.Personality sensitivity is clearly present in the non-reversed items, but it is unclear in the reversed items.Commonly used personality tests usually combine non-reverse and reverse items to constitute personality factors. In this case, little or no difference is observed in people with low personality sensitivity, but this does not mean that there is no difference at all. The large effect size (η2 = 0.238 of 20 “non-reverse” items) for “personality sensitivity” of this study suggests that personality tests mainly measure how interested a respondent is in human personality, rather than personality itself. Moreover, it is also known that scores on the Big Five personality tests are considerably influenced by gender and age [39-41]. Previous studies on ABO blood type and personality have rarely taken into account the effects of gender and age. If the number of items affected by blood type is relatively small, as in the previous study, the effects of gender and age differences may exceed the effects of blood type, which may lead to inconsistencies in the results of the previous study [11-18,43-50]. Follow-up surveys on these issues are needed in the future.
6. Conclusions
- We observed a clear relationship between blood type and the self-reported personality traits in several single question items, which matches traits that were previously mentioned. The same traits were observed in a “no knowledge” group, although the differences were smaller. People in this group might be less interested in or sensitive to personality. Traditional personality tests, such as the Big Five test, typically use a personality factor that consists of multiple items. In this case, the effect of blood type appears on very specific items, which could have produced inconsistent results in previous studies. The explanation above is in close alignment with the theory of personality psychology. Our findings provide a new, if hypothetical, framework of how genes affect human personality.Meanwhile, the sample in this study was limited to Japanese populations, and the interaction of gender and age are still unclear. Additional research using a larger, more global dataset is needed in order to address the true implications as well as to improve methodologies.
ACKNOWLEDGEMENTS
- The author is grateful to Chieko Ichikawa, President of the Human Sciences ABO Center, for her support. The author also thanks CEO Qinglai Meng of the Human Sciences ABO Center, USA and Fred Wong, co-founder of AI Hong Kong Limited, for their comments and suggestions.