-
Paper Information
- Paper Submission
-
Journal Information
- About This Journal
- Editorial Board
- Current Issue
- Archive
- Author Guidelines
- Contact Us
International Journal of Psychology and Behavioral Sciences
p-ISSN: 2163-1948 e-ISSN: 2163-1956
2021; 11(4): 53-64
doi:10.5923/j.ijpbs.20211104.01
Received: Nov. 5, 2021; Accepted: Nov. 20, 2021; Published: Dec. 15, 2021

Measurement Invariance of R-UCLA Loneliness Scale Across Gender Using Differential Item Functioning (DIF)
 Abstract
 Reference
 Full-Text PDF
 Full-text HTML
Mahnaz Shojaee1, Mehrdad Shahidi2, 3, Ying Cui1, Amin Mousavi4
1Centre for Research in Applied Measurement and Evaluation, University of Alberta, Canada
2Department of Education, Mount Saint Vincent University, Canada
3Department of Psychology, Tehran Central Branch, Islamic Azad University, Tehran, Iran
4Department of Educational Psychology and Special Education, College of Education, University of Saskatchewan, Canada
Correspondence to: Mahnaz Shojaee, Centre for Research in Applied Measurement and Evaluation, University of Alberta, Canada.
| Email: |  |
Copyright © 2021 The Author(s). Published by Scientific & Academic Publishing.
This work is licensed under the Creative Commons Attribution International License (CC BY).
http://creativecommons.org/licenses/by/4.0/

Background: Using R-UCLA-Loneliness Scale, previous studies across Canada and other Western and Asian countries indicated that loneliness could predict some of the mental health disorders such as clinical depression, anxiety, as well as physical problems. Thus, the self-report R-UCLA-Loneliness Scale has been used increasingly to screen and monitor the sense of loneliness in people with and without mental health disorders. A brief review of previous research on the R-UCLA-Loneliness Scale revealed the lack of evaluation of the scale's fairness/equivalence in measuring loneliness among adolescents and young adults. Method: Four hundred university students aged between 18 and 26 years old participated in this study. Their responses were analyzed using item response theory (IRT) and ordinal logistic regression (OLR). To determine the type of Differential Item Functioning (DIF), uniform or non-uniform, we examined "item true score function plots". Results: The findings revealed that three items display gender-related DIF. All three items showed non-uniform DIF. The assessment of effect sizes indicated negligible differences for practical utilization. Limitations: A caution should be considered in interpreting the results of measurement invariance across Gender. The samples analyzed in this study were individuals without comorbid symptoms or other mental disorders. Thus, we recommend future researchers focus on the clinical population. Conclusion: This study was the first and major step towards presenting theoretical and practical information regarding the assessment of invariance of the R-UCLA-Loneliness Scale across gender. Future studies may look at different aspects and sources of invariance such as marital status and educational levels for different groups to strengthen conclusions concerning the R-UCLA Loneliness Scale.
Keywords: Loneliness, Differential Item Functioning (DIF), Item Response Theory (IRT), Measurement Invariance, R-UCLA Loneliness Scale, Gender
Cite this paper: Mahnaz Shojaee, Mehrdad Shahidi, Ying Cui, Amin Mousavi, Measurement Invariance of R-UCLA Loneliness Scale Across Gender Using Differential Item Functioning (DIF), International Journal of Psychology and Behavioral Sciences, Vol. 11 No. 4, 2021, pp. 53-64. doi: 10.5923/j.ijpbs.20211104.01.
Article Outline
1. Introduction
- Loneliness is one of the most prevalent psychological problems across Canada (Kaiser Family Foundation, 2020; Keefe, Andrew, Fancey, & Hall, 2006) and around the world (Groarke, Berry, Graham-Wisener, McKenna-Plumley, McGlinchey, & Armour, 2020; Igbokwe, Ejeh, Agbaje, Umoke, Iweama, & Ozoemena, 2020; McGinty, Presskreischer, Han, & Barry, 2020). As a unitary and global phenomenon, loneliness is characterized by the lack of emotional bonds with others, lack of caring people, a sense of being socially isolated, a sense of being silly, empty, upset, not right, disappointed, confused, sad, and bored (Layden, Cacioppo, & Cacioppo, 2018; Masi, Chen, Hawkley, & Cacioppo, 2011; McWhirter, 1990; Russell, McRae, & Gomez, 2012). These symptoms can directly affect individuals’ psycho-social functions (Cacioppo & Hawkley, 2009; Layden, Cacioppo, & Cacioppo, 2018). Having close association with social isolation, loneliness in a unidimensional model is considered as a subjective perception of social isolation (Ercole & Parr, 2020). However, social isolation indicates an objective measure of individual’s social bonds or social relationships (Ercole & Parr, 2020; Russell et al., 2012; Smith, & Victor, 2019). Thus, in some situations in which individuals’ interactions are limited seriously such as compulsory social distance during the coronavirus 2019 (COVID-19) pandemic, the loneliness increasingly influences individual’s functions in a negative way (Cauberghe, Wesenbeeck, De Jans, Hudders, & Ponnet, 2020; Holmes et al., 2020). In such situations, individuals may show a sense of loneliness along with the symptoms of affective disorders such as the feelings of sadness, loss of interest, emptiness, depressed, hopeless, or confused (Cauberghe et al., 2020; Groarke et al., 2020).Several findings indicated that loneliness could predict other mental health disorders such as clinical depression (Buchholz & Catton, 1999; Jaremka, Fagundes, Glaser, Bennett, Malarkey, & Kiecolt-Glaser, 2013; Wakefield, Bowe, Kellezi, Butcher, & Groeger, 2020; Wiseman, Mayseless, & Sharabany, 2006) and anxiety (Igbokwe et al., 2020). As well, it can affect physical functions negatively and cause problems such as asthma, heart disease, cancer, diabetes, and shortness of breath (Ercole et al., 2020; Groarke et al, 2020).Accordingly, clinical practitioners, psychiatrists, and psychotherapists endeavor to screen and recognize loneliness as early as possible by using reliable and valid tools for further therapeutic intervention. A recent review of most frequently used loneliness measures by Suri and Garg (2020) revealed that among different unidimensional scales, R-UCLA Loneliness Scale (3rd version), originally constructed and developed by Russell, Peplau, and Ferguson (1978; Russell, Peplau, & Cutrona, 1980), is one of the most appropriate scales with several vital characteristics for measuring loneliness such as: 1) easy administration, 2) sufficient number of questions, 3) self-report rather than clinician administered, 4) globally used with acceptable internal reliability and validity, and 5) ability to measure change overtime (Groarke et al., 2020; Russell, Peplau, & Cutrona, 1980; Shahidi, 2013; Suri et al., 2020). Since 1978, the time UCLA Loneliness Scale was introduced, numerous studies have been conducted around the world to either examine the psychometric properties of the scale or to study loneliness in relation to other mental health conditions in diverse populations (Groarke, et al., 2020; Igbokwe et al., 2020; Russell et al., 1978; Russell et al., 1980; Russell et al., 1996; Russell et al., 2012; Shahidi, 2013; Suri, et al., 2020). A brief review of previous studies on R-UCLA-Loneliness Scale (3rd Version) revealed the lack of evaluation of R-UCLA-Loneliness Scale’s (3rd Version) fairness/equivalence in measuring the sense of loneliness among identified groups specially males and females. Also, there were differences between females and males in terms of their scores on the loneliness scale (Shahidi, 2013). However, there was not obvious whether such differences (e.g., females were lonelier than males) were the results of item biases in the scale or of the nature of gender diversity. Accordingly, since assessing measurement equivalence is an important part of the process of validating scales to test whether the probability of responding to a specific item exhibits different statistical properties for different identifiable groups after matching the groups on the construct being measured (De Ayala, Kim, Stapleton, & Dayton, 2002; Sharafi, Mousavi, Ayatollahi, & Jafari 2017), the aim of this study was to assess the measurement equivalence of loneliness by means of R-UCLA version three across gender to ensure about its fairness/equivalence.
2. Method
2.1. Participants
- Employing a systematic multistage random sampling method in the Islamic Azad University-Tehran Central Branch in Iran, 400 university students were selected. This sample had a mean age of 21.66 (SD = 2.20) with a minimum of 18 and a maximum of 26 years old. Of these participants, 361 (90%) individuals were single, 36 (9%) were married and 3 (0.8%) were divorced. The gender composition in this sample was 200 (50%) females and 200 (50%) males. About half of the participants were studying in Psychology and the other half in other disciplines.
2.2. Measures
2.2.1. The R-UCLA Loneliness Scale (3rd Version)
- This scale is a twenty-item self-reported instrument, which was constructed and developed by Russell (1978; Russell, Peplau, & Cutrona, 1980) and used globally in diverse populations (Shahidi, 2013; Kwiatkowska, Rogoza, & Kwiatkowska, 2017; Suri et al., 2020). This scale was introduced not only for clinical practice as a sensitive and specific instrument in detecting and monitoring the sense of loneliness during the course of treatment, but also it has been used widely in different psycho-social research areas (Bhagchandani, 2017; Hunley, 2010; Shahidi, 2013; Stickley & Koyanagi, 2016; Yildiz, 2016). The scale was created using friendly language that can be easily and quickly completed. Having different versions with either 11 items, 6 items, or 20 items, the 20-item version of R-UCLA Loneliness Scale was used in this study. Each item implies a possible sense of loneliness in different social and interpersonal contexts caused by lack of companionship, being isolated from others, being withdrawn, or lack of empathy with others. Some examples of items include, “I am unhappy being so withdrawn”, “I feel left out”, “There is no one I can turn to”, and “I lack companionship”. Items on this scale require Likert-style responses ranging from “1= never” to “4= most of the time”. A respondent’s score is obtained by summing his/her scores on all 20 items.The scale has reasonable validity and reliability (Kwiatkowska, et al., 2017; Russell et al., 1980; Suri et al., 2020; Terrell, & Dringus, 2000; Weeks, & Asher, 2012). In one study on loneliness and psychological well-being, Shahidi (2013) examined the internal consistency of the R-UCLA Loneliness Scale (20-items) responded by university students in Canada. The results revealed that the scale has an acceptable internal consistency with Cronbach's Alpha of 0.87. Dogan et al. (2011) also studied the psychometric properties of this scale. Their results demonstrated that the scale has both high internal consistency (0.96) and test-retest reliability (0.94). Likewise, Yildiz’s (2016) examination of the internal consistency of the R- UCLA-LS resulted in high Cronbach alpha (0.92).
2.2.2. Differential Loneliness Scale (DLS) – Student Version
- Originally designing and developing by Schmidt and Sermat in 1983 to assess loneliness in students (young adults), this scale was psychometrically developed and used in many recent studies (Ahmed, 2019; Goossens, Maes, Danneel, Vanhalst, & Nelemans, 2017, Shahidi, 2013; Shahidi, French, Shojaee, & Bellido Zanin, 2019). The scale measures loneliness in four types of relationships, namely romantic/marital (sexual) relationships (R/M), friendships (Fr), relationships with family (Fam), and relationships with larger groups (Gr). DLS has good validity and reliability making it appropriate for research (Schmidt, & Sermat, 1983). The person completing the measure reads each 20 item stems and then indicates whether it is True or False. Blazin, Settle, and Eddins (2008) demonstrated that the scale has acceptable reliability for research. In one study conducted on the same population, Shahidi et al. (2019) demonstrated that DLS had a reasonable internal consistency with Cronbach’s Alpha 0.70.
2.2.3. Ryff’s Psychological Well-Being Scale (PWBS)
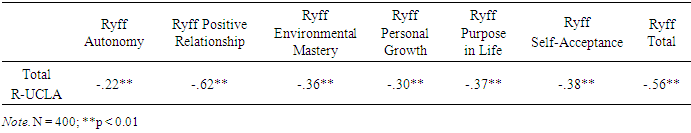
- This scale was used to examine the discriminant validity of R-UCLA Loneliness Scale. The PWB scale measures six components of psychological well-being including self-acceptance, positive relations with others, autonomy, environmental mastery, purpose in life and personal growth (Cheng, & Chan, 2005; McDowell, 2010; Ryff, 1989, 2013, 2017; Van Dierendonck, 2005). From different versions, the 42-item scale was used in this study. The scale had reasonable validity and reliability examined by several researchers in different societies (Van Dierendonck, 2005; Ryff, 1989; Ryff, & Singer, 2008; McDowell, 2010; Shahidi, 2013). In the target population (IAU-TCB), two primary psychometric studies were done on 42-item version of Ryff’s PWB scale demonstrating Cronbach’s Alpha 0.88 (Fattahi, 2016) and 0.87 (Rezaghan, 2018).
2.3. Procedure
- The questionnaires were used in this study were original based on receiving permissions from their owners (authors). The scales were translated into Persian and back translated to English by two experts both were fluently bilingual in English and Persian. After the confirmation of translation accuracy and preparing the materials, the researchers pursued the ethics’ principles of the university. Accordingly, all potential participants were informed, both verbally and in a written covering letter, of their rights. Participation was voluntary. Those who chose to participate could decline to answer any questions or to withdraw from the study at any time freely. After explaining the confidentiality of the research, the recruited samples were asked to complete all questionnaires. Collected data were analyzed by “R” software to detect Differential Item Functioning (DIF) via Ordinal Logistic Regression (OLR). DIF is one of the measurement invariance methods that is used to determine whether a scale (along with its items) in different examinee groups is fair or not (Sadeghi, & Abolfazli Khonbi, 2017). The violation of measurement invariance could result in individuals receiving different scale scores systematically while experiencing the same level of loneliness (Wang, Strobl, Zaileis, & Merkle, 2018). As Holland and Thayer (1988 cited in Bulut & Suh, 2017) defined: “DIF refers to a conditional dependency between group membership of examinees (e.g., male vs. female) and item performance (i.e., the probability of answering the item correctly) after controlling for latent traits. As a result of DIF, a biased item provides either a constant advantage for a particular group (i.e., uniform DIF) or an advantage varying in magnitude and/or in direction across the latent trait continuum (i.e., non-uniform DIF; p 1-2)”.Since different groups exist in each cohort of examinees, ignoring the stability of measurement across groups can make the interpretation of results ambiguous (Wang, et al., 2018). This can increase the DIF of items (Gierl, Gotzmann, Boughton, 2004, Bulut, 2015). Thus, DIF could be a serious threat for instrument validity (Mousavi, Shojaee, Shahidi, Cui & Kutcher, 2019; Mousavi and Krishnan, 2016). Detection of DIF could be done with several methods such as Logistic Regression (LR), which was employed in this study to flag potential problematic items. Since LR does not require a large sample size and also there is no need for the specific forms of item response function, this statistical procedure is considered as a popular DIF detection method (Narayanan & Swaminathan, 1994 cited in Chen & Jin, 2018). As LR can be extended to the polytomous item response data (Sharafi, Mousavi, Ayatollahi & Jafari, 2017; Yesiltas & Paek, 2020), we limited our attention to the observed score-based DIF method utilizing Ordinal Logistic Regression. Ordinal LR was done using RStudio, version 1.2.5001, and lordif package (Choi, Gibbons & Crane, 2011). Detecting DIF with utilizing OLR is based on comparing three different nested models. Zumbo (1999) have modeled the following forms:
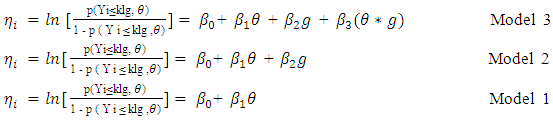 Where p (Yi ≤ k) is the probability of responding at or below category k to an item for the ith person, θ (person’s latent trait levels, ability parameter; Hambleton, Swaminathan, & Rogers, 1991 cited in Kim & Yoon 2011) represents the overall level of loneliness and it is measured by the total test score, g is a grouping variable, and g*θ represents the interaction between the grouping variable and the overall level (Mousavi, et al. 2019). The difference value of -2× log-likelihood between model 1 and 3 can be used to detect two forms of DIF, uniform and non-uniform. This difference value is compared to a Chi-squared distribution with two degrees of freedom and significant result will flagged the item for DIF. To determine type of DIF, we examined “item true score function plots”, which illustrate the item characteristic curve (ICCs; also called item response function for polytomous items (ICF) and represents expected scores conditional on the trait level), to see if the DIF is uniform or non-uniform.
 3. Results
3.1. Discriminant and Convergent Validity
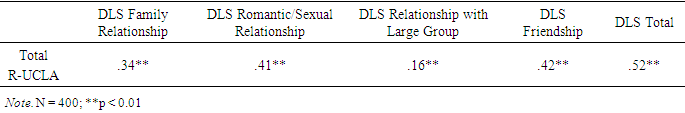
- To examine criterion validity of the R-UCLA Scale, the researchers employed convergent and discriminant validity. Using DLS Scale to examine convergent validity, the results revealed that all four subscales and the DLS total scores have positively significant correlation, with R-UCLA scale (between r = 0.157 and r = 0.521 -Table 1). Thus, we may conclude that these two scales measure the same construct. Similar results were cited by Shahidi (2013, 2019).
|
|
3.2. Reliability Analysis
- To obtain the internal consistency of items of R-UCLA Scale, Cronbach's Alpha coefficient was calculated resulting in a value of 0.83. The Cronbach's Alpha coefficient is an adequate and acceptable based on psychometric assumptions (Beshlideh, 2012). In addition to the Cronbach's Alpha coefficient, the split-half method was used to check the internal consistency of the scale, which was corrected using the Spearmen-Brown coefficient. The results were 0.73 for part one, 0.70 for the second part and, also, correlation of 0.80 between two forms demonstrating reasonable psychometric properties of the scale.
3.3. Differential Item Functioning (DIF)
- We analyzed the dataset (N = 400) on a 20 items of R-UCLA Loneliness scale for DIF related to gender. The reference and focal groups were defined as females (n = 200) and males (n = 200). All items had the same response-style with four response categories (Never, Rarely, Sometimes, & Most of the time). The instrument is constructed in a way that higher scores mean higher level of loneliness. The likelihood ratio was employed as the DIF detection criterion at the α level of 0.01 and McFadden’s pseudo
 was used as the effect size measure for flagged items (reference lordif package). With three iterations, “lordif” package terminated flagging and three items were found displaying gender related DIF: item 3 (How often do you feel that there is no one you can turn to?), item 15 (How often do you feel you can find companionship when you want it?), and item 16 (How often do you feel that there are people who really understand you?). Graphs in Figure 1 indicate the difference in score between using scores that account DIF and those ignore for DIF. In the box plot on the left, interquartile range, representing the middle 50% of the differences (bound between the bottom and top of the shaded box), range roughly from -0.03 to +0.02 with a median of approximately -0.01. In the right graph the same difference scores are represented against the initial scores ignoring DIF (“initial theta”; Choi, et al. 2011), for both genders. Guidelines are plotted at 0.0 (solid line), that is to say no difference, and the mean of the differences (dotted line), however, in this plot these two lines are overlapped. The positive values to the left of this graph revealed that in some cases, accounting for DIF led to slightly higher scores (i.e., naive score ignoring DIF minus score accounting for DIF > 0, so accounting for DIF score is less than the naive score) for those with lower levels of loneliness, notably this appears to happen more for female individuals. The negative values to the right of this graph indicate that for those with higher levels of loneliness, accounting for DIF led to slightly lower scores, special for female individuals.
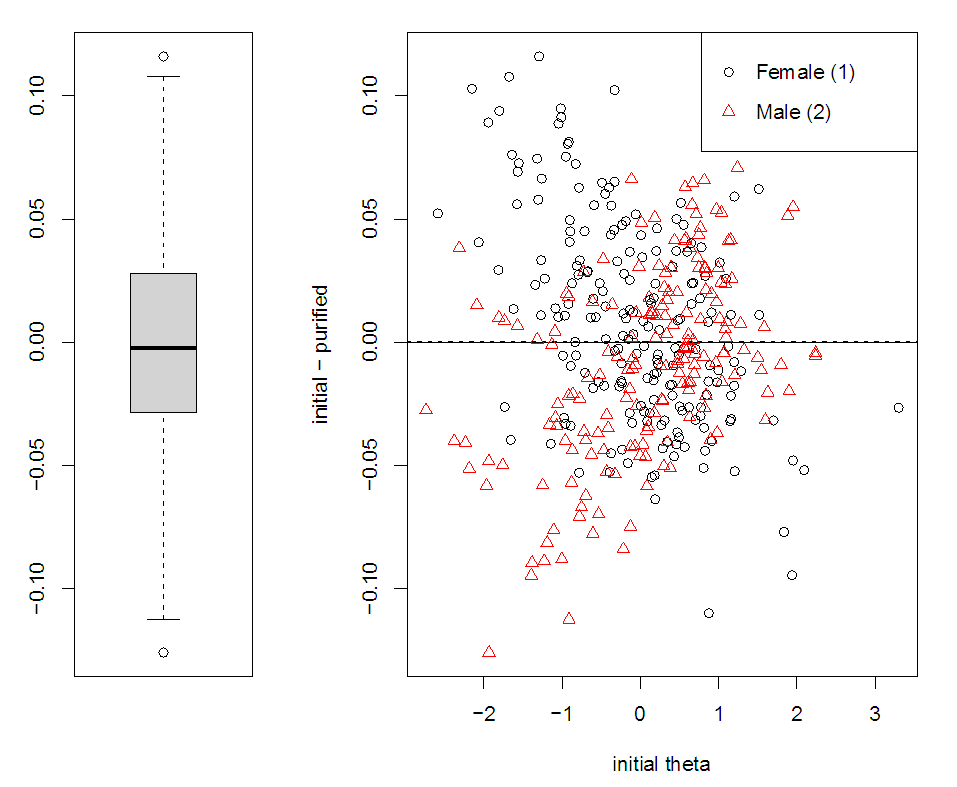 | Figure 1. Individual-Level DIF Impact |
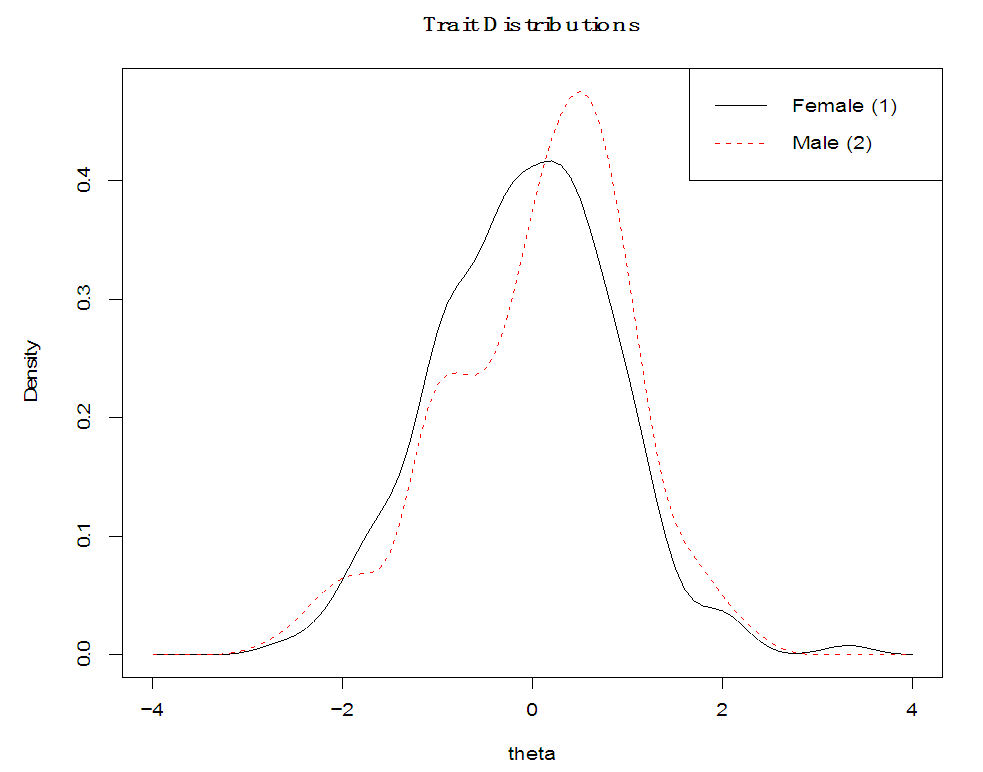 | Figure 2. Trait Distributions – Females vs Males |
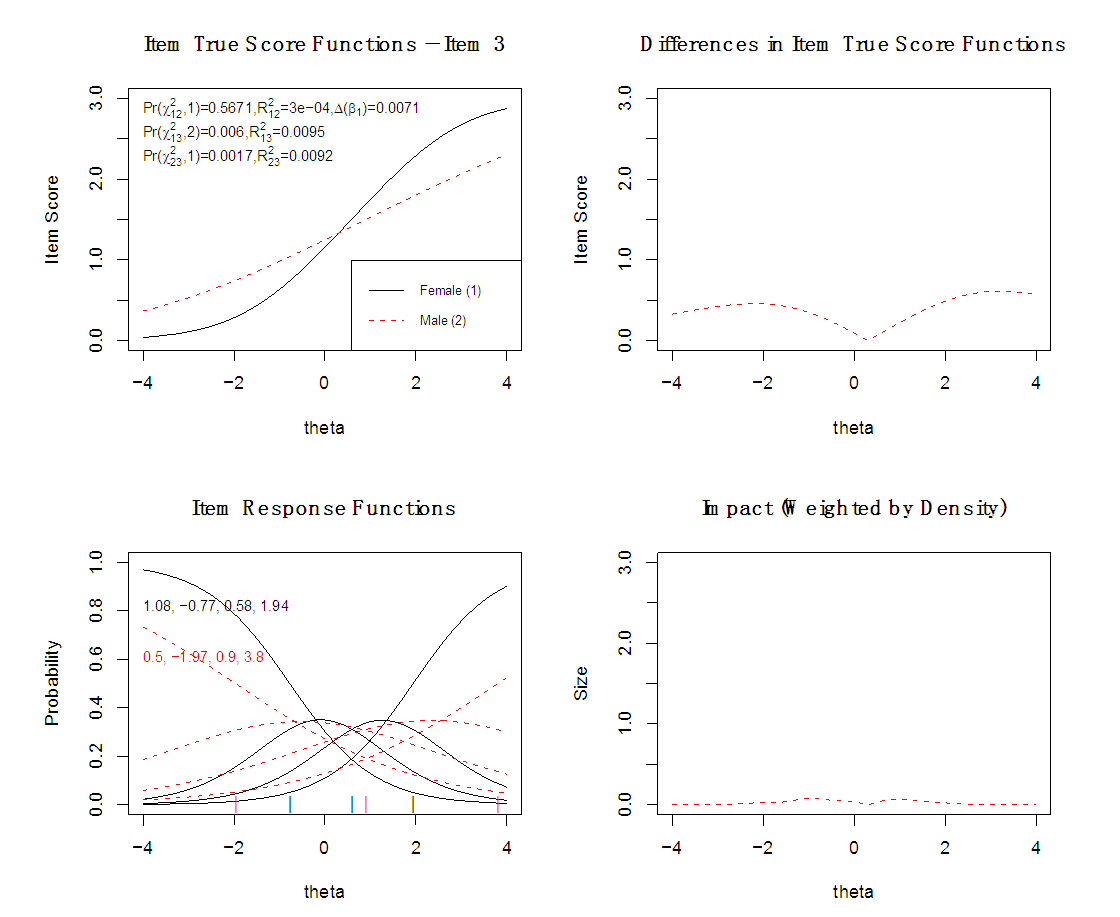 | Figure 3. Visualizing the Non-Uniform DIF for the Item # 3 in Terms of Gender |
 test for uniform DIF was not significant (p = 0.567), while the 1-df test for comparing Model 2 and 3, (p = 0.001) and 2-df test for comparing Model 2 and 3, (p = 0.006) were significant.The top right plot in Figure 3 indicates the expected impact of DIF on scores with the absolute difference between the item true-score functions (Kim, et al., 2007 cited in Choi, et al., 2011). There are differences in the item true-score functions in two spots around θ = 2.00 and θ = 2.90, but the density-weighted impact, displayed in the bottom right plot, is negligible since few cases in this sample have that trait level. When weighted by the focal group trait distribution, the expected impact became negligible, which is also apparent in the small McFadden’s pseudo
  as magnitude measures, printed on the top left plot. The bottom left plot in Figure 3 collocates the item response functions for male and female individuals. The difference of estimated slop parameters (1.08 vs. 0.5), printed in the graph, can also revealed the non-uniform component of DIF. Figure 4 illustrates the plots for item # 15, “How often do you feel you can find companionship when you want it?”, which shows statistically significant a non-uniform DIF. Here the difference between males and females appears to be at both higher and lower levels of loneliness. As the LR
  was non-significant, this result suggests the DIF was primarily non-uniform. The item response functions suggest that non-uniform DIF was due to the first and last category threshold values for the focal group being smaller than that for the reference group (-1.84 vs. -0.76 & 2.95 vs. 1.89).
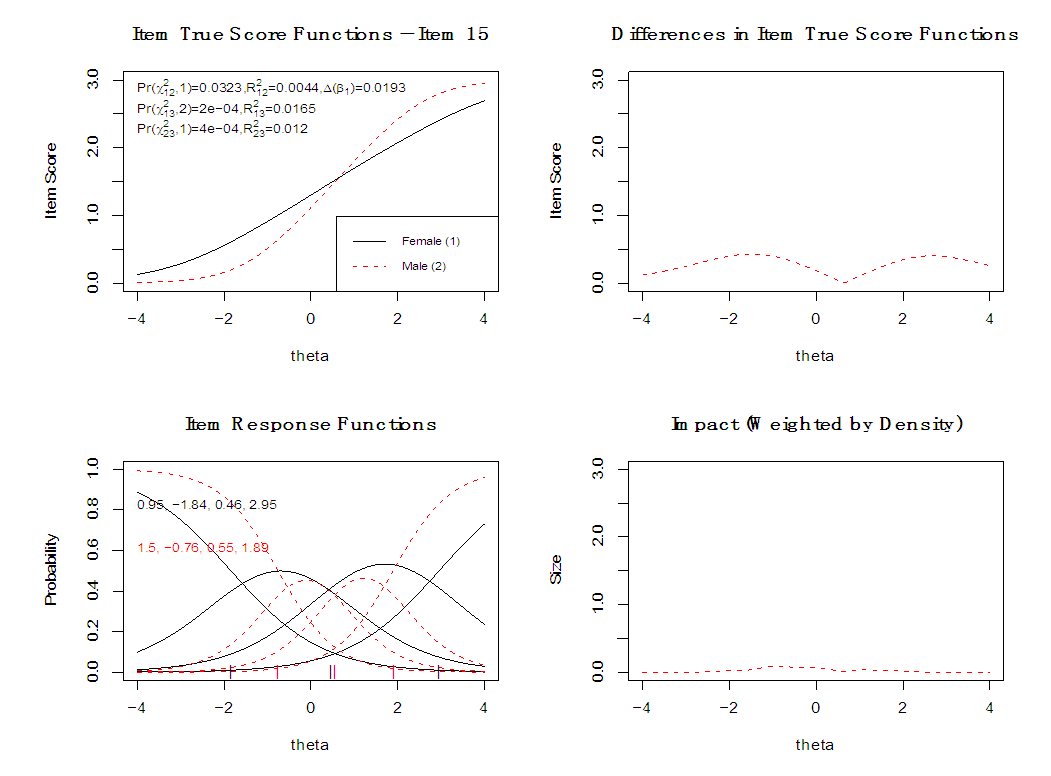 | Figure 4. Visualizing the Non-Uniform DIF for the Item # 15 in Terms of Gender |
 was non-significant. Here the differences between male and female individuals are across almost the entire spectrum of loneliness measured by the test. McFadden’s
  change for non-uniform DIF was 0.011, which is considered a negligible effect size (Penfield, Gattamorta, & Childs, 2009; Cohen, 1996). Unlike the first threshold characteristic curves (printed on the left bottom graph), the item response functions show that due to be non-uniform DIF, the category threshold parameters for focal group of two last thresholds are smaller than the reference group.
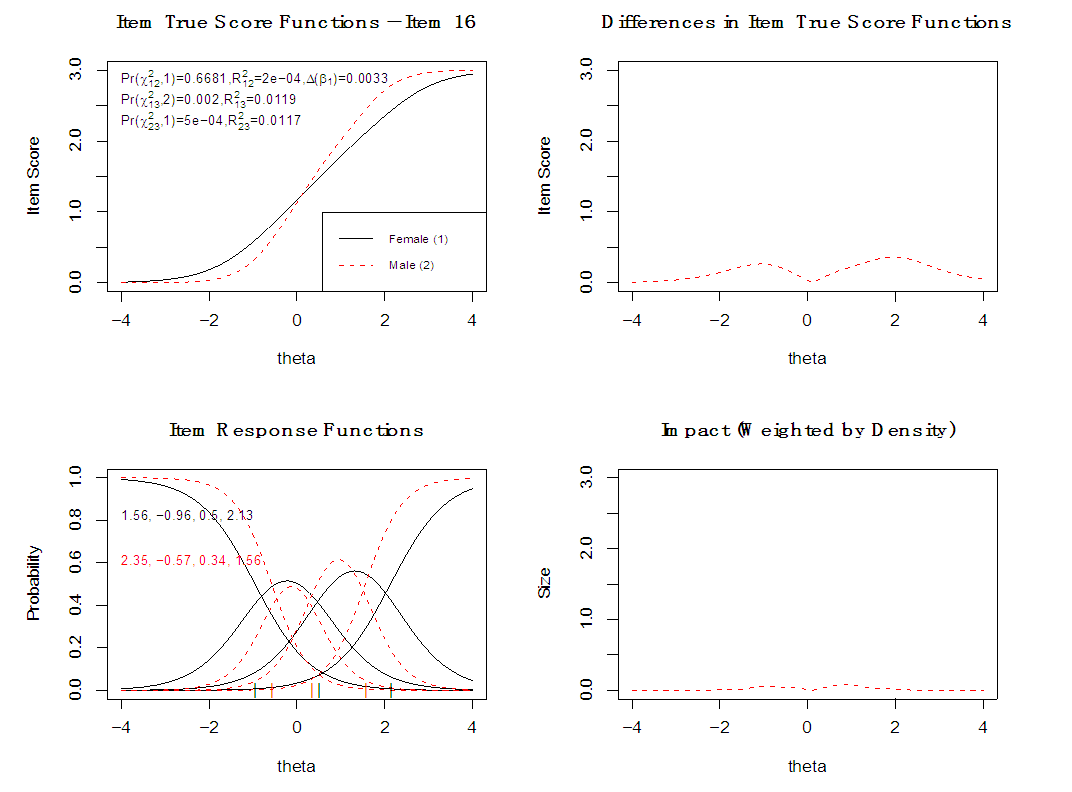 | Figure 5. Visualizing the Non-Uniform DIF for the Item # 16 in Terms of Gender |
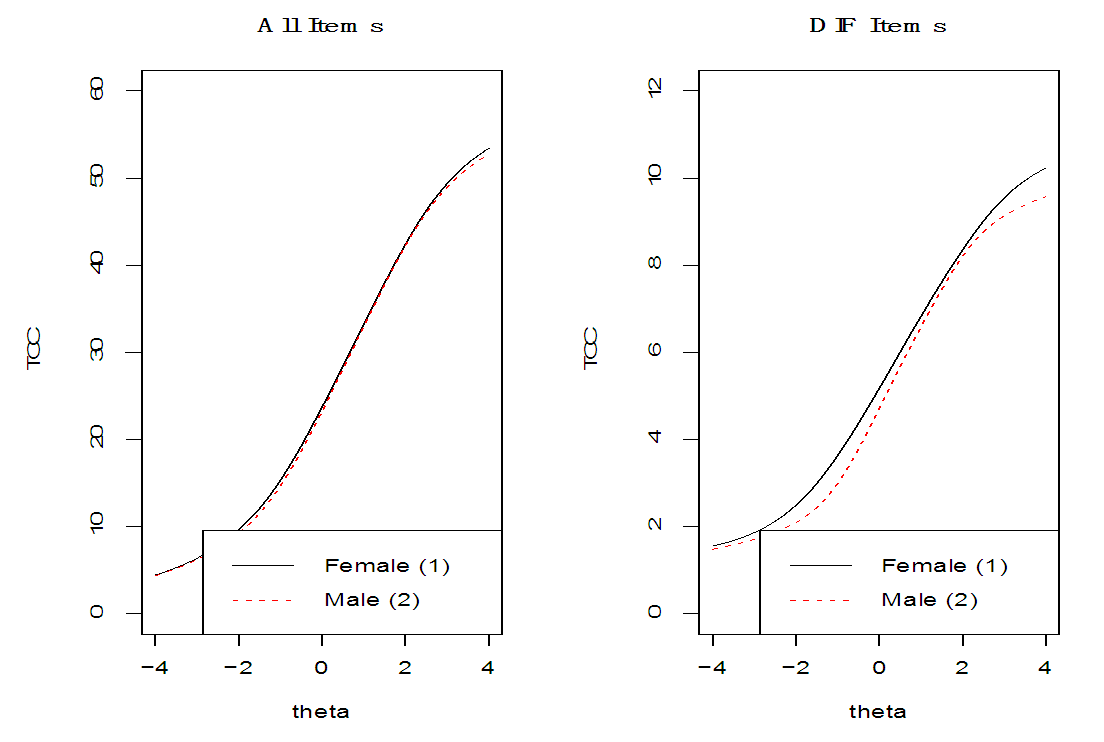 | Figure 6. The Impact of DIF Items on Test Characteristic Curves |
4. Discussion and Conclusions
- The previous literature implies diverse relationships between loneliness and mental health problems and the necessity of using reliable and valid measurement measures (Wiseman, et al., 2006; Wakefield, et al., 2020). Evaluating loneliness as a psychological phenomenon is especially complicated since psychological constructs cannot be entirely quantified using standard and laboratory procedures (Russell & Pang, 2016). Accordingly, this not only implies the requirement of introducing valid and reliable tools, but it is also essential to have evidence-based studies regarding the fairness of measurement as stated by the AERA/APA/NCME Standards for Educational and Psychological Testing (American Educational Research Association, American Psychological Association, & National Council on Measurement in Education, 2014). The current debates on the revised standards for educational and psychological testing revealed that fairness of measurement is a gold standard for any types of psychological scales (Jiménez García, 2017; Jonson, Trantham, & Usher, 2019). In accordance with previous studies (Shahidi et al., 2019; Yildiz, 2016) the current research revealed that R-UCLA Loneliness Scale has reasonably acceptable convergent and discriminant validity and internal consistency in diverse populations. However, to date, there is no study that have focused on the validity of R-UCLA Loneliness Scale with respect to measurement invariance and potential bias in relation to gender. Regarding the R-UCLA Loneliness Scale with Likert type items, this study used Ordinal Logistic Regression in order to assess differential item functioning of R-UCLA Loneliness Scale items and differential test functioning across gender. The psychometric properties of the R-UCLA Loneliness Scale were also examined as a prerequisite for DIF analysis. Also, unidimensionality of the scale (Shahidi, 2013; Suri, et al., 2020), showed the appropriateness to analyze DIF.Scrutinizing the measurement invariance of R-UCLA Loneliness Scale revealed that three items (3, 15, and 16) showed gender-related DIF; that is, responses to these items were dependent on respondent’s gender. Although these items are not fair based on gender, the examination of effect sizes suggested that observed DIF is practically negligible. Thus, we can conclude that the R-UCLA Loneliness Scale has validity evidence related to measurement invariance across gender therefore suitable for using in both male and female populations. However, we should be cautious when interpreting the results of DIF across gender. In the current research there were some limitations for consideration. The first one is related to the nature of samples who were not recognized having loneliness or other psychological problems. Thus, we recommend future researchers to focus on clinical population with balanced number of male and female samples. Although the sample size was enough for doing the analysis, we recommend increasing sample size to minimize the type-I error rate and maximize the chance of generalizability. Also, we recommend considering other influential factors for analyzing the fairness and validity including doing research on marital status, citizenship (rural and urban citizens), level of education and different disciplines. In conclusion, the current study was a significant step towards providing theoretical and practical information regarding the assessment of loneliness among young adults showing satisfactory evidence for R-UCLA Loneliness Scale fairness across gender.
Declaration of Conflicting Interest
- 'Declarations of interest: none'.
Funding
- The author(s) received no financial support for the research, authorship, and/or publication of this article.