-
Paper Information
- Next Paper
- Paper Submission
-
Journal Information
- About This Journal
- Editorial Board
- Current Issue
- Archive
- Author Guidelines
- Contact Us
International Journal of Psychology and Behavioral Sciences
p-ISSN: 2163-1948 e-ISSN: 2163-1956
2019; 9(4): 63-70
doi:10.5923/j.ijpbs.20190904.02

Multinomial Logit Analysis of Injury Severity in Crashes Involving Emotional Drivers
 Abstract
 Reference
 Full-Text PDF
 Full-text HTML
Kristen Hubbert, Mehrnaz Doustmohammadi
Department of Civil and Environmental Engineering, University of Alabama in Huntsville, Huntsville, AL, United States
Correspondence to: Mehrnaz Doustmohammadi, Department of Civil and Environmental Engineering, University of Alabama in Huntsville, Huntsville, AL, United States.
| Email: |  |
Copyright © 2019 The Author(s). Published by Scientific & Academic Publishing.
This work is licensed under the Creative Commons Attribution International License (CC BY).
http://creativecommons.org/licenses/by/4.0/

Crashes involving emotional or aggressive driving pose a large problem in the United States today. This study attempts to identify significant factors influencing crash severity in crashes involving emotional drivers and their effects on the levels of severity. 3 levels of severity are considered in the study: fatal/incapacitating injuries, possible/minor injuries, and property damage only. A multinomial logit model was applied to the data with crash severity as the response variable to an initial 17 independent variables, including driver, vehicle, traffic, roadway, geometric, and environmental characteristics. Results of the model were compared against similar model results for normal driving crashes. Rural/urban, primary contributing circumstance, manner of crash, vehicle maneuvers, and speed limit were all shown to be significant factors in the severity of emotional driving crashes. Results of the study found that emotional and normal driving crashes experience similar trends in crash severity risks.
Keywords: Injury Severity, Safety, Emotional Driving, Multinomial Logit Regression
Cite this paper: Kristen Hubbert, Mehrnaz Doustmohammadi, Multinomial Logit Analysis of Injury Severity in Crashes Involving Emotional Drivers, International Journal of Psychology and Behavioral Sciences, Vol. 9 No. 4, 2019, pp. 63-70. doi: 10.5923/j.ijpbs.20190904.02.
Article Outline
1. Introduction
- In everyday life, people often encounter situations that alter their mental state and mood, often sending their emotions into a frenzy. Driving is an activity that requires attention to detail and a preparedness to react to any number of situations, but if a person decides to get behind the wheel of a vehicle while they are emotional, his or her focus and reaction time could be significantly impaired. In order to better understand the context and scope of this study, it must first be determined what defines an “emotional driver.” Due to the subjective nature of emotions, there is no particular test or exact measure of a person’s emotions at the time of crash. According to the “Alabama eCrash Data Element Manual (DEM) for the Alabama Uniform Traffic Crash Report (AUTCR),” the manual that guides data input for the crash data used in this study, a driver should be coded as “emotional” if he or she is depressed, angry, disturbed, or something similar [1]. Additionally, one should be coded as “emotional” only if the driver’s emotional state is believed to have contributed to the occurrence of the crash [1]. This emotional state must be classifying the driver’s condition at the time prior to the crash and not after. In order to maintain credibility for such seemingly arbitrary data in reports, officers are highly trained and knowledgeable about each data element and its possible data inputs for the reports. This helps maintain accurate, consistent, and complete information regarding crashes [1].Some effects of emotional driving have been called “aggressive driving” or “road rage.” It has been found that at least 1500 deaths occur each year in the United States solely as a result of this “aggressive driving” behavior [2]. An analysis of these types of crashes involving emotionally impaired drivers that identifies the factors influencing the crash severity could lead to changes that could potentially increase traffic safety for everyone, although little research has been performed on this subject in the past.The aim of this study is to identify the significant factors influencing crash severity in crashes involving emotional drivers and compare the effects of each one. The data used in this analysis was extracted from the Critical Analysis Reporting Environment (CARE) maintained by the Center for Advanced Public Safety at the University of Alabama. Factors that were explored in the study include driver, vehicle, traffic, roadway, geometric, and environmental characteristics which could have a large impact on the crash severity of a variety of crash types. For this study, crash severity was separated into three categories: fatal/incapacitating injuries, minor/possible injury, and property damage only. The multinomial logistic (logit) regression model was applied to the data in order to identify and compare the significant factors of crash severities in emotional driving-related crashes. In order to gain a better understanding of the factors influencing emotional driving crashes, specifically, a similar modeling procedure was performed on a sample of normal driving crashes in the same time period and location, and the results were compared against those of the emotional driving crashes.
2. Literature Review
- Several studies have been performed in order to identify some of the effects related to different emotional states. Some of the effects studied include changes in reaction time and likelihood of making risky decisions. A 2018 study by Yang et al compared the effects of anger and fear on risky decision-making [3]. A similar study performed by Coget, Haag, and Gibson in 2011examined the impacts of anger and fear on intuitiveness, rationality, and effectiveness of decision-making, finding that the intensity of emotions plays a significant role in the emotion’s effects [4]. In 2009, Gambetti and Giusberti assessed the influence of trait anger on decisions in risky situations [5]. Their results indicated that a tendency to feel anger could increase familiarity perception while decreasing the perception of salience when facing risky situations [5]. A meta-analytic study performed by Angie et al in 2011 reviewed research examining the influence of discrete emotions on both judgement and decision-making outcomes, finding that discrete emotions can have moderate to significate effects [6]. In 2014, Xing examined the role of attention in links between emotion and decision making, finding that angry individuals tended to look more and sooner toward heuristic cues than did sad individuals [7]. Bright and Goodman-Delahunty in 2006 and Nuñez et al in 2015 performed similar studies evaluating emotional effects on jurors’ sentencing decisions [8,9]. Results of these studies found that anger did play a role in the decisions, resulting in an increase in conviction rates [8,9]. Building on studies evaluating the effects of emotions on decision-making, Szasz et al investigated the effects that emotion regulating strategies played on decision-making in 2016 [10]. Findings of their study suggest that emotion regulation strategies of negative affective states do have an immediate effect on decision-making and risk-taking behavior [10]. Similarly, a 2014 study by Beatty et al found that emotional regulation strategies influence human movement, including reaction time, rate of force production, and performance accuracy [11]. In 2015, Kreibig et al evaluated the stability of results of physiological reactivity between replications of the same study [12]. Results suggested replicable differentiation of amusement, disgust, and a mixed emotional state [12].An average of at least 1500 men, women, and children are injured or killed in the United States each year as a result of “aggressive driving” [2]. In 1997, Joint commissioned a survey that found that almost 90% of participants had experienced "road rage" in the 12 months prior to the survey and 60% admitted to losing their tempers behind the wheel [2]. Although the cause behind the frequency of road rage being so high is unknown, Connell proposed in 1997 that driving provides a field for stress and tension to accumulate without presenting an outlet to release the stress [2]. Researchers have spent countless hours trying to better understand “road rage.” In particular, several studies have been performed in an effort to identify particular factors that may influence or increase the likelihood of angry and aggressive driving [13-18]. Some of these studies even attempt to identify people who are more likely to drive aggressively based on personality traits [13,15]. A particular study performed by Hennessy and Wiesanthal in 1999 found that driver stress and aggression are greater in high-congestion conditions than low-congestion conditions [14]. In addition to studies focused on identifying the causes of aggressive or angry driving, numerous other studies have been performed with the aim of analyzing the influence of emotions and aggression on driving behavior [19-29]. Furthermore, some researchers have even gone on to assess the effects of drivers’ emotions and aggression on their likelihood of traffic violations and crash risk [26,30,31]. One cause of the increased crash risk and likelihood of traffic violations could be explained by studies by Lemercier and Cellier in 2008 and Jallais et al in 2014 whose results indicated that negative emotions can have poor effects on the information processing system which can result in inattention [32,33].
3. Data and Variable Settings
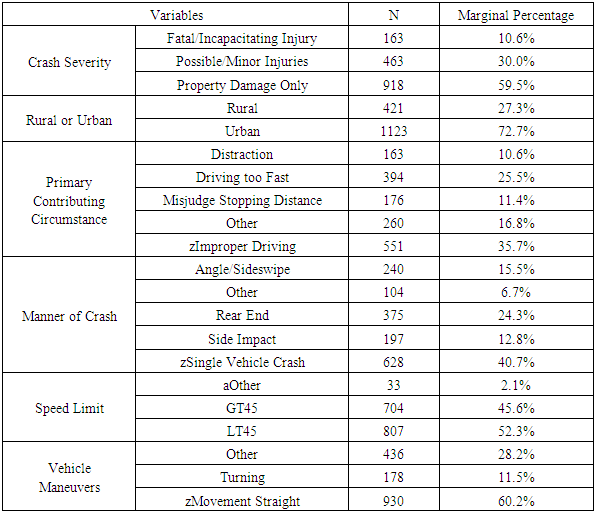
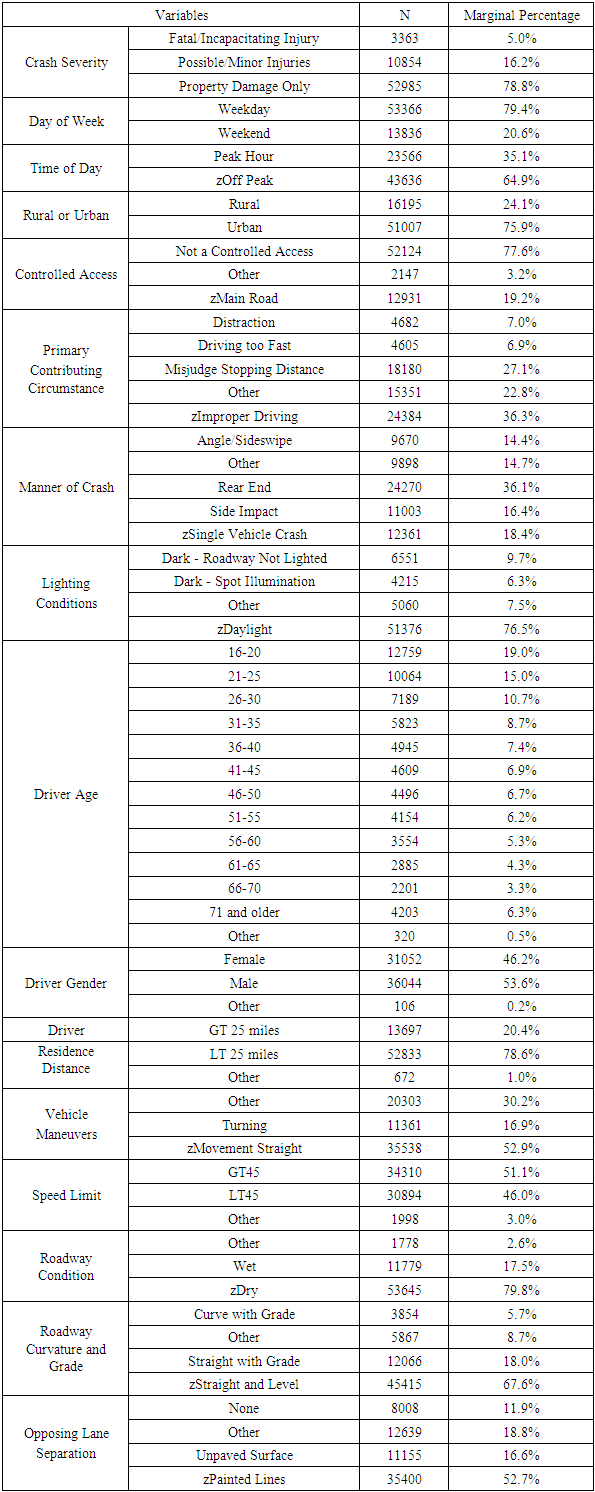
- It was previously mentioned that data was extracted from CARE software. The emotional driving database was a subset of driver condition. Crashes involving only emotional drivers were considered for the first analysis, while a sample of crashes excluding emotional drivers was considered for a second analysis. Results from the two analyses were compared for a better explanation and understanding of what influences crashes involving emotional drivers. In order to reduce error and produce results that are as accurate as possible, crashes involving unknowns were excluded from the study set by grouping them into a category called “Other” that was ignored for interpretation purposes. Crash severity was separated into three separate levels: fatal/incapacitating injury, minor/possible injury, and property damage only. Afterwards, data from the independent variables was grouped into relevant factions (i.e. time of day was categorized into peak hour and off-peak). Unknowns and variables with sample sizes that were too small to be significant were grouped into the “Other” category in order to retain the crash data from the other variables without skewing the results. After this, base variables were chosen based on frequency. The subvariable with the highest frequency was set as the base for the analysis.17 different independent variables were selected to be included in the model including driver characteristics (i.e. driver age), roadway characteristics (speed limit, roadway condition, curvature and grade, number of lanes), environmental characteristics (weather and lighting conditions), and crash characteristics (primary contributing circumstance, manner of crash, and vehicle maneuvers). A preliminary analysis was run on each of the two datasets and insignificant variables were removed for the final analysis. Tables 1 and 2 provide descriptive statistics of the variables that were considered for each of the final models.
|
|
4. Methodology
- When a traffic accident occurs, the severity of the crash is assigned into discrete categories based on the involved party with the most severe injury. The severity levels in the crashes range from property damage only (least severe) to fatal (most severe). In many cases, ordered response models are selected to analyze data where the outcomes can be ordered (such as in this case, where the severity could be ordered by increasing or decreasing crash severity levels). Although the ordered response models are more typical, multinomial logit models provide an alternative route that allows more flexibility and allows the independent variables to have non-monotonic effects on the dependent variable [34].For this paper, the multinomial logistic (or logit) regression modeling approach was used. Logistic regression is used in order to explain the relationship between a selected dependent variable and one or more independent variables. Binary logistic regression can be used in cases where the response variable has only 2 possible outcomes; however, in this case, where the dependent variable has a total of 3 possible outcomes, the multinomial logistic model should be used instead and takes the following form [34]:
 | (1) |
5. Results and Discussion
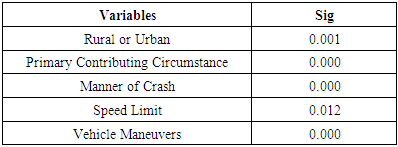
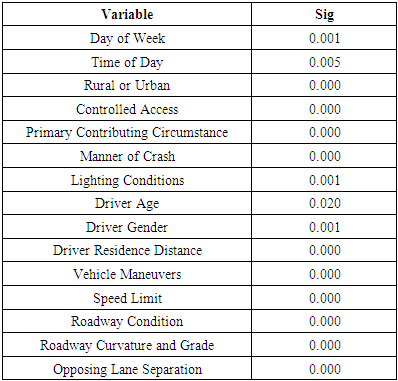
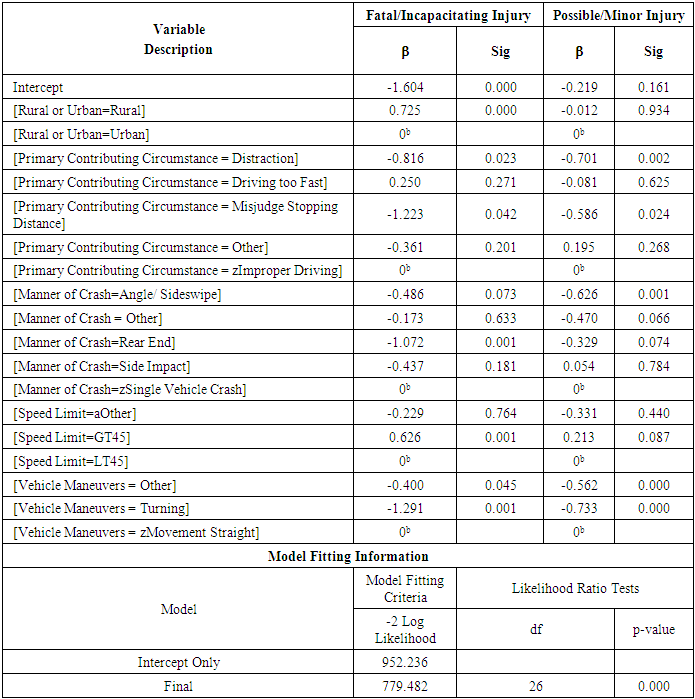
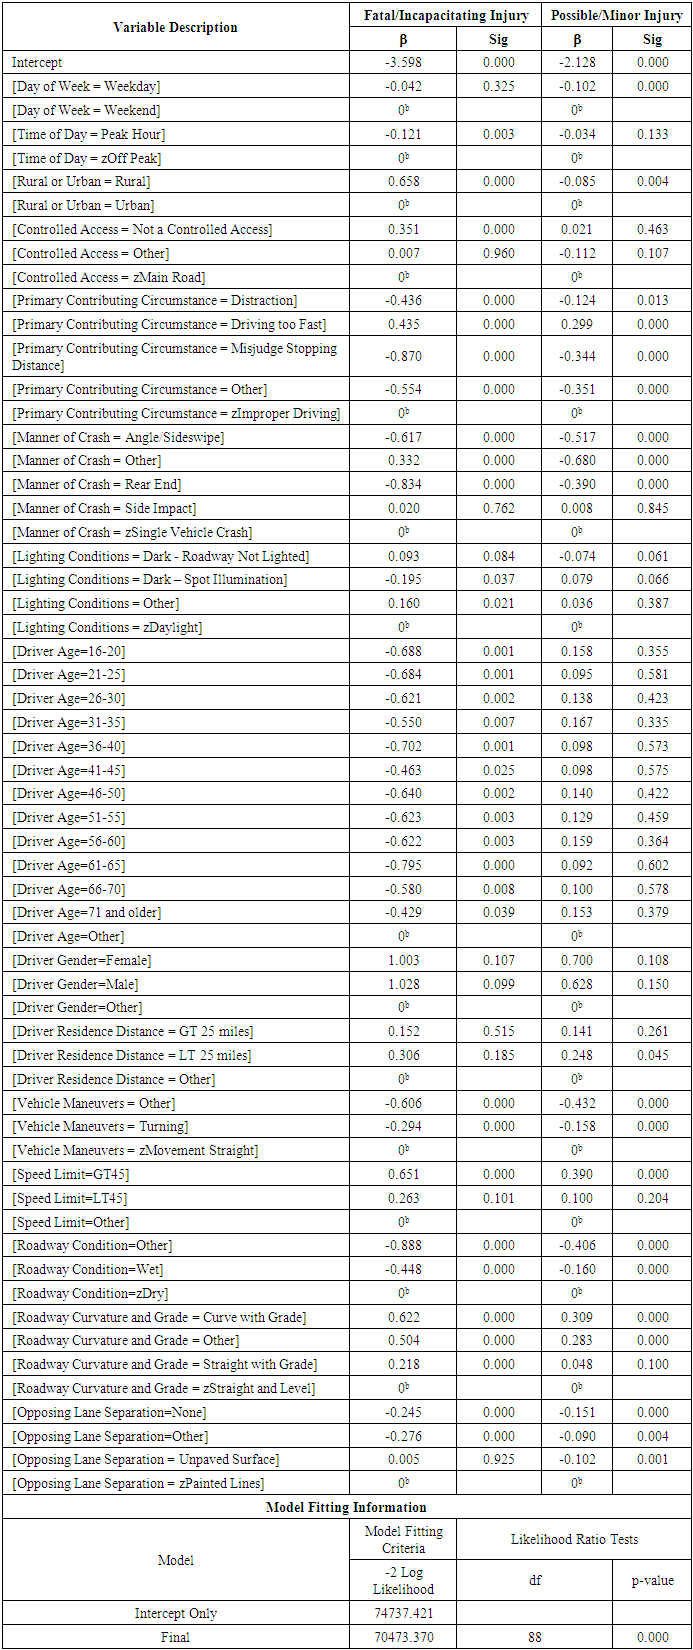
- Likelihood ratio test results, given below in Tables 3 and 4, show that rural/urban, primary contributing circumstance, manner of crash, speed limit, and vehicle maneuvers were all significant factors in emotional driving crashes while 15 variables were significant in normal driving crashes.
|
|
|
|
6. Conclusions
- Deaths resulting from vehicle crashes is a big issue in the United States, with more than 1500 deaths per year resulting from aggressive driving alone [2]. It is not safe to get behind the wheel of a car when one is emotionally impaired resulting in changes in reaction time, intuitiveness, rationality, and effectiveness of decision-making [4,11]. More research relating to crash severity in emotional driving crashes could result in safer roads for everyone. This study attempted to identify factors influencing different levels of severity associated with crashes involving emotional drivers. A comprehensive set of independent variables was used for the analysis including driver, vehicle, traffic, roadway, geometric, and environmental characteristics. A multinomial logit model was fitted to the data in order to identify factors with significant effects on crash severity where emotional driving is involved.Overall, rural/urban, primary contributing circumstance, manner of crash, speed limit, and vehicle maneuvers were all significant factors in the severity of emotional driving crashes. After comparing the results with results from normal driving data, it could be seen that both cases follow the same crash trends, with emotional driving crashes experiencing greater magnitudes of the trends. As both datasets showed such highly similar results, it appears that emotional drivers experience virtually the same crash severity risks as normal drivers. Based on the findings of the study, it could be proposed to reduce speed limits on rural roads in order to decrease the risk of fatal/incapacitating injury crashes, as both cases experienced increased risk of severe injury crashes in this case. Future research using a larger sample size of emotional driving crashes could be useful in adding to the findings here, as the current sample had only 1544 crash cases. Also, other factors such as traffic volumes could be considered to identify more influential factors on the crash severity in crashes involving emotional drivers.
ACKNOWLEDGEMENTS
- The authors would like to thank the Center for Advanced Public Safety.