-
Paper Information
- Previous Paper
- Paper Submission
-
Journal Information
- About This Journal
- Editorial Board
- Current Issue
- Archive
- Author Guidelines
- Contact Us
International Journal of Psychology and Behavioral Sciences
p-ISSN: 2163-1948 e-ISSN: 2163-1956
2017; 7(5): 127-134
doi:10.5923/j.ijpbs.20170705.02

Psychophysiological Preference Monitoring by Cerebral Hemoglobin Measurement during Chewing an Apple Piece
 Abstract
 Reference
 Full-Text PDF
 Full-text HTML
Soo-Young Park 1, Tadashi Hasebe 2, Motoaki Sugiura 3, Akio Nibe 1, Yuji Oura 1, Shinobu Kitani 2
1Faculty of International Agriculture and Food Studies, Tokyo University of Agriculture, Tokyo, Japan
2Faculty of Agriculture, Tohoku University, Sendai, Japan
3Institute of Development, Aging and Cancer, Department of Human Brain Science, Tohoku University, Sendai, Japan
Correspondence to: Soo-Young Park , Faculty of International Agriculture and Food Studies, Tokyo University of Agriculture, Tokyo, Japan.
| Email: |  |
Copyright © 2017 Scientific & Academic Publishing. All Rights Reserved.
This work is licensed under the Creative Commons Attribution International License (CC BY).
http://creativecommons.org/licenses/by/4.0/

In recent years, non-invasive monitoring of psychophysiological preferences for identifying unconscious reactions by measuring brain activity has attracted attention. However, no prior studies on the perception and consumption of food and drink have examined cerebral activity during chewing. Also, there is no research on food with multiple tastes that is eaten on a daily basis. Therefore, we investigated psychophysiological food-preference when chewing an apple by assessing cerebral blood flow (CBF) by using fNIRS (functional near-infrared spectroscopy). Gustatory sense and food preferences can be distinguished. However, instead of controlling for the taste, psychophysiological preference for information about taste was manipulated by presenting a nameplate showing the area where the food was produced. Independent component analysis (ICA) of CBF signals suggested that the average rate of taste identification with the nameplate was high (94.5%). We also tested the effects of chewing, which had not been investigated in previous studies. This was expected to expand the scope of research and its possibilities. It is suggested that methods of eliminating artefacts during chewing and methods of identifying preferences devised in this study would be useful for psychophysiological monitoring.
Keywords: Body movement, Chewing, NIRS, Independent component analysis, Food-preference test
Cite this paper: Soo-Young Park , Tadashi Hasebe , Motoaki Sugiura , Akio Nibe , Yuji Oura , Shinobu Kitani , Psychophysiological Preference Monitoring by Cerebral Hemoglobin Measurement during Chewing an Apple Piece, International Journal of Psychology and Behavioral Sciences, Vol. 7 No. 5, 2017, pp. 127-134. doi: 10.5923/j.ijpbs.20170705.02.
Article Outline
1. Introduction
- In recent years, non-invasive psychophysiological preference monitoring has attracted attention because of the development of brain activity measurement technologies such as fMRI (functional magnetic resonance imaging), fNIRS (functional near-infrared spectroscopy), MEG (magnetoencephalography) and EEG (electroencephalography). These can reveal unconscious reactions such as emotional movements without damaging participants. For example, there are studies of preferences for Coca-Cola versus Pepsi-Cola using fMRI [1], evaluation of responses to basic tastes (sodium chloride) using fMRI [2], preference evaluation of flavors [3] and colors [4] of plants using fNIRS, and reaction evaluation of basic tastes (sucrose solution) using fNIRS [5]. However, these are evaluations involving "drinking", "smelling", and "viewing", whereas there is no report of brain activities associated with "chewing" which is conducted with the majority of food. In addition, in previous work "food" has mainly been evaluated on the basis of basic tastes, whereas there is no research targeting "food" as a mixture of multiple tastes, which is essentially what we ingest on a daily basis. One reason for this could be the difficulty in removing the influence of body movements accompanying "chewing". Moreover, food texture is an important factor in taste evaluations. Measurement of cerebral blood flow (CBF) related to texture also involves the influence of body movements. On the other hand, Kopton and Kenning [6] suggested that further research using mobile fNIRS could be a valuable tool in developing the potential of new field experiment methodologies. Based on the above factors, in this study, we attempted to distinguish psychophysiological food preference by using fNIRS, when "chewing" an apple, by taking the following points into consideration and devising countermeasures against them. It is known that the gustatory sense and liking for preferred and non-preferred foods can be distinguished [7] and responses of CBF to the gustatory sense have been confirmed [2, 5, 8]. Moreover, there is a need to eliminate the effects of taste and texture in order to discriminate psychophysiological preferences. Therefore, in this study, we used a single apple, so that there was no difference in taste and texture. According to Fushiki [7], there are the following four components of food preference: Taste that satisfy physiological desires, taste that result from the food culture, taste that provide information (extrinsic information such as safety and taste has a strong influence on the processing of taste in the brain), and taste for specific ingredients that become addictive and stimulate brain's reward system. Fushiki [7] also indicated that information is the best seasoning. Therefore, instead of controlling for taste, psychophysiological preference was manipulated through information, by presenting a nameplate showing the area where the apple was produced as being either Japan or China.
2. Materials and Methods
2.1. Participants
- Eleven healthy right-handed Chinese international students staying in Japan participated in the experiment (age range = 21-31 years, mean age = 24.7, SD = 2.70, 5 males and 6 females). There is a tendency in Japan to worry about safety and security of food made in China. We believed that we could control the psychological impact of foods from China by targeting Chinese international students staying in Japan. This study was conducted in accordance with the ethical regulations of the Tokyo University of Agriculture based on the "Helsinki Declaration". We informed participants that they could discontinue their participation at any time. Written informed consent was obtained from all participants.
2.2. Measurements
- Using a wearable optical topography WOT-220 (Hitachi High-Technologies Corporation) [9], channel (Ch) 12 was placed at a position 10% away from the nose root based on the international 10-20 system [10] for the forehead, and CBF was measured (Figure 1). The ambient temperature was maintained at about 22°C using an air conditioner, to avoid effects of temperature change on skin blood flow [11]. The WOT-220 probes were fixed at the same interval of 3 cm, and 22 channels (Chs) are measured at the same time. The time resolution of each Ch was 20 msec and was digitized at a rate of 5 points per second. Spatial resolution is to be about 20-30 mm. Although CBF can acquire oxygenated hemoglobin concentration (Oxy-Hb), deoxygenated hemoglobin concentration (Deoxy-Hb), and the sum of both (Total-Hb), these are not Hb absolute values but rather relative values because the propagation path of light from irradiation to detection cannot be specified.
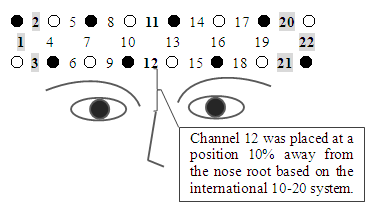 | Figure 1. WOT-220 probes and channels. The probes have a light source (●) and a light receiving components (○), fixedly arranged at the same interval of 3 cm, and which simultaneously measure CBF with 22 channels |
2.3. Materials
- We used an apple to provide mixed acidity and sweetness as well as a crunchy texture. One Japanese apple was peeled and cut into two adjacent pieces with a size of about 2 cm long, 2 cm wide, and 2 cm deep. Each piece of apple was explained as originating from China or Japan using a nameplate and verbally, and participants tasted each piece of apple. By cutting two adjacent pieces of the apple, we were able to control for variations in quality. The reason for controlling for quality was because it might be used to distinguish psychophysiological preferences without relying on the element of taste. The piece of apple was presented on a spoon. Because this was a blind test using only Japanese apples, the apple variety used was the familiar Fuji apples that are also produced in China. Initially, Rest (30 s) was set, and then one block of Tasting (40 s) and Rest (30 s) was repeated three times to comprise the overall task (Figure 2). The measurement time per task was around 240 s. The Tasting (40 s) sequence consisted of three steps: Lifting the spoon and waiting for a sound signal from a PC (5 s), taking the contents in the mouth upon receipt of the signal, and then returning the spoon to the table and starting to chew. Participants chewed the pieces of apple without swallowing if possible for 30 s, then swallowed it when a signal sounded (5 s). The contents presentation order in Tasting (40 s) was a dummy, a piece of apple and a piece of apple. The order of nameplate presentation was randomized (Nameplate task). The dummy task was conducted to confirm the difference from when actually chewing things. When conducting the dummy task, the participant only performed the actions accompanying tasting (lifting / returning the spoon, taking into the mouth, chewing, swallowing). He or she closed his or her eyes at all measurement times except during lifting and returning the spoon (5 s). Furthermore, in order to investigate the influence of the presence or absence of nameplate, we also conducted a task sequence of dummy-apple A-apple B, with participants being orally notified that the production area was different (AB task). After each task, we asked the participants which piece of apple tasted better and recorded their responses. The AB task was performed before the Nameplate task. After performing these once as a practice trial, the actual experiment was repeated twice in turn. In order to prevent unnatural tasting, we did not attempt to control the timing, frequency, intensity of mastication.
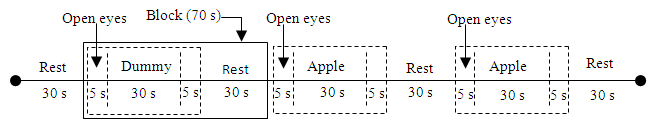 | Figure 2. Task. First rest, then repeat tasting (dummy or apple) and rest three times. 40 s Taste period occurred as follows: Lifting the spoon, putting the sample in his or her mouth and place the spoon onto the table (5 s, open eyes), keep on chewing without swallowing (30 s, closed eyes), and then swallow (5 s, closed eyes). The remainder was all eyes closed |
2.4. Data Analysis
- We analyzed the fNIRS data using independent component analysis (ICA) [12, 13], which finds unknown independent, original signals from plural different measurement signals via independence between original signals. Fast ICA (http://research.ics.aalto.fi/ica/fastica/) and MATLAB (MathWorks Inc., USA) software were used for data analysis. For details of Fast ICA's algorithm, see Hyvärinen and Oja [13]. ICA is used to reduce artefacts in various brain activity measurements such as EEG [14, 15], MEG [16], and fNRIS [17]. However, procedures for artefact separation and removal due to chewing-related body movements and preference determination methods have not yet been proposed. Therefore, we devised and applied an analysis method as follows: 1) Target data: In fNIRS CBF studies, Oxy-Hb is the most sensitive index [18], such that Oxy-Hb was taken as target data. Measurement data that had not been subjected to any processing such as filtering, smoothing or baseline correction was used [17]. The 30 s period involving chewing before swallowing, excluding the 5 s before and 40 s after the apple piece tasting was used (see Figure 2, hereinafter referred to as 30 s chewing data). Ch1 and 2, 3 (Ch1-3) and Ch20-22 were excluded from data analysis because there were many measurement obstacles due to hair. In addition, for the reason explained in 2) below, Ch11-12 not belonging to the left and right cerebral were also excluded.2) Extraction of independent components (ICs): Up to 16 ICs can be extracted using all channels of Ch4-19 at the same time, but it is difficult to judge which is artefact, and CBF of the left and right cerebral fields do not always match [19]. We thus divided them into two categories, Ch4-10 of the left cerebral and Ch13-19 of the right cerebral fields. In addition, since the timing, frequency, and intensity of mastication did not necessarily match up with the 30 s tasting data of nameplate A and B in Figure 3, ICA was carried out by dividing nameplates A and B respectively. When each Ch can be measured normally, the maximum number of extracted ICs for each of the right and left CBF is 7.3) Separation and removal of artefacts: The vicinity of Ch4 and Ch19 is significant in scent [3] and color [4] preference and taste [5] response evaluation. These are located near the insular cortex of the cerebral cortex primary gustatory area. For these reasons, Ch4 and Ch19 were the main targets, and separation of artefacts of Ch4 and Ch19 was prioritized. The fNIRS data include not only cerebral activity but also body movement and physiological motion (heartbeat and breathing) [20]. According to Hoshi and Tamura [20], fNIRS mainly measures Oxy-Hb in venous blood, so the signal change resulting from the heartbeat is very small. Changes due to respiration are much smaller than those caused by solving mathematical problems during fNIRS scanning. In addition, Sato et al. [8] revealed no relationship when comparing heartbeat by electrocardiogram measurement and Hb signal by fNIRS measurement. As can be seen in Figure 3, Oxy-Hb change for 30 s chewing data including body motion is remarkably large as compared with the remaining 30 s including only the physiological operation. In this study, we focused attention only on body movements, and identified and eliminated artefacts by the following procedure using IC or ICs extracted in 2). ① Select IC or ICs with small vertical movements of the approximate curve and repeated sharp movements as IC1, IC3, IC4 in Figure 5 (Kohno et al. [17] also separated similar ones as artefacts.). ② Repeat simulation of IC or ICs removal using selected IC or ICs. ③ Identify IC or ICs that can remove the artefacts while maintaining the original form of Ch4 and Ch19. ④ Remove IC or ICs as the artefacts when optimal simulation result is obtained. 4) Baseline fitting: Baseline fitting was performed with the aim of eliminating the noise of monotonous increase or decrease caused by the fact that Oxy-Hb is a relative value. Using 30 s chewing data of Ch4 and Ch19 after removing the artefacts, the baseline was calculated by first-order equation of the starting and ending origins, and subtracted (Figure 6).5) Preference determination: According to the experimental results of Elsadek and Fujii [4], who assessed only the right cerebral with fNIRS, Oxy-Hb near Ch4 was significantly decreased when viewing plants of a favorite color. Hoshi et al. [18] also showed that Oxy-Hb increased in the right prefrontal cortex during unpleasant emotions, and that Oxy-Hb decline was associated with pleasant emotions. Therefore, based on the confirmed food preferences, Oxy-Hb change which was thought to be relatively delicious (hereinafter referred to as Preferred) at the time of tasting and the other (Non-preferred) was applied to the following equation (1) for determination. 30 s chewing data after the baseline fitting process was applied separately every 5 s. In order to confirm a more detailed determination time zone, the determination for each second was also performed using Ch with a high determination rate.
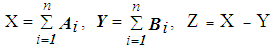 | (1) |
3. Results
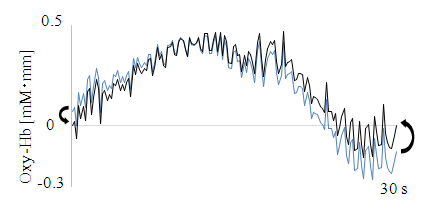
3.1. ICA
- Figure 3 shows CBF data for Ch19 of participant 6 (Table 1), measured during the second Nameplate task. Oxy-Hb changes of nameplate A and B when chewing the apple piece were remarkably bigger than those observed during the dummy task. In addition, Oxy-Hb changes also differed across nameplates A and B. These trends were seen for the other participants as well.Next, Figure 4 shows Ch13-19 measurement data from participant 6 obtained for nameplate A of the second Nameplate task and Oxy-Hb change after removal of ICs by Fast ICA. Oxy-Hb changes after removal of ICs in Figure 4 are the result of separating and removing IC1, IC3, IC4 of Figure 5 as artefacts. Figure 6 shows the result of baseline fitting using Ch19 data after ICs removal in Figure 4.
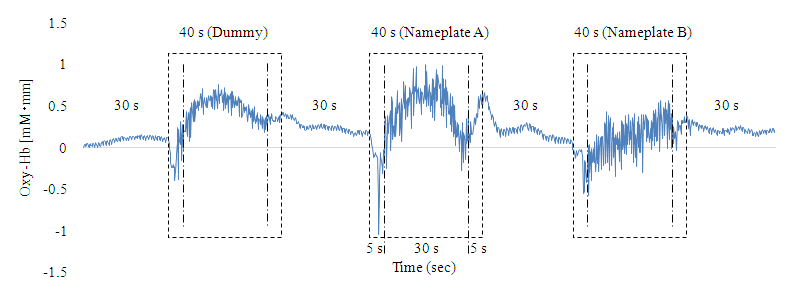 | Figure 3. Example of CBF data: Ch19 data of participant 6 |
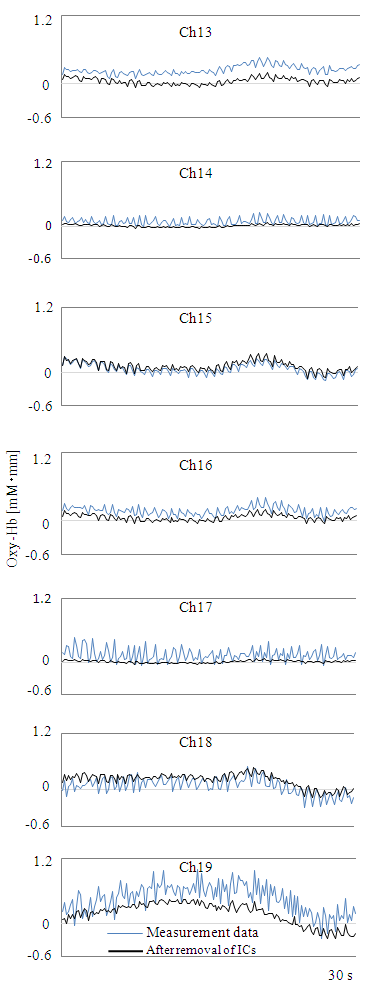 | Figure 4. Comparison before and after removal of ICs |
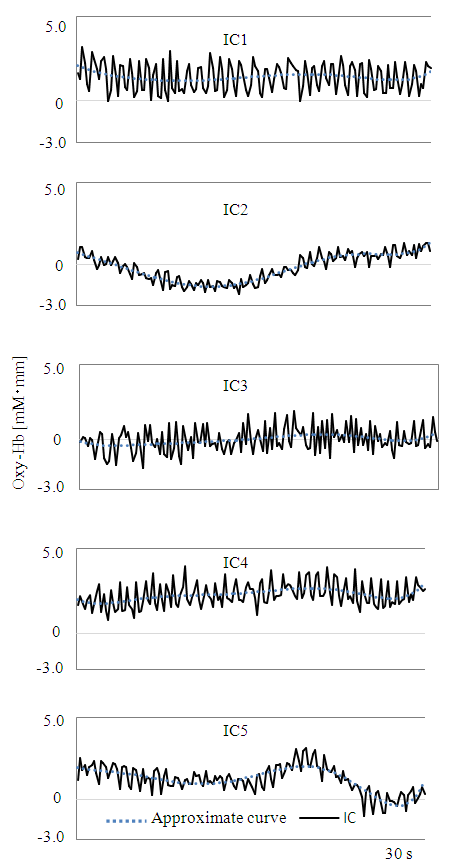 | Figure 5. Extracted ICs |
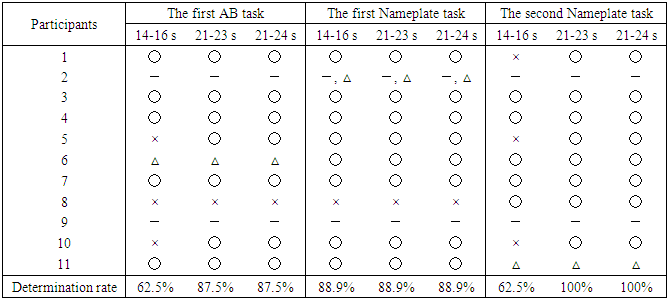
3.2. Preference Determination Results
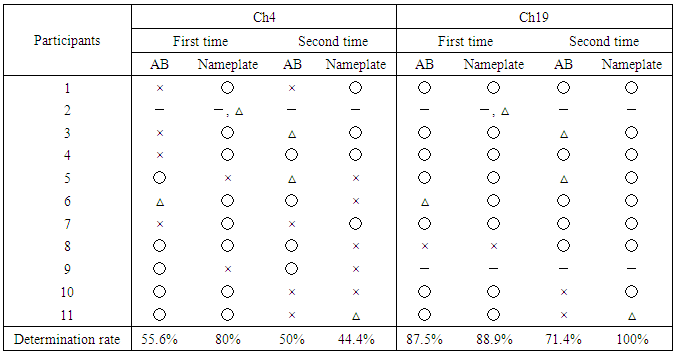
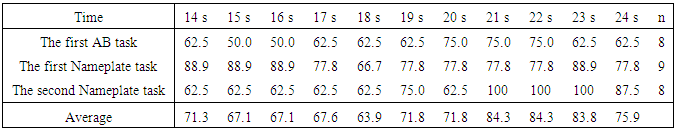
- Table 1 shows the preference determination results for Ch4 and Ch19. These are the determination results applied to equation (1) by dividing 30 s chewing data every 5 s, showing a high determination rate between 21 s and 25 s (hereinafter 21-25 s) of Ch19. The average determination rate for the first and second Nameplate tasks was very high at 94.5%, compared with 79.5% for the first and second AB task in Ch19. On the other hand, the determination rates for Ch4 were low, and some respondents noted that the tastes were the same for the two samples.To confirm a more detailed a determination time zone, determination was made every second using Ch19, which had the highest determination rate. The determination ratios for 14-16 s and 21-24 s were over 80%, and the average determination rate for 21-23 s was high (Table 2). Therefore, the determination was carried out for the time periods of 14-16 s, 21-23 s and 21-24 s, which all had high determination rates. The periods of 21-23 s and 21-24 s showed the same determination results as 21-25 s (see Table 1), but 14-16 s showed a tendency toward increased negative determination (Table 3).
|
|
 | Figure 6. Baseline fitting |
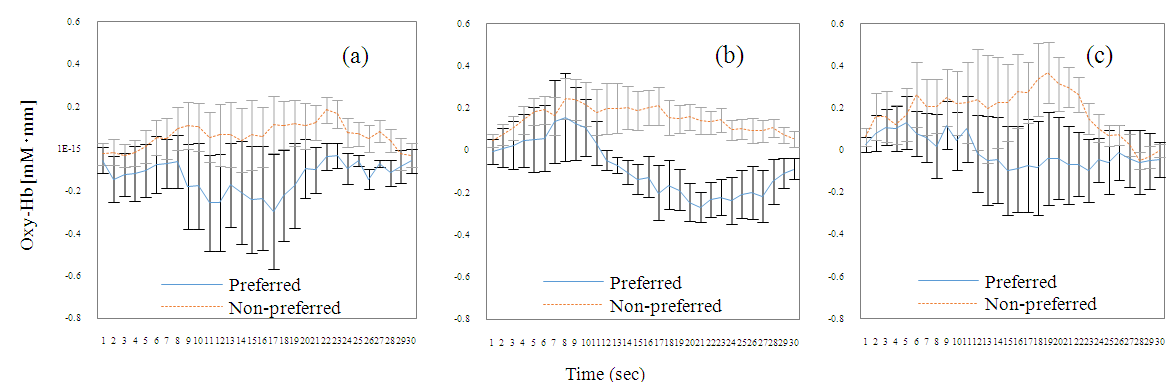 | Figure 7. Fluctuation in average Oxy-Hb for Ch19 and standard error. (a) is the first AB task (n = 7), (b) is the first Nameplate task (n = 8), and (c) is the second Nameplate task (n = 8). Only data of subjects who made positive judgments at 21-23 s were used (see Table 3). Error bars indicate standard error |
4. Discussion
- As shown in Figure 3, Oxy-Hb change was much greater at the time of chewing than at rest, and the three Oxy-Hb changes also differed according to the adjustment of the chewing force and the timing of chewing. Under these circumstances, Ch19 data show that artefacts due to body movement could be reduced while preserving the original form of fluctuation, so that after defining Ch for the main target, artefacts can be effectively removed as was done in this study, via simulation using the extracted ICs. In addition, because the average Oxy-Hb fluctuation of Preferred in (a), (b) and (c) in Figure 7 was less than that of Non-preferred, it can be said that the food preference determination using equation (1) is effective. Since the average determination rate was very high for the Nameplate task (94.5%), it can be said that this study was able to yield a valuable psychophysiological monitoring method. Chewing as an action can be added to methods used in previous preference determination studies, such as those on viewing, smelling, and drinking, which is expected to greatly expand the scope and possibilities of research. It is also significant that compared to previous studies using mean values of multiple data, such as the average Oxy-Hb changes (see Figure 7) as the main target of analysis, this study analyzed individual values of multiple participants (Table 1) by using equation (1).According to Fushiki [7], the Nameplate task used here assessed “taste resulting from information”. Despite the absence of a specific nameplate, participants were told that production districts were different in the AB Task. Since the average discrimination rate of the AB task was 79.5%, it was estimated that taste based on information has been assessed, even though there was no concrete presentation of information. The average rate of determination was higher for the Nameplate task than for the AB task. Therefore, it was considered that presenting clear information as opposed to ambiguous information was effective for improving the accuracy of identification.Ch19, which had an extremely high average determination rate in the Nameplate task, is located 7.5 cm to the left from the center of the forehead. Ch19 seems to correspond to the inferior frontal gyrus (IFG) [4, 19]. According to Elsadek and Fujii [4] and Tak et al. [19], it seems to be close to Broca’s area. The cerebral function of Ch19 is thought to be a response to the linguistic meaning process for the nameplate. However, as there is a possibility that somewhat different areas were measured across participants due to different head shapes and sizes (average size of the participants from the nose root to the occipital node = 34.36 cm, SD = 1.23 cm), it is difficult to say that the measured place is not the middle frontal gyrus (MFG) [21]. If indeed we accessed MFG activity, the cerebral function of Ch19 is emotion, and the high determination rate of Ch19 comes from the measurement of emotion. Since WOT-220 is a fixed probe type and not based on specific spatial position data, there is a limit to specifying the area. Finally, the Hb signal response is obtained via the BOLD effect (Blood Oxygenation Level Dependent) [22], but the delay (time lag) of hemodynamics to the taste stimulus is around 15 s [2]. For visual stimuli, there is a time lag of around 6 s [23]. The time lag of 15 s for taste stimuli supports the simple main effect test result for Preferred and Non-preferred in chewing times for the first Nameplate task, which was significant from 14 s onward.
5. Conclusions
- The results provide important scientific evidence regarding the determinants of food preferences. The average rate of determination was very high for the Nameplate task (94.5%), suggesting that the determination of food preferences using equation (1) was highly effective. It is suggested that methods of eliminating artefacts during chewing, as well as methods of identifying food preferences that were devised in this study, are useful for psychophysiological monitoring.
ACKNOWLEDGEMENTS
- This work was supported by JSPS KAKENHI Grant-in-Aid for Scientific Research (A) Number JP25252040. The original measurements were carried out of at the NODAI Research Institute (NRI) in Tokyo University of Agriculture. The authors would like to thank Prof. Kazuo Morozumi of NRI for his support, both moral and material.
Disclosure
- The authors have no relevant financial interests in this article and no potential conflicts of interest to disclose. The data were acquired and processed from public participants by the authors unaffiliated with any commercial entity.
References
| [1] | McClure, S. M., Li, J., Tomlin, D., Kim, S. C., Montague, L. M., and Montague, P.R., 2004, Neural correlates of behavioral preference for culturally familiar drinks., Neuron, 44(2), 379-387. |
| [2] | Ogawa, H., Wakita, M., Hasegawa, K., Kobayakawa, T., Sakai, N., Hirai, T., Yamashita, and Y., Saito, S., 2005, Functional MRI detection of activation in the primary gustatory cortices in humans., Chemical Senses, 30(7), 583-592. |
| [3] | Jo, H., Rodiek, S., Fujii, E., Miyazaki, Y., Park, B., and Ann, S., 2013, Physiological and psychological response to floral scent., HortScience, 48(1), 82-88. |
| [4] | Elsadek, M., and Fujii, E., 2014, People’s Psycho-physiological responses to plantscape colors stimuli: a pilot study., International Journal of Psychology and Behavioral Sciences 4(2), 70-78. |
| [5] | Okamoto, M., Dan, H., Clowney, L., Yamaguchi, Y., and Dan, I., 2009, Activation in ventro-lateral prefrontal cortex during the act of tasting: an fNIRS study., Neuroscience Letters, 451(1), 129-133. |
| [6] | Kopton, I. M., and Kenning, P., 2014, Near-infrared spectroscopy (NIRS) as a new tool for neuroeconomic research., Frontiers in Human Neuroscience, 8(549), 1–13. |
| [7] | T. Fushiki伏木亨, Mikaku to shikō no Saiensu 味覚と嗜好のサイエンス, Maruzen shuppan 丸善出版, Tokyo, Japan, 2008. |
| [8] | Sato, H., Obata, A. N., Moda, I., Ozaki, K., Yasuhara, T., Yamamoto, Y., Kiguchi, M., Maki, A., Kubota, K., and Koizumi, H., 2011, Application of near-infrared spectroscopy to measurement of hemodynamic signals accompanying stimulated saliva secretion., Journal of Biomedical Optics, 16(4), 047002. |
| [9] | Hitachi High-Technologies Corporation, 2017, [Online], Available: http://www.hitachi-hightech.com/jp/product_detail/?pn=ot_001. |
| [10] | Jasper, H., 1958, Report of the committee on methods of clinical examination in electroencephalography., Electroencephalography and Clinical Neurophysiology, 10(2), 370-375. |
| [11] | Takahashi, T., Takikawa, Y., and Kawagoe, R., 2016, Differences in the pulsatile component of the skin hemodynamic response to verbal fluency tasks in the forehead and the fingertip., Scientific Reports, 6:20978. |
| [12] | Comon, P., 1994, Independent component analysis, A new concept?, Signal Processing, 36(3), 287-314. |
| [13] | Hyvärinen, A., and Oja, E., 1997, A Fast fixed-point algorithm for independent component analysis., Neural Computation, 9(7), 1483-1492. |
| [14] | Vigário, R. N., 1997, Extraction of' ocular artefacts from EEG using independent component analysis., Electroencephalography and Clinical Neurophysiology, 103(3), 395–404. |
| [15] | Mantinia, D., Perruccia, M.G., Cuginia, S., Ferrettia, A., Romania, G.L., and Grattaa, C. D., 2007, Complete artifact removal for EEG recorded during continuous fMRI using independent component analysis., NeuroImage, 34(2), 598-607. |
| [16] | Ikeda, S., and Toyama, K., 2000, Independent component analysis for noisy data — MEG data analysis., Neural Networks, 13(10), 1063-1074. |
| [17] | Kohno, S., Miyai, I., Seiyama, A., Oda, I., Ishikawa, A., Tsuneishi, S., Amita, T., and Shimizu, K., 2007, Removal of the skin blood flow artifact in functional near-infrared spectroscopic imaging data through independent component analysis., Journal of Biomedical Optics, 12(6), 062111. |
| [18] | Hoshi, Y., Kobayashi, N., and Tamura, M., 2001, Interpretation of near-infrared spectroscopy signals: a study with a newly developed perfused rat brain model., Journal of Applied Physiology, 90(5), 1657-1662. |
| [19] | Tak, S., Uga, M., Flandin, G., Dan, I., and Penny, W. D., 2016, Sensor space group analysis for fNIRS data., Journal of Neuroscience Methods, 264, 103-112. |
| [20] | Hoshi, Y., and Tamura, M., 1997, Fluctuations in the cerebral oxygenation state during the resting period in functional mapping studies of the human brain., Medical and Biological Engineering and Computing, 35(4), 328–330. |
| [21] | Tsuzuki, D., and Dan, I., 2014, Spatial registration for functional near-infrared spectroscopy: From channel position on the scalp to cortical location in individual and group analyses., NeuroImage, 85, 92-103. |
| [22] | Ogawa, S., Lee, T., Nayak, A. S., and Glynn, P., 1990, Oxygenation-sensitive contrast in magnetic resonance image of rodent brain at high magnetic fields., Magnetic Resonance in Medicine, 14(1), 68-78. |
| [23] | Maeno, M., Uchida, K., Ishida, T., Ishihara, S., Koinuma, T., Magatani, K., and Yanasima, K., 2006, Response by visual stimulation with the BOLD effect and Motion Artifact: identification of the activating signal and motion artifact., Nihonhōshasengijutsugakkai 日本放射線技術学会, 62(3), 417-424. |