-
Paper Information
- Paper Submission
-
Journal Information
- About This Journal
- Editorial Board
- Current Issue
- Archive
- Author Guidelines
- Contact Us
International Journal of Psychology and Behavioral Sciences
p-ISSN: 2163-1948 e-ISSN: 2163-1956
2016; 6(3): 133-138
doi:10.5923/j.ijpbs.20160603.06

Achievement Motivation as a Function of Participation, Strive, Willingness to Work and Maintaining Work: Application of Structural Equation Modelling (SEM)
Afrifa-Yamoah E.
Department of Mathematical Sciences, NTNU, Norway
Correspondence to: Afrifa-Yamoah E., Department of Mathematical Sciences, NTNU, Norway.
| Email: |  |
Copyright © 2016 Scientific & Academic Publishing. All Rights Reserved.
This work is licensed under the Creative Commons Attribution International License (CC BY).
http://creativecommons.org/licenses/by/4.0/

Achievement Motivation is an interesting topic that should be carefully examined to find its core purpose. Self-report measures of achievement motivation are available, but are embodied in questionnaire measuring variety of personality traits. Researchers often require only the score on an achievement motivation scale, and a less time-consuming method of obtaining such scores is needed. Ellez (2004) proposed a 23-item scale instrument, named Achievement Motive Scale (AMS), to examine and measure the construct of achievement motivation. The items are intended to measure the students' achievement motive in the size of strive, participation, willingness to work and maintaining the working on a five scores Likert scale. The aim of this article is to study the relationship, formulate a model and test the significance of the four dimensions of the AMS. The survey design was employed involving 295 first and second year senior high school students. Using Hu and Bentler (1999) suggested benchmarks for continuous data, the analysis reported a RMSEA = 0.188 > 0.06, TFI = 0.395 < 0.95, CFI = 0.798 < 0.95, giving an indication the model fit cannot be concluded to be good. The hypothesis that the model is correct was falsified by the application of SEM. Among the four dimensions, participation was statistically insignificant in measuring one’s achievement motivation level. Although, the three other dimensions were identified as significant, the indicator items do not explain much of their variability. This suggests that more other items should be considered to bridge the huge gap of variability left to randomness.
Keywords: Structural Equation Modelling, Achievement Motive Scale
Cite this paper: Afrifa-Yamoah E., Achievement Motivation as a Function of Participation, Strive, Willingness to Work and Maintaining Work: Application of Structural Equation Modelling (SEM), International Journal of Psychology and Behavioral Sciences, Vol. 6 No. 3, 2016, pp. 133-138. doi: 10.5923/j.ijpbs.20160603.06.
Article Outline
1. Introduction
- Achievement Motivation is an interesting topic that should be carefully examined to find its core purpose. It is first developed in an individual who has an extreme interest in accomplishing a task, therefore, is determined to put forth an effort in accomplishing the task. There are people who take on the role of achievement motivation in a different manner. Achievement motivation theorists’ attempt to explain people’s choice of achievement tasks, persistence on those tasks, vigor in carrying them out, and performance on them have lead to the development of variety of constructs to explain how motivation influences choice, persistence, and performance. Researchers have attributed the main factor bringing achievement motivation into existence as the need for achievement (Erdogan et al., 2011). The need for achievement shows itself as a desire to complete a task or behaviour according to perfection criteria or even better than these criteria. For instance, doing something much more than the rivals, reaching or obtaining a difficult goal, solving a complex problem, improving skills, and completing homework successfully show the need for achievement. Individuals with high achievement need to take reasonable risks prefer activities that can be achieved easily, reach inner satisfaction stemming from their successes, and do not care for anything except their tasks. Low need for achievement is thought to be associated with a sense of low competence, low expectations, and orientation toward failure (Erdogan et al., 2011).The concept of achievement motivation is viewed as a complex human incentive to bring about results. It stimulates a systematic pattern of behaviours towards the desired ends, continuously urging them till results actually manifest. Elliot and McGregor’s (2001) model of achievement motivation, discuss two broad classes of goals: mastery goals, that is, to “master” the task at hand and performance goals. Research indicates that when students adopt mastery goals, they tend to engage in more effective cognitive processing strategies (Noar, Anderman, Zimmerman & Cupp, 2005). Social goals are another important type of goals, although not examined at length as mastery and performance goals (Dowson & McInerney, 2001). In these goals, social reasons are the main concerns for trying to achieve in academics. According to Maehr (2008) achievement motivation is largely social psychological in nature. It often occurs within groups, where interpersonal interactions can undermine or facilitate engagement in the tasks to be done. Achievement motivation research has historically been examined using either a classic or contemporary approach. The concept has often been measured through the scoring of fantasy elicited in story form by thematic apperception tests (TAT) and TAT-like stimuli. Self-report measures of achievement motivation are available, but are embodied in questionnaire measuring variety of personality traits. Since researchers often only require score on an achievement motivation scale, a less time-consuming method of obtaining such scores seemed to be needed. Ellez (2004) proposed an Achievement Motive Scale (AMS) with 23 items, to examine and measure the construct of achievement motivation. The items measure the students' achievement motive in the size of strive, participation, willingness to work and maintaining the working on a five scores Likert scale.The instrument has been used quiet often by researchers in recent times (eg. Demirel & Arslan Turan, 2010; Aydin and Coskun, 2011; Demet, 2015). The scale is reported in literature to be reliability. Demirel & Arslan Turan (2010) in their study used the scale in the form of a field questionnaire and reported a reliability coefficient of 0.76. The KMO coefficient of 0.81 and Cronbach alpha reliability coefficient 0.70 was reported by Aydin and Coskun (2011) when the scale was employed to study secondary school students’ achievement motivation towards Geography lessons in Turkey. Demet (2015) administered the scale on 250 university students to identify the correlation between the musical interests and achievement motives of prospective music teachers. The scale was subjected to a factor analysis to establish its construct validity. The analysis showed that item 5 did not belong with any of the other factors therefore it was excluded from the scale. A Cronbach’s alpha reliability coefficient of 0.89 was reported. The reliability coefficients for the sub-dimensions were as follows: 0.79 for willingness to work, 0.82 for maintenance of work, 0.72 for participation, and 0.80 for strive. The aim of this article is to study the relationship, formulate a model and test the significance of the four dimensions of the AMS using structural equation modelling (SEM). The hypothesis that the dimensions of the model adequately measure the construct of achievement motivation is tested using SEM.Statistical modelling is crucial in understanding complex phenomena of life. In social and behavioural sciences, there is an increasing complexity and specificity of research questions (Hoyle, 1995), with most constructs being latent. As a result, latent variable modelling has become a popular research tool. A quite recent method often employed is the structural equation modelling (SEM). Accounts of the statistical theories underlying SEM appeared in the 1970s. The technique has grown in popularity as a result of the massive strides in its software development, notably LISREL, AMOS, Mplus and Mx. This has increased the accessibility of SEM to researchers. The application of SEM in psychological studies is viral. MacCallum and Austin (2000) reviewed approximately 500 published articles appearing in 16 psychological research journal dated 1993 to 1997. In a fuzzy, overlapping and non-exhaustive categorization, they explored the usage of SEM in substantive research in psychology. They reported that SEM was heavily used in observational studies than in experimental studies. It is mostly employed in cross-sectional and longitudinal studies. Steele et al (2008) reported that although SEM techniques were used in <4% of the empirical articles appearing in 7 paediatric psychology journals between 1997 and 2006, the results indicated a recent increase in studies employing SEM techniques.
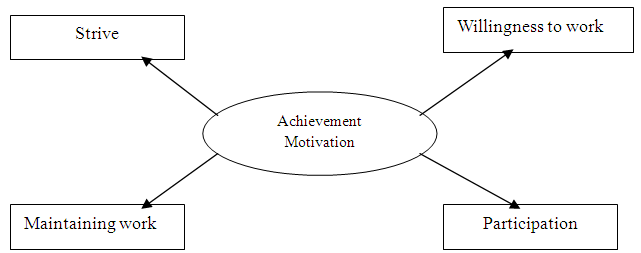 | Figure 1. Ellez’s Construct of Achievement Motivation |
2. Method and Materials
2.1. Structural Equation Model (SEM)
- Structural equation modelling (SEM) is a series of statistical methods that allow complex relationships between one or more independent variables and one or more dependent variables. SEM provides a general and convenient framework for statistical analysis that includes several traditional multivariate procedures: factor analysis, regression analysis, discriminate analysis and canonical correlation. A structural equation model is a complex composite statistical hypothesis. It consists of 2 main parts: The measurement model represents a set of p observable variables as multiple indicators of a smaller set of m latent variables, which are usually common factors. The path model describes relations of dependency-usually accepted to be in some sense causal-between the latent variables. SEM is a hybrid between some form of analysis of variance (ANOVA)/regression and some form of factor analysis. SEM allows one to perform some type of multilevel regression/ANOVA on factors. The overall objective is to establish that a model derived from theory has a close fit to the sample data in terms of the difference between the sample and model-predicted covariance matrices.The structural equation model,
 where
where  is a
is a  vector of endogenous latent variables and where it is assumed that the
  vector
  of exogenous latent variables have mean
  and covariance matrix
  , and that the
  vector
  of error terms has zero mean and covariance matrix
  , and
, and  . If
. If  and setting
  , it follows that;
 and
and The measurement models for the p endogenous observed variables, represented by the vector y, and the q exogenous observed variables, contained in the vector X, relate the observed variables to the underlying factors and may be expressed as;
 respectively.The mean vectors of the observed variables are;
 In general, in a single population,
  will not be identified without the imposition of further conditions. It further follows that;
 and
and
2.2. Sample and Data Collection
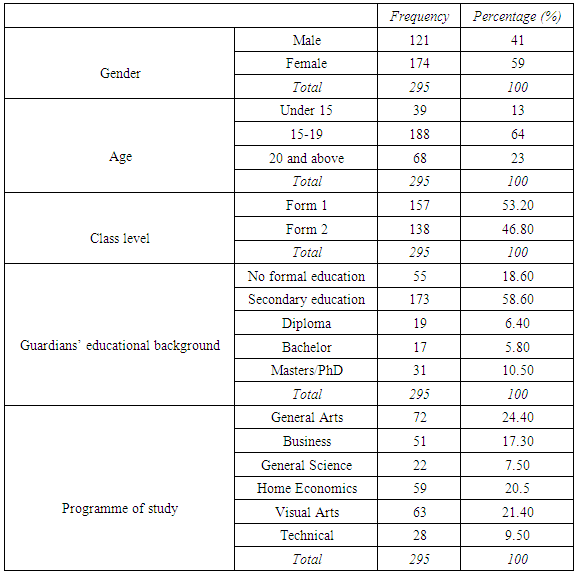
- The total sample included 295 senior high school students recruited in Kwabre East district of Ghana in 2013/14 academic year. The sample was formed through simple random selection scheme. Recruitment and consenting procedures were adhered to. The survey research method was employed. The instrument consisted of paper and pencil questionnaire administered by the researcher. The questionnaire was segmented into three parts under the headings personal background, subject matter and matters arising. The personal information of the respondents is shown in Table 1.
|
2.3. Definition and Construction of Analytical Variables
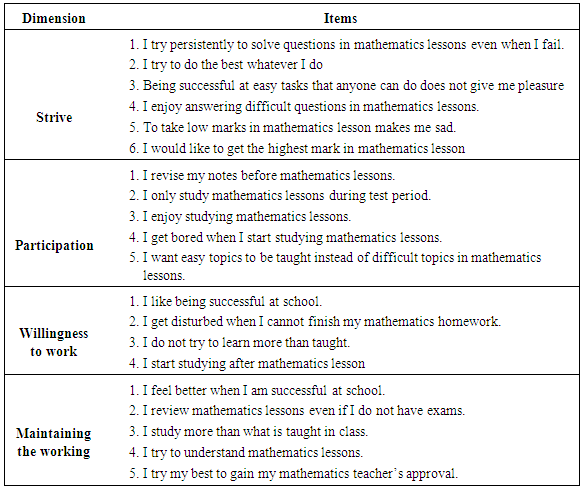
- Achievement Motivation is defined for this study as an extreme interest and a determination in accomplishing a task. It was measured by adapting 20 items of the “Achievement Motive Scale” (AMS) developed by Ellez (2004). The three items dropped were highly correlated with the others. This scale was chosen because it fits well into the definition of achievement motivation employed in this study. Students' achievement motivation is measured in the size of strive, participation, willingness to work and maintaining the working on a five scores likert scale. Items used to measure these four dimensions of achievement motivation are presented in Table 2. The scale was developed to measure students’ achievement motivation levels on a scale of 1 to5 defined as "most suitable (4.60-5.00)", "more suitable (4.00-4.59)", “suitable (3.00-3.99)", "not suitable (2.00-2.99)" and "not at all suitable (1.00-1.99)". The 20 items adopted from Achievement Motive Scale (AMS) shown in Table 2. A Cronbach alpha reliability coefficient of 0.79 was obtained and according to the results obtained, the scale can be expressed as a reliable instrument (Demirel & Arslan Turan, 2010).
|
3. Data Analysis and Results
- The analysis was conducted in SPSS AMOS version 24. The maximum likelihood estimates were obtained to assess the goodness of fit of the construct of achievement motivation as a function of the individual’s strive, participation, willingness to work and maintaining the work using SEM.
3.1. Parameter Estimation and Model Fit
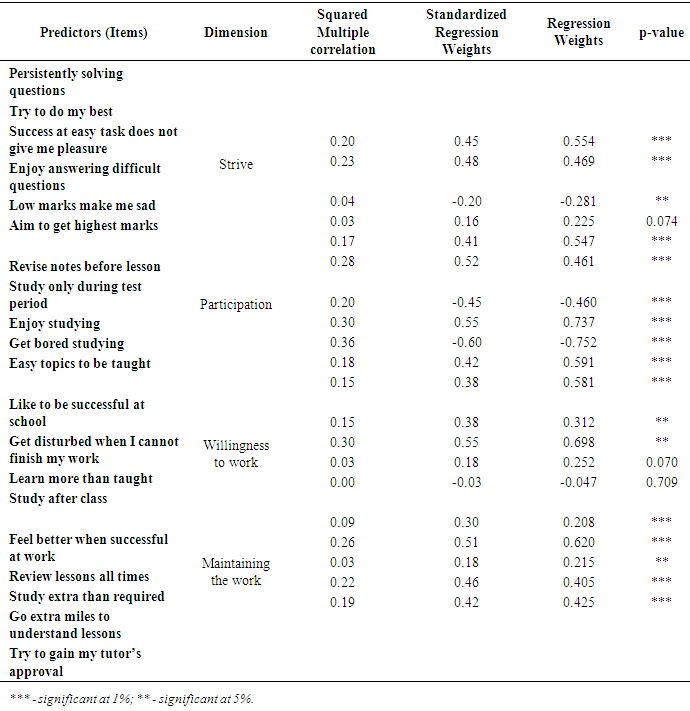
- Table 3 presents an analysis on the significance or otherwise and the contribution of each item to the measurement of the dimensions of achievement motivation. On the dimension, strive, the most influential item is “I try to do the best whatever I do” explaining 23% of the variability in strive. All items but “I enjoy answering difficult questions in mathematics lessons” which explains only 3% of the variability in strive, were identified as significant predictors at 5% level of significance. For the dimension, participation, the item “I enjoy studying mathematics lessons” explained most of its variability, about 36%, with the item “I want easy topics to be taught instead of difficult topics in mathematics lessons” explaining 15% variability, which is the least among the items considered. All items predicting an individual’s participation in Mathematics lessons were identified as significant 5% level of significant. Only two of the four items considered for measuring one’s willingness to work, were identified at 5% significance level as statistically influential. The two significant predictors, “I get disturbed when I cannot finish my mathematics homework” and “I like being successful at school”, measured 30% and 15% respectively of the variability in the dimension, willingness to work. The dimension, maintaining the work had all its predictors identified as significant at 5% significance level. The most influential predictor “I review mathematics lessons even if I do not have exams” explained 26% of its variability.
|
3.2. Path Model
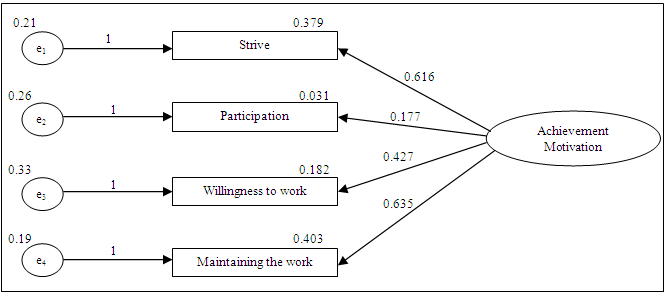
- The four dimensions in relation to achievement motivation are at this point treated as the observed variables, because the scale is developed such that based on the indicator items, appropriate scores for the dimensions are assigned to obtain one’s overall Achievement Motivation level. Figure 2 and Figure 3 depict the path output and the results of SEM respectively from the analysis.
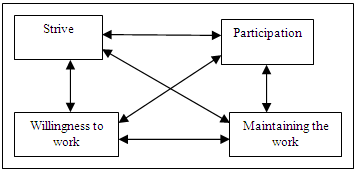 | Figure 2. Path model of SEM |
4. Conclusions
- Based on the analysis, the Achievement Motive Scale does not adequately measure the construct of Achievement Motivation. The items categorised under the four dimensions, strive, participation, willingness to work and maintaining the work proposed by Ellez (2004) to measure one’s achievement motivation do not adequately achieve the intended purpose. Among the four dimensions, participation was statistically insignificant in measuring one’s achievement motivation level. Although, the three other dimensions were identified significant, the indicator items do not explain much of their variability. This suggests that more other items should be considered to bridge the huge gap of variability left to randomness.
 Abstract
 Reference
 Full-Text PDF
 Full-text HTML