
-
Paper Information
- Paper Submission
-
Journal Information
- About This Journal
- Editorial Board
- Current Issue
- Archive
- Author Guidelines
- Contact Us
International Journal of Psychology and Behavioral Sciences
p-ISSN: 2163-1948 e-ISSN: 2163-1956
2015; 5(5): 179-183
doi:10.5923/j.ijpbs.20150505.01
The Effect of Anxiety Sensitivity on the Autonomic Nervous Reaction during the Cold Pressor Test: A Pilot Study
 Abstract
 Reference
 Full-Text PDF
 Full-text HTML
Naomi Dodo1, Ryusaku Hashimoto2
1Department of Clinical Psychology, School of Psychological Science, Health Sciences University of Hokkaido, Kita-ku, Sapporo, Japan
2Department of Communication Disorders, School of Psychological Science, Health Sciences University of Hokkaido, Sapporo, Japan
Correspondence to: Naomi Dodo, Department of Clinical Psychology, School of Psychological Science, Health Sciences University of Hokkaido, Kita-ku, Sapporo, Japan.
| Email: |  |
Copyright © 2015 Scientific & Academic Publishing. All Rights Reserved.
This study examined the physiologic response to the cold pressor test (CPT). There are inconsistencies in heart rate variability reaction to the CPT. Spectral analysis is widely used to measure heart rate variability. However, the high-frequency (0.16–0.40 Hz) component, which is an index of parasympathetic nervous system activity, is contaminated by respiratory sinus arrhythmia. Thus, inconsistencies between previous studies may be the result of spectral analysis. Lorenz plot analysis has recently been proposed as a way to quantify the R-R heartbeat interval. The relationship between anxiety sensitivity (AS) and autonomic nervous responses is also unclear. Moreover, subjective pain induced by the CPT is affected by AS. The aims of this study were: (1) to clarify the differences between spectral analysis and Lorenz plot analysis in the CPT, and (2) to determine the influence of AS on the autonomic nervous response. Twenty-four university students participated in this CPT study and were divided into low-AS (n = 9) and high-AS (n = 15) groups, based on Anxiety Sensitivity Index scores. The study included three phases: Rest, CPT, and Recovery. We measured subjective pain and fear of pain as indices of sensation and psychological factors. Autonomic nervous response data were also collected during each phase. Scores for subjective pain did not differ significantly between groups. Scores for fear of pain were higher in the high-AS group, relative to the low-AS group. Our result indicated that spectral analysis did not detect the changes in autonomic nervous responses resulting from the CPT. By contrast, Lorenz plot analysis revealed that a parasympathetic nervous response (CVI) was evoked during the CPT and Recovery phases in the low AS group. According to our results, Lorenz plot analysis is appropriate for investigating the autonomic nervous response during the CPT.
Keywords: Cold pressor test, Autonomic nervous response, Spectral analysis, Lorenz plot analysis, Anxiety sensitivity
Cite this paper: Naomi Dodo, Ryusaku Hashimoto, The Effect of Anxiety Sensitivity on the Autonomic Nervous Reaction during the Cold Pressor Test: A Pilot Study, International Journal of Psychology and Behavioral Sciences, Vol. 5 No. 5, 2015, pp. 179-183. doi: 10.5923/j.ijpbs.20150505.01.
Article Outline
1. Introduction
- Obrist [1] identified two types of coping in individuals performing stress tasks: active and passive. In active coping, alpha- and beta-adrenergic responses (i.e., the sympathetic nervous system) increase, and cholinergic responses (i.e., the parasympathetic nervous system) decrease, resulting in an increased heart rate. By contrast, in passive coping, beta-adrenergic responses decrease, and alpha-adrenergic and cholinergic responses increase, resulting in a decreased heart rate [2-4]. The cold pressor test (CPT), in which participants submerge a body part (hand or foot) in cold water, is used as a pain induction technique. In the CPT, participants are unable to control the situation; therefore, they are forced to cope with pain in a passive manner. According to Obrist [1], the CPT evoked a parasympathetic nervous response in such participants.However, there were inconsistencies between participants in the heart rate variability induced by the CPT. Wirch et al. [5] reported that a sympathetic nervous response was evoked, but the parasympathetic nervous response was not changed during the CPT. By contrast, Huang et al. [6] reported that the parasympathetic nervous response increased during the CPT. In addition, several studies did not find any changes in autonomic nervous responses [7-8].Some possibilities that may account for these discrepancies [5-8] are the influence of breath control and anxiety in the participants. With respect to methodology, spectral analysis is widely used to measure heart rate variability (HRV) [5-8]. However, the high frequency (0.16–0.40 Hz) component, which is an index of parasympathetic nervous system activity, is contaminated by respiratory sinus arrhythmia (RSA). This indicates that the high frequency component is influenced by breathing rate and depth, which is unrelated to parasympathetic nervous responses [9]. Thus, inconsistency between previous studies [5-8] may be due to the procedure of breath control. To mitigate the confounding effect of RSA at high spectral frequencies, Lorenz plot analysis has recently been recommended as a way to quantify the heartbeat R-R interval [10]. The advantage of Lorenz plot analysis is that it allows for parasympathetic and sympathetic nervous system activity to be measured separately. In addition, it is not necessary for the participants to control their breathing at a constant rate and depth [11].As for the potentially confounding effects of anxiety, subjective pain induced by the CPT was found to be affected by anxiety sensitivity (AS) [12]. AS is one of the most important concepts in understanding subjective pain [12] and is defined as the belief that anxiety-related sensations have negative consequences [13-14]. Keogh and Birkby [12] and Imai et al. [15] reported that the estimates of subjective pain were higher in participants with high AS (particularly women) relative to those with low AS. However, the relationship between AS and autonomic nervous responses is unclear. The aims of this study were to clarify the difference between spectral analysis and Lorenz plot analysis in the CPT, and to determine the influence of AS on autonomic nervous responses.
2. Methods
2.1. Participants
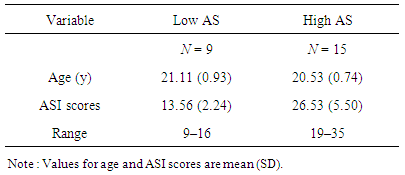
- Initially, 32 college students were recruited to participate in the study. We excluded four participants with histories of anxiety disorders or smoking. Data from four participants were excluded from the analyses because they could not submerge one hand in cold water for three minutes. None of the participants used autonomic or neurovascular medication. Therefore, the results were based on data from the remaining 24 participants (9 men and 15 women; age range: 19–22 years; mean age: 20.8 years). Written informed consent was obtained from all participants in accordance with the Declaration of Helsinki.All participants completed the Anxiety Sensitivity Index [16], using the Japanese version of the Anxiety Sensitivity Index, which was standardized by Muranaka et al. [17]. Muranaka and Sakano [18] reported Japanese normative data as follows: the mean score for 9,603 participants (5,068 men and 4,535 women) was 17.1, with a standard deviation of 10.5. Based on this mean score, we assigned participants who scored below 16 to the low-AS group and those who scored 19 or above to the high-AS group (Table 1). When Keogh and Birkby [12] examined the psychological responses, they compared three groups based on the ASI score: low, middle, and high ASI score. Our research interest was focused on the autonomic nervous response, and we considered that a graded change in the autonomic nervous response is not a function of this psychological parameter (ASI). Therefore, we did not divide our participants into the three groups based on participants’ individual ASI scores.
|
2.2. Procedure
- We used the CPT as a pain induction technique. The study included three phases: Rest, CP, and Recovery. Each phase continued for 3 min, during which time the participants focused on a fixation point. Participants arrived at the laboratory (room temperature: 24 ± 2°C; relative humidity: 36 ± 7%) without having consumed food or drink, other than water, for at least 2 hours. In the Rest phase, participants relaxed. In the CPT phase, each participant submerged his or her non-dominant hand in cold water held at a constant temperature of 5°C in a water bath (TMi-150, AS ONE Co., Ltd, Osaka, Japan). In the Recovery phase, participants removed their hands from the water and relaxed. Upon completion of all three phases, participants performed breathing exercises to promote relaxation. We confirmed that participants’ pain had completely subsided before the experiment was considered complete.
2.3. Measures
2.3.1. Subjective Pain
- The Wong-Baker FACES Pain Rating Scale [19] was used to measure sensory pain perception. Participants rated their pain experience on a scale from 0 (no pain) to 5 (the worst pain imaginable or unbearable pain). Participants rated their subjective pain upon completion of the Recovery phase.
2.3.2. Fear of Pain
- As a measure of participants’ psychological reaction to pain, they evaluated their feelings of fear in the CPT phase, using three adjectives: afraid, scared, and terrified [20]. Participants rated their fear on a scale from 0 (no feelings) to 3 (very strong feelings). All participants rated their subjective fear of pain upon completion of the Recovery phase.
2.3.3. Autonomic Nervous Response
- Autonomic nervous response data were collected during all three phases. Heart activity was measured using an electrocardiogram with three Ag–AgCl disposable electrodes (PSC-SC43m, Senstec Co., Ltd, Tokyo, Japan) arranged in a manner similar to that of a lead II configuration (two in the breastbone, and one in the left lower abdomen). Electrocardiogram data were digitized using a 12-bit A/D converter at a sampling rate of 1 kHz (MaP222A, NIHONSANTEKU Co., Ltd, Osaka, Japan) and collected via a notebook computer (T60, IBM Japan, Ltd., Tokyo, Japan).Spectral analysis was obtained using fast Fourier transformation (FFT) (MaP1060, NIHONSANTEKU Co., Ltd, Osaka, Japan). The FFT period gram was obtained by applying a linear interpolation and resampling with a sample frequency of 4 Hz. A Hanning window was applied in periods of 3 min, and the FFT algorithm was processed using 1,024 points. From the spectral estimates calculated by the FFT, the power was calculated in the low frequency range, 0.04–0.15 Hz (LF), and the high frequency, range 0.15–0.4 Hz (HF) [21].The fluctuation observed in the interbeat interval (IBI) was transformed into an ellipsoid distribution using Lorenz plot analysis. The program (MaP1060) calculated two components of IBI fluctuation based on Toichi et al.’s method [22]: the lengths of the longitudinal (L) and transverse (T) axes in the ellipsoid distribution were calculated. The Cardiac Vagal Index (CVI) was calculated as log 10 (L × T), and the Cardiac Sympathetic Index (CSI) was calculated as L/T [22].
3. Results
3.1. Subjective Pain
- A two-way repeated measures Analysis of Variance (ANOVA), with phase (before Rest and after Recovery) and AS group (high and low) as factors, was performed to examine subjective pain. The result showed a significant main effect of phase (F (1, 22) = 100.35, p < 0.05, ηp2 = 0.82) and no main effect of AS group. There were no interactions between phase and AS group. A Bonferroni correction revealed significantly higher subjective pain after Recovery (M = 2.88, SD = 1.33) compared with the period before Rest (M = 0.04, SD = 0.20); the effect size was strong (Cohen’s d = 2.99).
3.2. Fear of Pain
- ANOVA with the AS group (high and low) as factors, was performed to examine fear of pain. The results showed a significant main effect of AS group (F (1, 20) = 6.81, p < 0.05, ηp2 = 0.25). This result suggested that participants with high AS (M = 2.87, SD = 2.23) experienced greater fear of pain relative to those with low AS (M = 0.89, SD = 1.05); the effect size was strong (Cohen’s d = 1.05).
3.3. Autonomic Nervous Response
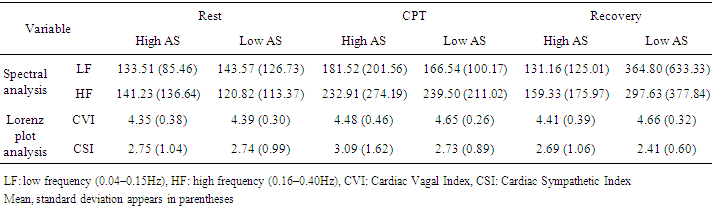
- A two-way ANOVA, with AS group (high and low) and phase (Rest, CP, and Recovery) as factors, was performed to analyze the LF, HF, CVI, and CSI values (Table 2). A Greenhouse-Geisser correction for sphericity violation was used where necessary.
|
4. Discussion
4.1. Subjective Pain (Sensory Perception)
- Previous studies [12, 15] reported that participants with high AS, relative to those with low AS, experienced more pain when they submerged their hands in the cold water. Thus, although the CPT procedure in our study had evoked sufficient subjective pain, there was no difference between the high- and low-AS groups in the subjective pain they experienced. This inconsistency between findings of previous studies [12, 15] and our results may owe to the use of different time points of subjective pain evaluation. In previous studies [12, 15], participants were required to evaluate their pain immediately subsequent to completing the CPT, while participants in the present study evaluated their subjective pain based on their memories after completing the Recovery phase (approximately 3 min later). The reason for the delay was that we sought to evaluate autonomic nervous response in the Recovery phase. Therefore, our results indicate that AS did not exert a sustainable effect on subjective pain that arose acutely.
4.2. Fear of Pain (Psychological Response)
- Our results showed that participants with high AS experienced more fear relative to those with low AS, even after the Recovery phase. Asmundson and Taylor [23] reported a relationship between high AS and fear of pain in individuals with chronic pain. High AS was also associated with fear of acute pain. Imai et al. [15] reported that the extent of AS experienced did not affect fear of acute pain induced by the CPT. However, Imai et al. [15] also noted that the participants in their study were permitted to remove their hands from the cold water when they could no longer endure the pain; therefore, the CPT in their study [15] did not evoke fear of pain. In contrast, the requirement for participants in the present study to submerge one hand in water for 3 min was sufficient to evoke fear of pain.
4.3. Autonomic Nervous Response
- As mentioned in the introduction, the CPT evokes a parasympathetic nervous response [1]. Our result indicated that spectral analysis did not detect changes in autonomic nervous responses in the CPT. By contrast, Lorenz plot analysis revealed that a parasympathetic nervous response (CVI) was evoked during the CPT and Recovery phases in the low-AS group. Tidal volume and minute ventilation of participants is known to increase significantly during the CPT [5]. Therefore, if using spectral analysis for HRV during the CPT, it is necessary for participants to control their breathing at a constant rate and depth [24]. Because it was difficult for participants to control their breathing in the CPT, we did not ask them to do so. Thus, our LF results may have been contaminated by RSA. On the other hand, Lorenz plot analysis does not require respiration to be controlled [11], and can therefore be used to evaluate the parasympathetic nervous response in the CPT without being influence by changes in respiration.Keogh and Birkby [12] speculated that physiological responses would not differ between participants with high and low AS. Our results indicated that participants with low AS demonstrated an increased parasympathetic nervous response (CVI) in the CPT and Recovery phases, while the values remained unchanged throughout all phases in participants with high AS. Our results contradict previous studies [5-8] of autonomic nervous responses in the CPT, perhaps due in part to the influence of AS.Because of the fact that we measured through the Recovery phase, it was possible to see the effects of the parasympathetic activity after the CPT. Generally, in the Recovery phase, activation of parasympathetic nervous responses should raise the lowered skin temperature. However, our results indicated that the parasympathetic nervous response (CVI) was not evoked even in Recovery phases in participants with high AS. We inferred that the participants with high AS ruminated on the experience of fear (induced by the CPT) in the Recovery phase, and this rumination increased their fear. In fact, participants with high AS experienced more fear of pain. It is likely that reminiscence (i.e., fear of pain) inhibited parasympathetic system activity in the Recovery phase.
4.4. Limitations of the Study
- One limitation is that the difference in the Anxiety Sensitivity Index score between the high- and low-AS groups was small. This is as expected, given that we recruited healthy college students who are unlikely to be highly susceptible to anxiety. A future study that includes a clinical sample is needed. A second limitation is our study’s small sample size (n = 24). The sample size of previous studies [5-7, 12, 15] were larger than our study (n = 31–93). However, the difference between the CVI value in the CPT and the Recovery phases between high- and low-AS groups had a moderate effect size (Cohen’s d > 0.47). Therefore, the findings in this study were unlikely to have occurred by chance.
5. Conclusions
- According to our results, Lorenz plot analysis is appropriate for investigating the autonomic nervous response during the CPT. In order to examine the changes in the autonomic nervous response by induced CPT, it is necessary to observe not only the CPT phase but also the Recovery phase.
ACKNOWLEDGEMENTS
- We wish to express our thanks to Yuko Miyamoto for her help with data collection. This work was supported by JSPS KAKENHI Grant Number 19730447.