-
Paper Information
- Paper Submission
-
Journal Information
- About This Journal
- Editorial Board
- Current Issue
- Archive
- Author Guidelines
- Contact Us
International Journal of Psychology and Behavioral Sciences
p-ISSN: 2163-1948 e-ISSN: 2163-1956
2015; 5(3): 121-127
doi:10.5923/j.ijpbs.20150503.03
Determinants of Freshman CGPA: High School Result, Entrance Exam Result and EGSECE GPA
 Abstract
 Reference
 Full-Text PDF
 Full-text HTML
Yoseph Shumi Robi
Department of Education, College of Teacher Education, Kotebe University College, Addis Ababa, Ethiopia
Correspondence to: Yoseph Shumi Robi, Department of Education, College of Teacher Education, Kotebe University College, Addis Ababa, Ethiopia.
| Email: |  |
Copyright © 2015 Scientific & Academic Publishing. All Rights Reserved.
The primary purpose of this study was to determine the degree to which high school result, entrance exam result and EGSECE GPA predict freshman CGPA in KUC. From a total of 733(370 males and 363 females) pre-service diploma teacher education program students who were admitted to the KUC in 2013/14, 533 (269 males and 264 females) were selected using stratified sampling technique. High school result, entrance exam result, EGSECE GPA and freshman CGPA of these students were collected from the Registrar Office of KUC. Correlation and regression analyses were employed on the data. The results indicated that high school result, entrance exam result, EGSECE GPA in order as selection instruments appeared to be valid predictors and determinants of freshman CGPA for 2013/14 academic year entrants and jointly accounted for 41.40 percent of the variation in freshman college performance. On the basis of their predictive ability, high school result was found out to be more important than entrance exam result and EGSECE GPA as an admission variable. High school result was also found out to be more significant variable for male and female students. Based on these findings, the practical implications of the study to the country’s system of education in general and its college admission criteria in particular were discussed.
Keywords: Determinants, Predictive Validity, Selection Criteria, Criterion Measure
Cite this paper: Yoseph Shumi Robi, Determinants of Freshman CGPA: High School Result, Entrance Exam Result and EGSECE GPA, International Journal of Psychology and Behavioral Sciences, Vol. 5 No. 3, 2015, pp. 121-127. doi: 10.5923/j.ijpbs.20150503.03.
Article Outline
1. Introduction
- New student selection is one of the most important regular activities in higher learning institutions. Many higher learning institutions select prospective students of their program based on a set of their own admission requirements. The selection criteria they usually consider include the applicants’ potentials to succeed in their studies, the economic need of the society, the spaces available in the program offering institutions and the like ([1]; [2]).Therefore, the main goal of their admission criteria is to identify students who can successfully complete the study program they are supposed to attend and further address the needs of the society in their future careers as professional. Thus, the value of selection criteria can be assessed by the degree to which such objectives are fulfilled. In fact, such an assessment should not be expected to be done at once, but rather as a continuing and systematic evaluation of the selection techniques ([3]; [4]).Applicants for college admission should be typically selected based on several variables, which are used as predictors of their potential to perform successfully in training program ([5]). This is to reveal that when certain variables are used as predictors in selection process a significant relationship should be made between those predictor variables and the criterion variable, which measure the training performance. Accordingly, questions about the adequacy of predictor variables for the purpose they serve are answerable on scientific grounds by evaluating psychometric evidence ([6]; [7]). Most of the predictor variables in selection of students for higher institutions are based on cognitive variables such as test scores, high school average score, entrance examination and the like. Predictive validity studies have been conducted in different corner of the world on some of these selection criteria. It was found that high school results and test scores were the most important predictors of college performance (e.g.; [8]; [9]; [10]). Besides, the combination of high school results and test scores yield somewhat better prediction than either taken alone ([1]; [11]; [12]).In the words of [13], the mission of teacher education programs is to identify and prepare effective teachers. Attempting to assure quality in the graduates of teacher education programs is equally as pressing as predicting the effectiveness of a particular teacher in a particular job setting. Substantiating the above idea, [14] comments, on the quality of teacher education and training in Ethiopia as follows:…. if we want the best teachers available, then a first step is to recruit into training those who already have the best range of relevant attributes and abilities and that these include considerably more than the narrowly academic ability which tends to dominate the usual selection procedures (p.363).[14] emphasizes the usefulness of considering various criteria while recruiting students for college of teacher education.Of the various criteria suggested, KUC recruits students for the 10+3 diploma teacher education pre-service program using three selection criteria quantified as follows- Ethiopian General Secondary Education Certificate Examination /EGSECE GPA (with 20% weight), entrance exam result (with 35% weight) and high school result (with 45% weight). The Ministry of Education of the Federal Democratic Republic of Ethiopia has changed the curriculum of pre-service 10+3 diploma teacher education program since 2013/14 with the aim of filling gaps students have in secondary education using bridging courses to be offered in freshman year college program.Hitherto no study has been made that determine the degree of relationships between high school result, entrance exam result, EGSECE GPA with freshman CGPA in KUC. That is why the investigator is initiated to assess whether or not the criteria (i.e., high school result, entrance exam result, EGSECE GPA) set by AACAEB (Addis Ababa City Administration Education Bureau) and KUC (Kotebe University College) to admit students to diploma program really predict first year academic success in KUC.The primary purpose of this study, therefore, is to determine the degree to which high school result, entrance exam result, EGSECE GPA predict freshman academic performance in college. Based on this purpose, an attempt was made to answer the following basic questions.1. Is there a statistically significant relationship between high school result, entrance exam result, EGSECE GPA and freshman CGPA in college study?2. Do the high school result, entrance exam result, EGSECE GPA collectively have significant contribution to the prediction of freshman college performance?3. Which one of the predictor variables is the most important in explaining the variation in freshman CGPA in college study?4. Do the predictor variables have different predictive values for male and female students?According to their usage in this study the following terms are defined in the manner stated below.• EGSECE GPA refers to the average of the scores in seven subjects where mathematics and English are compulsory and minimum of C grade.• High school result refers to the overall average score of the averages of each of grades 9 and 10 scores.
2. Methods
2.1. Subjects
- The subjects of this study were diploma pre-service program students who were admitted to the university college in 2013/14 academic year. A total of 733 students were admitted to the KUC. Out of 733 (370 males and 363 females) students, 533 (269 males and 264 females) were selected using stratified sampling technique.
2.2. Variables
- The predictor variables were high school result, entrance exam result, EGSECE GPA of 2013/14 regular diploma program entrants of KUC. For statistical purposes, the independent variables were identified by the following symbols: X1 = high school result, X2 = entrance exam result and X3 = EGSECE GPA. The criterion measure used was student's first year cumulative grade point average in the college exam. Thus, the dependent variable was a two semester CGPA at KUC in the 2013/14 academic year.
2.3. Procedure
- Permission to have access to the academic performance records of students admitted in 2013/14 was obtained from the KUC authorities. Then, the researcher collected high school result, entrance exam result, EGSECE GPA and freshman CGPA from the Registrar Office of KUC.
2.4. Data Analysis
- Descriptive statistics such as means and standard deviations were computed to describe the average score and variability of scores. This was followed by analysis of relationships among variables. Using the Pearson product moment method, correlation coefficients were computed to see the relationships among variables. In addition, multiple regression analysis was conducted to see the contribution of predictor variables for the variations on the criterion measure. Following the regression analysis, stepwise regression analysis was employed to identify and select the predictor variable that best explains the variation in the criterion variable. The above analyses were carried out using SPSS version 20.
3. Results
3.1. Descriptive Statistics and Correlation Matrix
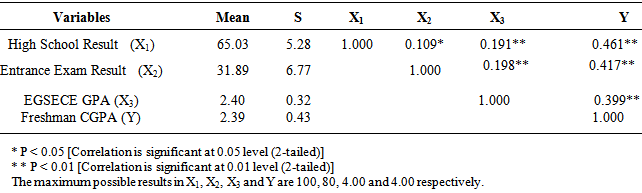
- The first research question was concerned with assessing the extent of relationships between high school result, entrance exam result, EGSECE GPA to freshman CGPA. Accordingly, the results of the study in this regard are summarized in Table 1.
|
3.2. Multiple Regression Analysis
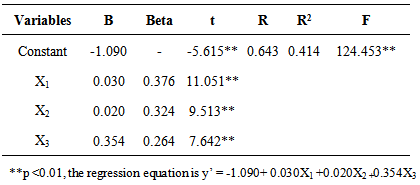
- The second research question was concerned with determining the combined contribution of the predictor variables together to the prediction freshman CGPA. For this purpose, a multiple regression analysis was carried out. The results are presented in Table 2.
|
3.3. Stepwise Regression Analysis
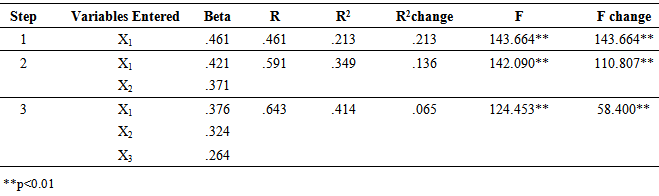
- The third research question was concerned with identifying the predictor variable that was the most important in explaining the variation in freshman CGPA. In order to answer this question, a stepwise regression analysis was employed. The results are presented in Table 3.
|
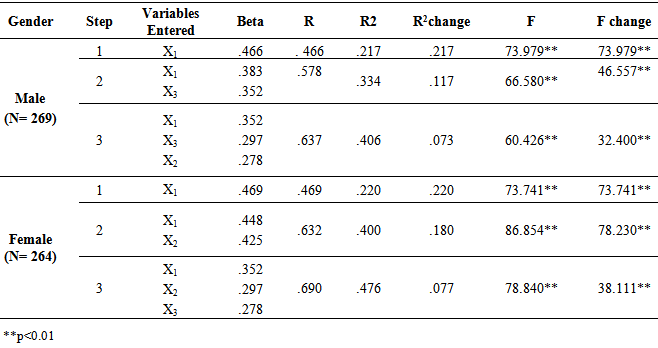
3.4. Multiple Regression Analyses for Male and Female Students
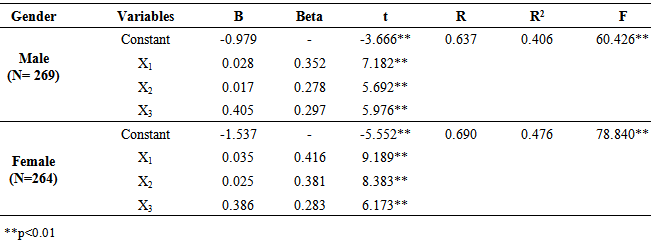
- The fourth research question was concerned with comparing the predictive values of the predictor variables for male and female students. For this purpose, multiple regression analyses were employed. The results are shown in Table 4.
|
3.5. Stepwise Regression Analyses for Male and Female Students
- The stepwise multiple regression analyses were employed to identify and select the predictor variable that explains more variation in the criterion measure for male and female students. The results are presented in Table 5.
|
4. Discussion
- Regarding the first two research questions, the findings revealed significant relationships between predictor variables and freshman CGPA. As the computation of correlations among variables showed (Table 1), the predictor variables (high school result, entrance exam result and EGSECE GPA) are significantly related to the freshman CGPA independently. In addition to the correlation analysis, multiple regression analysis (Table 2) was worked out and it revealed that the predictor variables together made a significant contribution in the prediction of freshman CGPA, R = 0.643, R2 = 0.414, F (3,529) = 124.453, p < 0.01. The study indicates that high school result, entrance exam result and EGSECE GPA appeared to be important and significant variables in determining freshman CGPA. Thus, the admission measures, which were used in 2013/14 academic year by KUC, were found to be significant predictor freshman CGPA.Truly, this finding is not the first of its kind since there are some studies that reported similar findings. For example, the study done by [15] reported that preparatory school average score, university entrance exam result and aptitude scores appeared to be statistically significant predictors of first semester GPA of the students at Adama University.The result of this study revealed that 41.40 percent of the variance in freshman CGPA was accounted for by variation in high school result, entrance exam result and EGSECE GPA. What this means is that about 58.60 percent of variance remains unexplained. The possible explanations for such large unexplained variance in freshman CGPA may be due to the fact that other factors such as achievement motivation, study habit and specific content background affect performance in college ([4]). Besides, researchers (e.g., [16]; [17]) indicate that non cognitive variables such as these play an important role in determining students' success in educational activities. Similarly, [11] state that there are many other factors that affect students’ undergraduate experience after admission, such as financial aid, social support and academic engagement in college.The third research question that is to be answered in this study was identifying the predictor variable that is more important in explaining the variation in freshman CGPA. In order to answer this question, step-wise regression analysis was used. The results of the stepwise regression analysis (Table 3) revealed that high school result was found to be the most important variable in explaining the variation in freshman CGPA. High school result alone accounted for 21.30 percent of the variance on the first year CGPA, R2 = 0.213, F (1, 531) = 143.664, p < 0.01. This means that students who performed better in high school also performed better in college. Probably these students had the potential to cope with the academic atmosphere in college more easily than others. This may also imply the relevance of the content being taught in high school in preparing students for college.The result that high school result is the most important variable in explaining the variation in college performance goes along with the results of the previous studies (e.g., [15]; [18]; [18]; [20]; [21]), which suggest that high school result is the most important and significant variable in predicting students' ability to succeed in higher learning institutions than other variables. According to [8]and [12], there are frequent cases in which high school achievement predicted first year grades better than scholastic achievement or aptitude tests. This would not be surprising because high school performance is a work sample of college performance ([22]). Furthermore, high school average scores are rather based on performance over a period of time rather than on one-shot evaluation.The second variable that entered the regression model was entrance exam result, R2 = 0.349, F (2,530) = 142.090, p < 0.01. This means when entrance exam result was added, R2 was increased to 0.349. The change in R2 due to entrance exam result is significant, change in R2 = 0.136, F (1, 530) = 110.807, p < 0.01. When entrance exam result entered, the prediction of freshman CGPA has improved by 13.60 percent. The third variable that entered the regression model was EGSECE GPA, R2 = 0.414, F (3, 529) = 124.453, P < 0.01]. This means when EGSECE GPA was added, R2 was increased to 0.414. This variable, next to high school average score and entrance exam result, is found to play important role in the variation of freshman CGPA. This is confirmed by the fact that the change in R2 due to EGSECE GPA is significant, change in R2 = 0.065, F (1, 529) = 58.400, P< 0.01. When EGSECE GPA entered, the prediction of freshman college CGPA has improved by 6.50 percent. This finding is consistent with the result reported by [11]. They stated that significant correlations were observed between college GPA with high school GPA (r = 0.31, p < 0.01), SAT II (r = 0.14, p < 0.01), and SAT I (r = 0.07, p < 0.01). The possible explanation why EGSECE GPA contributed less to the prediction of college CGPA could be that this exam is a one shot examination. It is administered every year at one specific moment. Apparently, such examination is susceptible to factors that can distort students’ true score. Among others, cheating and examination anxiety during examination can be mentioned.As it is indicated above, it is not entrance exam result or EGSECE GPA, but high school result that accounts for the lion’s share of the explained variance in freshman CGPA. According to [11], one hypothesis is that may account for the high school result to predict college CGPA may be “method covariance,” or the methodological similarity in the way these academic indicators are constructed. That is, both high school result and college CGPA reflect student performance in a large number of courses taken over a period of time. Both measures are based on similar kinds of academic experiences - term papers, quizzes, labs, end - of - course examinations so that it should not be surprising that prior performance on these kinds of academic tasks tends to be predictive of later performance.The fourth research question to be answered in this study was comparing the predictive values of the predictor variables for male and female students. The inspection of the results in Table 4 and Table 5 indicate that the amount of variance accounted by the linear combination of the three predictor variables (high school result, entrance exam result and EGSECE GPA) for male and female students are 40.60 percent and 47.60 percent respectively. This shows that there is a difference in the proportion of explained variance of the criterion measure accounted for by the linear combination of the three predictor variables for male and female students. On the other hand, high school result (X1) was the most important predictor variable in explaining the variation in freshman CGPA for both male and female students. This finding coincides with the study conducted by [15].Nevertheless, this study is not free of limitations. Especially the following limitations should be taken into account before any form of generalization can be made of the result of the study. First, as the study was confined to one college, the results may not necessarily apply to students in other colleges. Second, this study focused on some potential determinants variables affecting performance at college. Non cognitive, institutional and environmental variables that play important role in the prediction of college success (e.g., [16]; [17]; [4]) were not considered. Third, it is known that correlation coefficient is based on the reliability and validity of scores on predictor and criterion variables ([23]). However, there are some defects on the psychometric quality of the tests used by higher learning institutions. This study like other predictive validity studies, shares this problem. Therefore, to interpret validity data correctly, it is necessary to be aware of this problem.
5. Conclusions
- Based on the results of this study, it may be possible to arrive at the following conclusions. • High school result, entrance exam result and EGSECE GPA appear to be valid predictors of freshman CGPA. This means the predictor variables play important role in determining students’ success in college learning. • High school result is found out to be the most valid predictor of freshman CGPA than entrance exam result and EGSECE GPA.• The combination of the three variables is found to be statistically significant to predict first year academic performance of college students.• Gender difference was observed in this study. The predictor variables explained more of the variance in freshman CGPA for female than for male students. This implies that predictor variables are stronger for predicting freshman CGPA for females than for males.The results of this study seem to have some practical implications to the selection criteria of pre-service diploma teacher education program of the country and future direction of research. High school result was found to be more influential in determining freshman CGPA than entrance exam result and EGSECE GPA. Thus, it would be better to consider the selection criteria on the basis of their importance during admission process. It would also be better to arrange special educational support programs for students with low high school result, entrance exam result and EGSECE GPA. Lastly, it would also be useful to conduct further study to identify the determinants of college academic performance in other colleges in Ethiopia along non cognitive variables such as achievement motivation and study habit. Additional research on this issue will help in explaining the variation in freshman CGPA.
ACKNOWLEDGEMENTS
- I wish to express my thanks to Kotebe University College for allowing me to carry out the study. I would also like to thank the two anonymous reviewers for their constructive comments and my colleague Ato Daniel Zewdie, College of Teacher Education, Kotebe University College for reading and commenting on the earlier version of this article.