-
Paper Information
- Next Paper
- Paper Submission
-
Journal Information
- About This Journal
- Editorial Board
- Current Issue
- Archive
- Author Guidelines
- Contact Us
International Journal of Psychology and Behavioral Sciences
p-ISSN: 2163-1948 e-ISSN: 2163-1956
2014; 4(1): 16-20
doi:10.5923/j.ijpbs.20140401.03
A Sense of Belonging in a University Community: A Study of Undergraduate Students
 Abstract
 Reference
 Full-Text PDF
 Full-text HTML
Krafona K.
University of Cape Coast, Department of Educational Foundations, Ghana
Correspondence to: Krafona K., University of Cape Coast, Department of Educational Foundations, Ghana.
| Email: |  |
Copyright © 2012 Scientific & Academic Publishing. All Rights Reserved.
A good learning environment requires, among other things, a healthy and vibrant community in which all members feel they belong, can address all their social, spiritual and learning needs and can also feel proud about and own it. The purpose of the study was to investigate the extent to which students felt they belonged to the university and also determine the utility of the sense of community index instrument in this population. The original 12-item sense of community index developed by Perkins, Florin, Rich, Wandersman & Chavis was used. The results indicated: 1) a low sense of belonging, 2) a weak internal consistency of the scale r = .63 and 3) a two-factor structure. The findings are discussed in relation to the students’ perception of what their involvement in university administration should be, the nature of the scale itself and the sample in general. A major limitation is that only a small set of students from one department was involved and therefore caution should be exercised in its interpretation and generalisation. A need for future work is delineated.
Keywords: Sense of belonging, Sense of community index, University community
Cite this paper: Krafona K., A Sense of Belonging in a University Community: A Study of Undergraduate Students, International Journal of Psychology and Behavioral Sciences, Vol. 4 No. 1, 2014, pp. 16-20. doi: 10.5923/j.ijpbs.20140401.03.
Article Outline
1. Introduction
- A good learning environment requires, among other things, a healthy and vibrant community in which all members feel a sense of belonging, can address all their social, spiritual and learning needs and can also feel proud about and own it. Such an environment has the potential to generate cohesiveness, co-operation, as well as trust and also foster positive growth and problem solving ability. This sense of community has been described as “the sense that one was part of a readily available, mutually supportive network of relationships upon which one could depend and as a result of which one did not experience sustained feelings of loneliness”[1]. It was this important step in the development of community that the concept sense of community has become such an important issue, although hitherto a number of people had expressed views about what community meant. Nevertheless that important contribution has enriched the community psychology perspective to the extent that theories and scales of measurement have been developed to assess sense of community. One central theory leading to development of sense of community is the one by McMillan and Chavis[2]. Four elements of McMillan and Chavis’ theory are membership, fulfillment of needs, Influence and Emotional connections. Out of the theory, the sense of community scale was developed by Perkins, Florin, Rich, Wandersman, & Chavis[3] and it was made up of 12 items with true/false dichotomous responses. The original scale has, however, been revised using a 4-point Likert scale since it had a number of criticisms and also studies found it difficult to confirm the four factors involved. Other questionnaires have been developed for use in areas such as residential community research and consultation[4, 5, 6, 7, 8], work settings[9, 10] and educational settings[11, 12]. Assumptions about similarities with regard to geographical and relational communities have been cautioned[13], but other researchers have also found such similarities to be relevant[14]. There are limitations to these questionnaires and survey techniques in terms of the external and conceptual validity of the data they generate. Whichever measure is used its interpretation is restricted by the lack of norms. But what precisely is a learning community? Rovai, Wighting, and Lucking theorize that a sense of community in an educational setting includes two underlying dimensions - social community and learning community [15]. Social community represents the feelings of the community of students regarding their spirit, cohesion, trust, safety, interactivity, interdependence, and sense of belonging. Learning community consists of the feelings of community members regarding the degree to which they share group norms and values and the extent to which their educational goals and expectations are satisfied by group membership. Mitchell and Sackney define a learning community as “a group of people who take an active, reflective, collaborative, learning-oriented and growth - promoting approach towards the mysteries, problems and perplexities of teaching and learning”[16]. Tinto’s view is that a learning community should provide academic, social, and personal support[17]. This support ought to be accessible and should add to the general experience of the student. Beneficial educational outcomes are also supported by Astin’s theory of involvement, which suggests that students learn more when they are more involved in both the academic and social aspects of the school experience[18]. Consequently, learning has important social and cognitive dimensions and occurs most effectively when the school provides a positive social environment with a strong sense of community.Lounsbury and DeNeui transformed the Sense of Community Index by Chavis and Newbrough into the Campus Atmosphere Scale[19, 20]. The Campus Atmosphere Scale, using the psychological sense of community (PSC) concept, showed that students who experience higher levels of PSC actually persist longer at their institution than those with lower levels of PSC. This was particularly observed among fraternity/sorority members, private school undergraduates, students living on campus, out–of–state residents, on-campus workers, seniors, and females[19, 12]. What is absent from all this is whether the learning environment provides accommodation for all its students to the extent that they feel comfortable and at ease to study. Many of the public universities in Ghana adopted a policy of providing accommodation for the first year in the university after which students had to find their own accommodation elsewhere. The University of Cape Coast in Ghana, where this study was conducted, still operates this policy and continuing students find themselves in hostels or other private accommodation in and around the university neighbourhood. The financial consequences both in terms of rent and transport can impact on their ability to make full use of the university atmosphere; their security outside the university is also not guaranteed. They may also find socializing and participation in other extracurricular activities after lectures difficult as they would have to rush for transport to go to their various hostels and accommodation. Although a university or academic environment may not necessarily reflect a lifestyle in a rural/urban environment, people invariably expect some kind of fraternal and supportive environment in all aspects of life when they leave their original homes. In other words, the university or academic environment could be seen as a microcosm of the larger community or society.The purpose of this study therefore was three-fold: 1) to determine the reliability of the SCI scale in this particular culturally different group, 2) to determine whether students have a sense of belonging in their university, and 3) to determine whether the theoretical four-factor structure applies to this group of students.
2. Methodology
2.1. Participants
- Undergraduate psychology students numbered 301 were the study population and they were chosen based on the fact that they had been in the university longer. Out of that number, 216 were randomly selected. They were made up of 132 males and 84 females aged between 19 and 45 years old (M = 23.87, SD = 3.26). All the participants were in their penultimate year of undergraduate studies. English is the medium of instruction for the participants and therefore there was no need to translate the questionnaire. The data collection was done in November 2011.
2.2. Instrument and Procedure
- The Sense of Community Index scale which consists of 12 questions to be answered as True/False was used. Since the scale was being used in a university, the word “community” was replaced with “university.” Examples of some of the items on the scale are: “I think my university is a good place for me to live,” and “I feel at home in this university.” Items 2, 6, 8 and 11 are reverse scored. The maximum total score is 12.The internal consistency of the scale has been found to be low and the four-factor structure has also not been supported in previous studies. Chipuer and Pretty reported overall alphas ranging from .64 to .69 and subscale alphas ranging from .16 to .72.[22]
2.3. Data Analysis
- The Statistical Package for Service Solutions (SPSS) version 16 was used for the analysis of data. Internal consistency was performed to determine the robustness of the inventory. Exploratory factor analysis using principal axis factoring with oblique (promax) rotation was employed.
3. Results
3.1. Internal Consistency
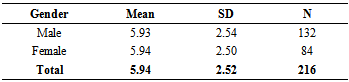
- The coefficient alpha for the SCI scale in this study was .63 and indicates a moderate degree of internal consistency although it does not reach the magical .70 level. It has been suggested that alpha values of between .70 and .75 indicate that the scale has a high internal consistency and is useful for research[23, 24].Table 1 reports the means and standard deviations for gender and total score for the participants.
|
3.2. Item-total Correlations
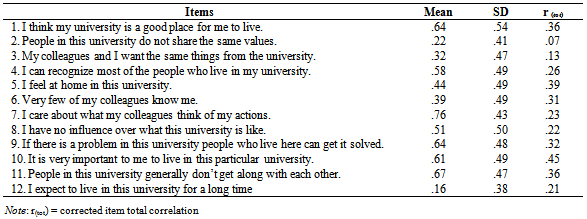
- The means, standard deviations and corrected item-total correlations of the SCI scale are presented on table 2.
|
3.3. Factor Analysis of the Sense of Community Index
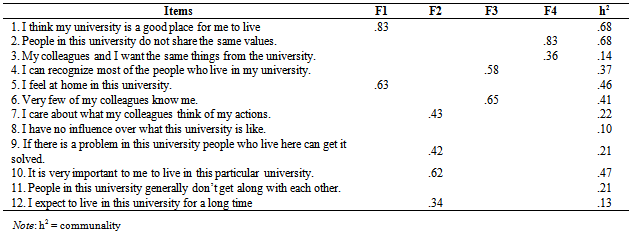
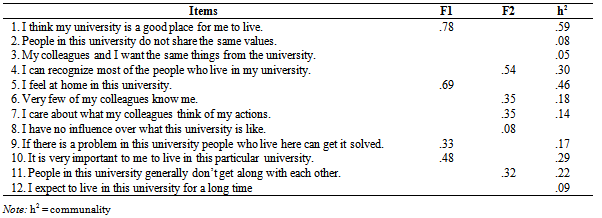
- To determine the factor structure for the SCI in this study, principal axis factoring with oblique (promax) rotation was performed. First, the Kaiser-Meyer-Olkin (KMO) sampling adequacy was performed and a score of .66 was obtained which was just a little above the minimum recommended value of .6. The Bartlett’s Test of Sphericity was significant (X2 = 318.71 df = 66, p <.001) and thus allowing for factor analysis of the scale to be performed.Table 3 describes the factor loadings of the items. A series of extractions were made using eigenvalues greater than 1 but there were a number of cross-loadings with some factors containing only 1 item. Initially, four and three factors were extracted but did not offer easy interpretation even when loadings less than .3 and .4 were suppressed.
|
|
4. Discussion
- The purpose of this study was to determine the reliability of the scale in the Ghanaian context, to determine whether students feel they belong to the university and also to examine the theoretical structure of the construct sense of belonging using the sense of community index scale (SCI) scale.Regarding the internal consistency of the scale in its original 12-item form with dichotomous responses, the Cronbach coefficient alpha has ranged between .64 and .69 [11]. In this particular study, the Cronbach coefficient alpha of .63 seems consistent with that of Chipuer and Pretty. It is likely that forced-choice responses make it difficult to express a wider view on a concept such as sense of community.The mean score of the scale as reported by the students was low indicating that they did not feel they belong to the university environment. There was no significant difference between the female and male students. It is however important to note that there are no norms for the scale and therefore not easy to make comparisons. Possible reasons for the low scores could be that after the first year of on-campus stay, they find their own accommodation elsewhere outside or in some cases in hostels located within the campus but without affiliation to any particular hall of residence. Lack of security and personal safety, water shortages and power cuts outside campus, inability to make full use of the various libraries on campus as well as difficulty accessing academic information from other colleagues so that they could make changes to their schedules, if necessary, could all contribute to the low scores. It could also be that they do not feel their suggestions for the running of the university are taken on board and therefore feel alienated. This will then make learning a difficult one for them. In places where students felt they belonged to their university, they were more likely to stay longer and get on well with their academic work[19].The theoretical four-factor structure of the scale was not supported as only a two-factor structure was revealed in the study. Many studies have not been able to support the theoretical dimensions[24, 25, 26] using the original scale. Even when the scale has been modified by using Likert type scale responses and changing or replacing some of the original items some studies have managed with only three dimensions[25]. But it is also interesting to note that even in the three dimensional structure reported by Long and Perkins only two items loaded onto a third factor, a practice that is not recommended by Costello and Osborne. The meanings attached to items may be important to look at from cultural perspective. What is interpreted as membership could be described differently in another culture. Comparisons of item loadings have been made by Obst et al and for example item 11 which deals with emotional connection in the original scale is classified as membership by Obst et al. A look at the factor structures in this study gives examples of where the same item could be interpreted differently. For example, in this study, factor I has items that relate to all four factors in the original scale but the item with highest loading is Needs fulfilment. Similarly, factor II has items that relate to each of the four original factors. One interpretation could be that it is possible this group of students sees their university community as mainly having their academic needs fulfilled without exercising any influence since decisions about university administration in general are possibly taken at a different level. If that were to be the case, a learning environment could not be seen as one fulfilling spiritual and social needs. In the original factor loadings, items 7, 8 and 9 were labelled as constituting influence. In this study, item 8 simply failed to load onto any of the factors and, secondly items 7 and 9 had weak loadings[27]. That could also explain why they do not have much emotional connection to it as only two of the three items for emotional connection loading with item 11 loaded poorly. Thus, they may be saying we are here to study and graduate with certificates. This has implications for future participation in alumni activities. It may also suggest that they have unaddressed stress and anxiety factors. For example, many students are faced with financial pressures and have little means of meeting their needs, at least in this part of the world. Although the university has a counselling centre that students can access, they seem not to be making full use of such facility. Culturally, financial support is important in times of difficulty. Without such support, a sense of belonging may mean very little to people from a cultural perspective. Communal living is all embracing to the extent that financial as well as social support, feature strongly in all aspects of life in this part of the world. It is important however to mention that the study was limited to only third year psychology students and could not be seen as representing the general view of the whole student population and as such should be interpreted cautiously. A bigger study involving all sectors of the student population may be useful. Secondly, it may be useful to adopt an interval scale like the Likert for future studies in order to improve on the reliability of the instrument.