Vladimir L. Gavrikov 1, Rem G. Khlebopros 2
1Department of Biology, Geography and Chemistry, V.P.Astafiev Krasnoyarsk State Pedagogical University, Krasnoyarsk, 660049, 89, A.Lebedeva St., Russia
2Institute of Economics, Management and Environmental Studies, Siberian Federal University, Krasnoyarsk, 660041, 79, Svobodny Prospect, Russia
Correspondence to: Vladimir L. Gavrikov , Department of Biology, Geography and Chemistry, V.P.Astafiev Krasnoyarsk State Pedagogical University, Krasnoyarsk, 660049, 89, A.Lebedeva St., Russia.
| Email: |  |
Copyright © 2012 Scientific & Academic Publishing. All Rights Reserved.
Abstract
In this study, we analysed an experience-based learning process in which participants received immediate feedback information as a reaction to right choices and to mistakes made. Information was measured as non-randomness in the distributions of right and wrong choices. The data obtained provide evidence that the majority of the participants could use both positive and negative information while learning. A small but conspicuous proportion of the participants could learn exclusively through the use of negative feedback information, i.e., through their own mistakes.
Keywords:
Experience-Based Learning, Shannonian Information, Research Problem
1. Introduction
The role of negative experience in learning has been a topic of numerous research studies. One of the most studied areas in this research field stems from the Rescorla-Wagner model by Robert Rescorla and Allan Wagner[1]. They studied Pavlovian conditioning and suggested a frequently cited model to describe experimental data: | (1) |
where ΔVA stands for changes in the associative strength of the reaction to the stimulus A in the presence of a compound stimulus AX, with λ1 being an asymptote of associative strength and αA,β1 being learning rate parameters. This formula (1) is often referred to as a model of “error-driven learning”. It should be noted, however, that Rescorla and Wagner themselves never interpreted the disparity between λ1 and VAX as a measure of any errors, never discussed the very concept of “error-driven learning” and never even used the notion “error” in the work. The absence of this notion in their theory is quite reasonable because in Pavlovian conditioning, which was the research subject, there is no place for errors. It would be quite inadequate to say that a dog that does not salivate upon hearing a bell sound “makes an error”.Many followers of the work by Rescorla and Wagner (e.g.,[2],[3]) have extrapolated on the topic of category learning in which the concept of “error-driven learning” looks quite relevant and fruitful. Also, the concept is used in mathematical linguistics[4] where the number of errors is a measure of correctly capturing information in the course of natural language processing. Important achievements have been made in studies of error-driven learning using the modern techniques of EEG[5] and event-related potentials [6]. Some researchers speak of an “error-processing system” in which the system is “involved in detecting the fact that an error has occurred in a given task and in using that error information to improve performance at the task” ([5], pg. 680).However, we failed to find in the literature a clear definition of what "learning driven by errors" actually means. There is a general understanding thaterrors/mistakes may be noticed by subjects and used to improve their task performance, there are equations relating errors and performance (for review see[7]) but how errors combine to produce a progress were not reported.There is a large literature on machine learning exploring various methods of how to use mistakes to improve machine performance. But the term is mostly associated by default with error minimisation, not with understanding of a suggested task. For example, as applied in adaptive network studies, error-driven learning implies "learning to minimise the difference (i.e. the error) between a desired outcome and what the network actually produced"[8]. It seems still that minimising errors and learning are not completely the same.In the study presented, we prefer to use the term “mistake” rather than “error”. From our perspective, insufficient attention has been paid to the possibility that mistakes may not merely be wastes, which have to be minimised, but may play a more constructive role. Specifically, we address the question: Can humans learn from mistakes? That means that the mistakes may be used not just to avoid them but to understand and recognise a hidden pattern.Certainly, the answer to the question in simple contexts would be “yes”. For example, if we are speaking about learning not to touch sizzling hot surfaces or not to taste poisonous food, learning from mistakes is possible. In these examples, the consequences would be enough to minimise mistaken actions. But humans are often challenged by complex learning situations that demand abstract thinking and differentiation between what matters and what does not.If we go beyond the simple cases, the very definition of “to learn from mistakes” becomes less clear. A random trial as well as a purposeful search will both produce mistakes, but how can we discern the former from the latter and determine which mistakes will bring about a positive result?Both earlier ([9],[10]), and more recent (e.g.[11]) studies of classical reinforcement learning, as well as studies of animal cognition, use an experimental design in which a subject gains positive and negative experiences in the course of learning. The subject receives some kind of reward for approaching a goal and some sort of punishment is applied for straying from the goal. In terms of information theory, one may say that the subject receives positive or negative information. In other words, positive information is associated with correct actions of the learning individual, while negative information is associated with erroneous choices or behaviours, i.e., with mistakes made by the individual. The sum of the positive and negative information composes the total information flow of the learning process.The term “information” first appeared in the mathematical and technical sciences in the first half of the 20th century. However, the ideas about information penetrated rather quickly into more humanitarian spheres, such as intellect theories, learning theories, psychology, and behavioural sciences. The successful use of the concept of information in these scientific spheres will eventually depend on how well research succeeds in handling the problem of measuring information, which was masterfully shown as early as 1955 by George Miller[12]. If one were able to estimate the amount of information that comes with positive and negative experiences, it would be possible to compare the relative contribution of positive and negative information to learning and to the achievement of success.A number of methods for measuring information are widely known. Among them are methods by Ralph Hartley [13], Claude Shannon[14], and Andrey Kolmogorov[15]. One of the most popular approaches to measuring information is the probabilistic approach developed by Shannon, which is based on the idea that the quantity of information is the negative logarithm of the probability that some event will happen. The probabilistic approach allows one to estimate the information quantity in complicated systems in which events happen with a variety of probabilities. As follows from this idea, a less probable event bears more information. To apply the approach, researchers have to distinguish elementary events and to estimate their probabilities.In a paper by Gavrikov and Khlebopros[16], a kind of learning environment called a “research problem” has been suggested. A typical research problem includes the need to understand a principle of the functioning or logic of something that is not yet known. The research problem in our previous work included a method of problem solving that we called a “semi-binary dialogue”. The mode of such a dialogue allows for the division of the complicated learning process into elementary events, the estimation of the probabilities of these events and, in principle, the measurement of information. This learning environment stimulated what is referred to as experience-based learning.To answer the main question of the study, a few sub questions have to be considered. Does negative information carry a significant value per se? Does negative information constitute a larger or a smaller share of the learning process as compared with positive information? While learning, is it possible that individuals use only positive or only negative information? We hypothesize that at least some individuals would be capable of using the negative information to solve problems within an interactive environment.
2. Method
2.1. Learning Environment
A computer-based technique used in this research was described in detail in[13]. Here we give an idea of the method, as well as a description of the approach used to estimate information, which was not described in the previous work.A learning environment was provided by an interactive computer program (called RWR - right/wrong responder) available on the Internet. The program consecutively presented to participants sets of nine geometrical figures in the form of a three by three matrix (Figure 1). The geometrical figures were circles, squares, and triangles. Each of the figures had three grades of gray colour: light, medium, and dark. They also had three grades of size: small, medium, and large. Thus, the variety of figures consisted of 27 variants.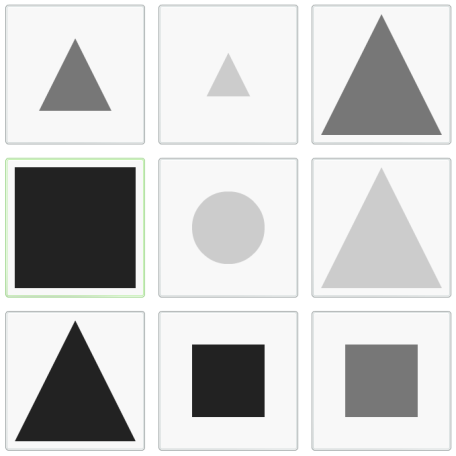 | Figure 1. A random sample of the matrix of figures |
The participants had to choose via mouse click any of the displayed figures. As a reply, the program communicated either “right choice” or “Wrong choice”. “Right” and “wrong” had a conventional meaning and were determined by a deterministic algorithm in the code. The algorithm was unknown to the participants and presented the following sequence: “small light gray figure” → “medium-sized medium gray figure” → “large dark gray figure” → “medium-sized medium gray figure” → “small light gray figure”, and so on. It was also unknown that neither the position in the matrix nor the shape of the figure itself was of any significance. In the case of a right choice, a new set of figures was displayed.The only instruction given to the participants before they began the test was that they should try to get only “right” responses. Therefore, the problem itself was first to differentiate between significant (size and colour) and non-significant (position and shape) features and then to grasp the sequence in which the right figures alternated. We considered those participants who made six right choices in succession to have successfully solved the problem, as had been indicated in the instructions. Our decision to use this particular technique was based on a number of considerations. Firstly, it gives to the participants enough freedom to show their best performance. Secondly, it has been found in preliminary trials that the technique possessed a sufficient discrimination power. It means that the problem was enough easy to allow a successful solution and enough hard to prevent a random success. Thirdly, the technique itself is flexible enough to allow further modifications as, e.g., use of words instead of graphic images.
2.2. Participants
The participants were students of the Institute of Economics, Management and Environmental Studies (Siberian Federal University, Russia). An assistant presented the program to the students in a regular computer class simply by giving them the Internet address of the program. The students who did not solve the task on their first attempt could continue working with the program on the Internet at any convenient time. It is important to mention that participating in the program and solving the problem were totally voluntary on the part of the students. As a reward for the participation, all the students received extra course credit.The students solved the problem in the spring semester of 2011. Altogether, 102 students took part in the study, but many of the protocols appeared to be unsuitable because they were too short. If a protocol was less than 90-100 clicks in length it was not possible to treat it statistically, and such protocols were discarded. The long enough data from 58 students was selected for further analysis. The successful solution was found in the protocols of 45 students, of which 40 successful attempts were taken for analysis and 5 were discarded due to inadequate length.The age of the students ranged from 20 to 21 years. Seventeen of them were male and 41 were female.
2.3. Measuring Information
The elementary events of learning in the study’s environment can be presented as a sequence of units and zeros of the sort “...1011100101000...”, where 1 stands for an error and 0 stands for a right choice. Each symbol in the sequence bears some information because it is a message from the program that represents its reaction to a human choice that has been consciously made. In this study, we analysed the positive information, i.e., the sequences of “right” messages, as well as the negative information, i.e., the sequences of “wrong” messages.A random procedure gathered the figures into one set, and each set contained at least one, and sometimes more, right figures, but with lower probability. On average, the probability to occasionally choose a right figure was theoretically estimated and equalled 1,344/9 ≈ 0,149. Likewise, the probability of making an occasional error would be (9-1,344)/9 ≈ 0,851.Having determined the elementary events and their probabilities, we can apply the Shannonian approach:  | (2) |
where I is the quantity of information resulting from some i-th event, the probability of which is P. Using the formula (2), one can estimate, for example, that a single “right” message bears log2(0,149) ≈ 2,74 bits, while a double “right” message bears log2(0,149*0,149) ≈ 5,49 bits, and so on.If a participant was to randomly choose the figures, the sequences of zeros and units would still appear in any case. Still, it would not be reasonable to consider them to bear any useful information. Rather, random clicking would most probably produce informational noise. To differentiate between the noise and the useful information, we used a comparison of frequency distributions for a random process and the distributions resulting from participants’ activity. Suppose Pr(N) is a distribution resulting from random clicking, where N is the length of the series of zeros or units, e.g., “00” has the length 2, “000” and “111” the length 3, etc., Pp(N) will then stand for a distribution resulting from a real participant’s attempt. Therefore, the task is to compare Pr(N) and Pp(N) to ascertain whether the participant’s work differs from random clicking.A simple way to get the answer is to build a confidence interval of the sort LL(N)≤Pp(N)≤UL(N), where LL and UL stand for the lower and upper limits of the interval, respectively. To estimate the LL and UL, we performed multiple computer calculations using the same algorithm that was implemented in the RWR program. For right choices we modelled the random clicking of 100 individuals, and for wrong choices we modelled 200 individuals; the latter was required due to the greater variety of wrong choice sequences. This approach is often called Monte Carlo modelling.If Pp(N) was greater than UL(N) for a particular N, we interpreted this as the participant having received useful information and calculated its amount with the help of formula (2). A graphical explanation of the comparison is given in Figure 2.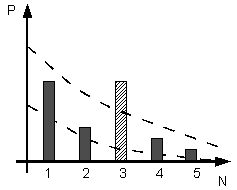 | Figure 2. A fictitious example of comparison of a Pp(N) (bars) distribution and the confidence interval (dashed lines). For N = 1, 2, 4, 5 Pp fall within the UL and LL of the confidence interval. For N = 3 Pp goes beyond the confidence interval and is considered to differ significantly from a random clicking |
The classical entropy-based view of information may be formulated as “what is not known” because a message that is known beforehand bears no information. We may summarise the explanations above by defining useful information as “what is beyond random”.
3. Results and Discussion
The students were free in shaping their schedule, including the attempts they made, the quantity of which was not limited. In the data, 33 participants made only one attempt, and 21 participants made from two up to ten attempts. Therefore, we had to treat the data of the participants who made a unique attempt and of those with multiple attempts jointly.In regard to learning through multiple attempts, two extreme views are possible. The first is that an individual’s attempts are isolated, so the individual does not remember much of what was done in previous attempts. The second is that the individual remembers all previous attempts and learns from all of them. It was not our aim to decide which statement is closer to reality. Each of these views is only partially right. However, they present useful reference points from which to evaluate the data obtained.Figure 3 shows the distribution of isolated attempts, both successful and unsuccessful, on the axis “sum of negative information” (SNI) against the axis “sum of positive information” (SPI). The data help to answer some of the questions posed above. First of all, the amount of negative information, i.e., the information above random frequencies of some mistake series, does constitute a significant value in many cases. Sixty-three out of 68 attempts shown in Figure 3 have a significant share of negative information. An additional 37 attempts having neither significant positive information nor significant negative information are not shown in the figure and are discussed below.Compared to positive information, negative information is quite a peculiar thing in itself. In regard to the former, participants knew the goal - to get as many right clicks in sequence as possible. So, we can reasonably suppose that each participant consciously tried to get not merely an isolated right click but to get longer sequences of right clicks. It was the sequence of right clicks that determined the end of the test.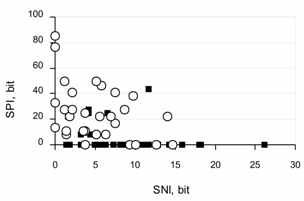 | Figure 3. Distribution of isolated participants’ attempts on the axis “sum of negative information” (SNI) against the axis “sum of positive information” (SPI). Each symbol stands for a single attempt: ○ stands for successful attempts, and ▪ stands for unsuccessful attempts |
In contrast, no one regulated wrong clicks. No rewards or punishments, except for possible discomfort, were associated with wrong clicks. Therefore, while it was unlikely that wrong clicks were the goal, if anything, they may have been an instrument to get right clicks. Every wrong click bore definite information, specifically that the chosen combination of shape, colour, and size of the previous figure was wrong. If participants were able to put forward hypotheses and properly treat the received negative information, they would be likely to always produce a definite series of wrong clicks before the next right one, which would result in a non-randomly higher share of such series in the overall distribution. That is what we would define as “to learn from mistakes”.Also, as follows from Figure 3, the share of positive information was certainly larger than that of negative information in the majority of successful attempts. Still, some successful attempts showed only negative information flow. Most unsuccessful attempts showed a prevalence of negative information. Generally speaking, larger shares of positive information can be expected because the positive information came to participants in larger proportions, due to the lower probability of right clicks in the problem.Figure 4 shows a distribution of participants’ results on the axis “sum of negative information” against the axis “sum of positive information”. The inferences made on the basis of Figure 3 are partially valid here as well because of sufficient overlapping in the data (participants with only one attempt). More importantly, because the data are based on individual people, they allow us to pay attention to the main question of the study.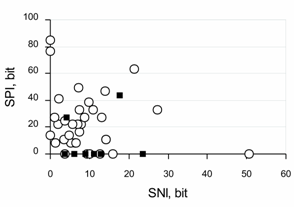 | Figure 4. Distribution of participants’ results on the axis “sum of negative information” (SNI) against the axis “sum of positive information” (SPI). Each symbol stands for a participant: ○ stands for a successful participant, while ▪ stands for an unsuccessful participant |
It is not very surprising that for successful experience-based learning, individuals require positive information, i.e., in our case, multiple confirmations of the right choices. Three successful participants used only positive information. Perhaps it is also not surprising that some individuals required a combination of positive and negative information for learning. The significant shares if negative information are noteworthy in our case: it means that a great majority of the participants did use negative information.The surprise is those six successful participants who seemed to use solely negative information. Their right clicks did not go beyond random clicking until the successful series of right clicks. Their wrong clicks were not random, which may mean that they were able to properly treat the mistakes they made and so achieve the goal. Such unusual behaviour requires more attention. So, the six protocols of the participants were once again investigated and at least five of them aroused no suspicion of cheating. Therefore, 8-9% of the whole participant population can learn exclusively from mistakes, at least within the context of the research problem presented in this study.Finally, we would like to mention the participants with zero information attempts. On the whole, there were 5 unsuccessful and 11 successful participants who madeattempts in which neither positive nor negative non-randomness was registered.There are two sources of such randomness. The first is true randomness. It could be that a participant really clicks randomly or close to that, and this could explain the failure of participants but not the success. The second source is compensation. All of the participants with zero information made rather lengthy attempts lasting from 300 clicks to over 1000, and sometimes they spent up to an hour on the work. It is likely that they showed one type of non-randomness in one sequence of the data and another type in another sequence of the data. In the calculation of an overall distribution, the sequences could have balanced each other out so that the resulting distribution fell completely within the confidence interval. All of this requires a more detailed analysis, which lies outside of the scope of this study.
4. Conclusions
To conclude, the data provided evidence that useful negative information constitutes a significant value for many learning individuals. Most probably, negative information contributes less in the total information flow as compared to positive information. However, a conspicuous portion of the participants seemed to use solely negative information during experience-based learning.We would like also mention some advantages and limitations of the study.We believe that introduction of information science approaches will favour the development of behavioural sciences. It is necessary however to remember that the estimates of information values depend on the way in which information is measured. Still, it seems important to use the units accepted in information theory whenever possible in behavioural research. Psychological studies that use their own units or no measurements at all make it hard to compare their results with others in a broad scientific context. At the same time, the theory of information as a solid natural science provides such a basis for wide comparisons.A certain limitation may be seen in the very scheme of the study. Because the conditions for the participants were very easy the study explores rather observation of natural behaviour than experimenting in a strictly defined environment. The results obtained should be tested in a laboratory experiment.Another limitation concerns the adopted treatment of the data. The treatment model implies that the results would be available when a participant has finished the problem solving, i.e., only post factum inferences are possible rather than a real-time monitoring of the problem solving. To allow the latter, we should develop a different model of the information estimation.
ACKNOWLEDGEMENTS
We thank Krasnoyarsk State Pedagogical University named after V.P. Astafiev for the Internet server space and Mr. Sergey Glasner for consultations in programming.
References
| [1] | Rescorla, R.A., & Wagner, A.R. "A theory of Pavlovian conditioning: variations in the effectiveness of reinforcement and nonreinforcement", In A.H.Black & W.F.Prokasy (eds.), Classical conditioning II: current research and theory. New-York: Appleton-Century-Crofts, pp. 64-99, 1972. |
| [2] | John K. Kruschke, "Human Category Learning: Implications for Backpropagation Models", Connection Science, no. 2, pp. 3–36, 1993. |
| [3] | F. A. Soto, E. A. Wasserman, "Error-Driven Learning in Visual Categorization and Object Recognition: A Common Elements Model", Psychological Review, no. 117, pp. 349-381, 2010. |
| [4] | E. Brill, "Transformation-Based Error-Driven Learning and Natural Language Processing: A Case Study in Part-of-Speech Tagging", Computational Linguistics, no. 21, pp. 543-565, 1995. |
| [5] | C. B. Holroyd, M. G. H. Coles, "The Neural Basis of Human Error Processing: Reinforcement Learning, Dopamine, and the Error-Related Negativity", Psychological Review, no. 109, pp. 679-709, 2002. |
| [6] | B. Kopp, M. Wolff, "Brain mechanisms of selective learning: event-related potentials provide evidence for error-driven learning in humans", Biological Psychology, no. 51, pp. 223-246, 2000. |
| [7] | Y. Niv, G. Schoenbaum, "Dialogues on prediction errors". Trends in Cognitive Sciences, 12, pp. 265—272, 2008. |
| [8] | R. C. O'Reilly, "Six principles for biologically based computational models of cortical cognition", Trends in Cognitive Sciences, no. 2, pp. 455-462, 1998. |
| [9] | E. L. Thorndike, Animal intelligence, Macmillan, N.Y., USA, 1911. |
| [10] | R. M. Yerkes, The Mental Life of Monkeys and Apes: A Study of Ideational Behavior. In. J.B. Watson (Ed.) Behavior Monographs, USA, 1916. |
| [11] | J.D. Smith, "The study of animal metacognition", Trends in Cognitive Sciences, no. 13, pp. 389-396, 2009. |
| [12] | G. A. Miller, "The Magical Number Seven, Plus or Minus Two. Some Limits on Our Capacity for Processing Information", Psychological Review, no. 101, pp. 343-352, 1994. |
| [13] | R.V.L. Hartley, "Transmission of Information", Bell System Technical Journal, v. 7, no. 3, pp. 535–563, 1928. |
| [14] | C.E. Shannon, "A Mathematical Theory of Communication", Bell System Technical Journal, no. 27, pp. 379–423, 1948. |
| [15] | A. Kolmogorov, "Three approaches to the definition of the concept "quantity of information", Probl. Peredachi Inf., no. 1, pp. 3–11, 1965. |
| [16] | V. Gavrikov, R. Khlebopros, "An Approach to Visualize the Course of Solving of a Research Task in Humans", Online Available: http://arxiv.org/abs/1005.0605, 2010. |
 Abstract
 Reference
 Full-Text PDF
 Full-Text HTML